DASD for DBAs The Stuff You Need to

DASD for DBAs – The Stuff You Need to Know Julian Stuhler, Triton Consulting Session Code: A 04 03: 45, Monday 16 th November 2015 Platform: DB 2 for z/OS
Topics • • • Introduction DB 2 & DASD – A Primer Measuring & Tuning DB 2 I/O Performance Case Study Conclusion 2
Introduction • DB 2 consultant with Triton Consulting, based in the UK • 28 years DB 2 experience • Database Administration • Systems Programming • Application Development • • IBM Gold Consultant IBM Champion IBM White Papers, Redbooks, Flashbooks, etc IDUG Best Speaker and Past President 3
Introduction – Presentation Scope • I/O monitoring and tuning is a huge topic, this presentation will look at the major DB 2 I/O considerations from an application performance / DBA’s perspective • Many other aspects not covered, including • • Buffer pool tuning Dataset placement (not as relevant nowadays anyway) DB 2 log I/O Hardware / channel configuration DASD logical volume sizing Disk-level caching SMS configuration 4
Topics • • • Introduction DB 2 & DASD – A Primer Measuring & Tuning I/O Performance Case Study Conclusion 5
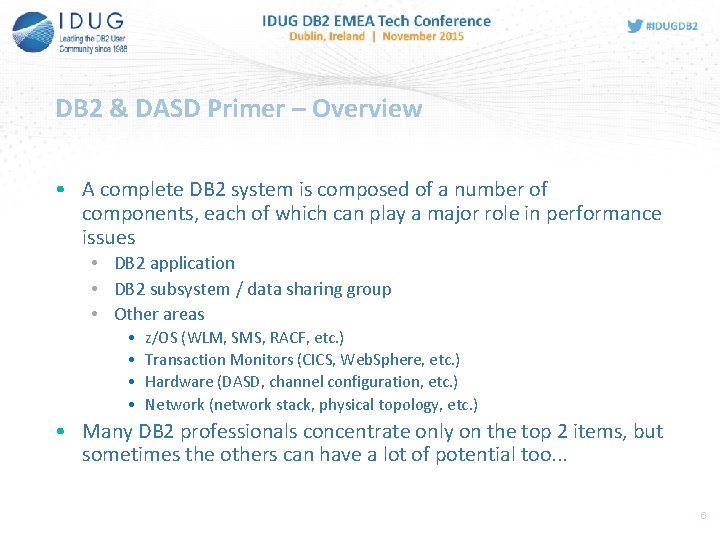
DB 2 & DASD Primer – Overview • A complete DB 2 system is composed of a number of components, each of which can play a major role in performance issues • DB 2 application • DB 2 subsystem / data sharing group • Other areas • • z/OS (WLM, SMS, RACF, etc. ) Transaction Monitors (CICS, Web. Sphere, etc. ) Hardware (DASD, channel configuration, etc. ) Network (network stack, physical topology, etc. ) • Many DB 2 professionals concentrate only on the top 2 items, but sometimes the others can have a lot of potential too. . . 6
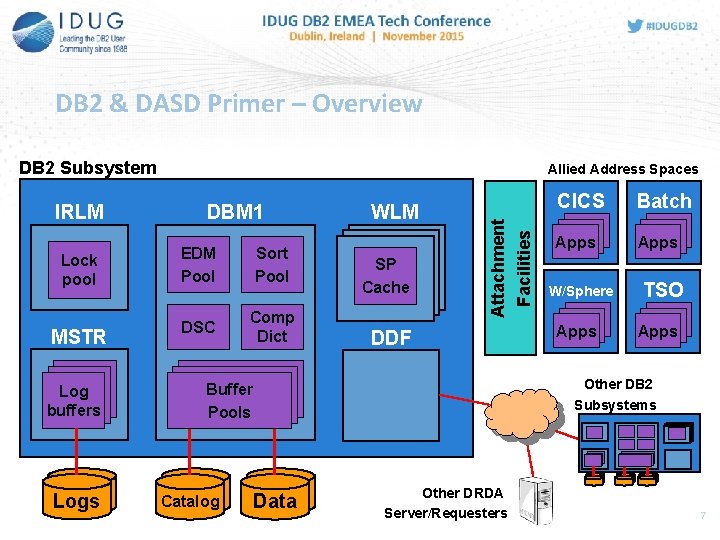
DB 2 & DASD Primer – Overview DB 2 Subsystem DBM 1 Lock pool EDM Pool Sort Pool MSTR DSC Comp Dict Log buffers Logs WLM SP Cache Attachment Facilities IRLM Allied Address Spaces DDF Buffer Pools Logs Catalog Logs Data CICS Batch Apps W/Sphere Apps TSO Apps Other DB 2 Subsystems Other DRDA Server/Requesters 7
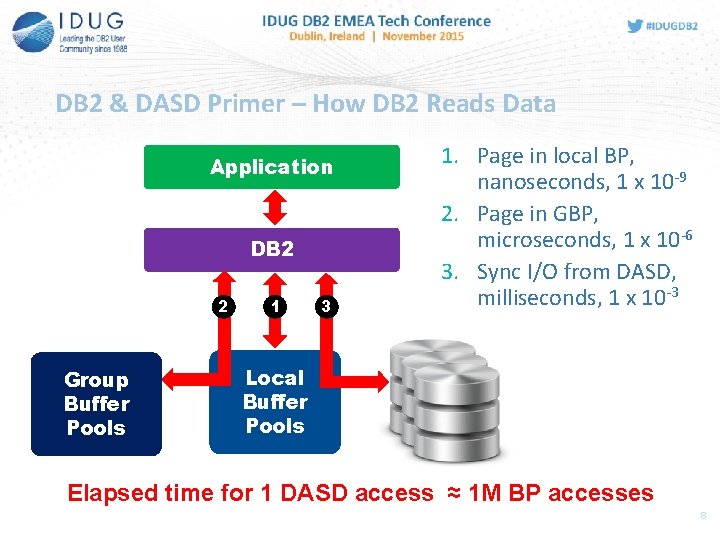
DB 2 & DASD Primer – How DB 2 Reads Data Application DB 2 2 Group Buffer Pools 1 3 1. Page in local BP, nanoseconds, 1 x 10 -9 2. Page in GBP, microseconds, 1 x 10 -6 3. Sync I/O from DASD, milliseconds, 1 x 10 -3 Local Buffer Pools Elapsed time for 1 DASD access ≈ 1 M BP accesses 8
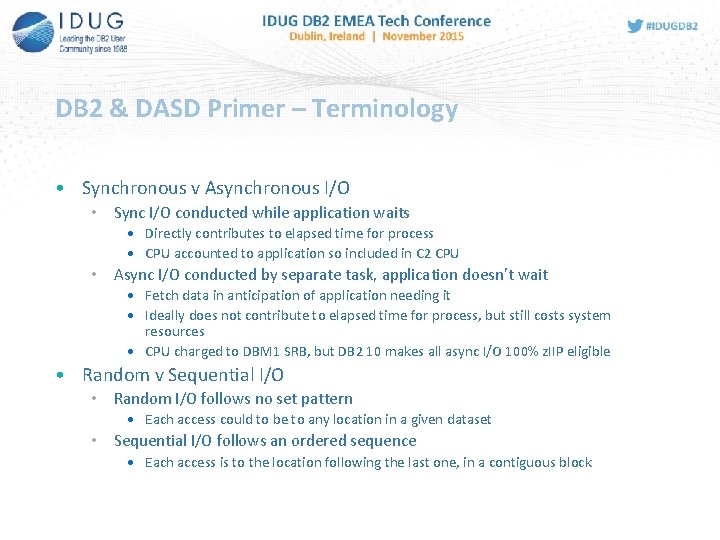
DB 2 & DASD Primer – Terminology • Synchronous v Asynchronous I/O • Sync I/O conducted while application waits • Directly contributes to elapsed time for process • CPU accounted to application so included in C 2 CPU • Async I/O conducted by separate task, application doesn’t wait • Fetch data in anticipation of application needing it • Ideally does not contribute to elapsed time for process, but still costs system resources • CPU charged to DBM 1 SRB, but DB 2 10 makes all async I/O 100% z. IIP eligible • Random v Sequential I/O • Random I/O follows no set pattern • Each access could to be to any location in a given dataset • Sequential I/O follows an ordered sequence • Each access is to the location following the last one, in a contiguous block

DB 2 & DASD Primer – Terminology • HDD v SSD • Hard Disk Drive (HDD) • Traditional magnetic media, consisting of one or more spinning platters • Source of many familiar DASD terms (sector, cylinder, etc) • Mature technology, relatively slow, relatively cheap • 4 k random sync I/O ≈ 5 – 10 ms (cache miss) • Solid State Disk (SSD) • Devices based on non-volatile NAND flash memory, able to retain data without power • Newer technology (in Enterprise terms), relatively quick (no seek or rotational delay), relatively expensive (but getting cheaper) • 4 k random sync I/O ≈ 0. 6 – 1. 0 ms (cache miss) 10
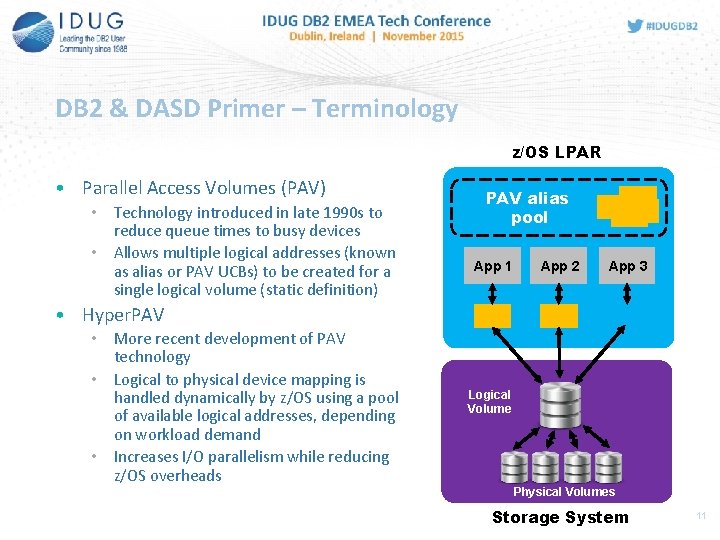
DB 2 & DASD Primer – Terminology z/OS LPAR • Parallel Access Volumes (PAV) • Technology introduced in late 1990 s to reduce queue times to busy devices • Allows multiple logical addresses (known as alias or PAV UCBs) to be created for a single logical volume (static definition) PAV alias pool App 1 App 2 App 3 • Hyper. PAV • More recent development of PAV technology • Logical to physical device mapping is handled dynamically by z/OS using a pool of available logical addresses, depending on workload demand • Increases I/O parallelism while reducing z/OS overheads Logical Volume Physical Volumes Storage System 11
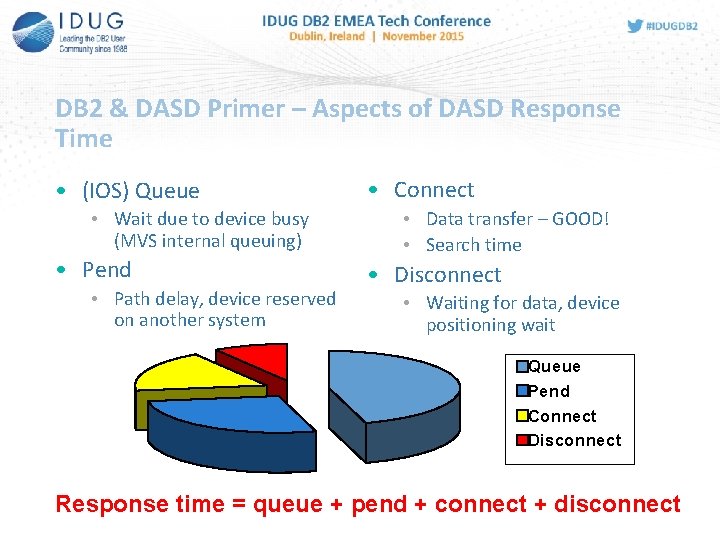
DB 2 & DASD Primer – Aspects of DASD Response Time • (IOS) Queue • Wait due to device busy (MVS internal queuing) • Pend • Path delay, device reserved on another system • Connect • Data transfer – GOOD! • Search time • Disconnect • Waiting for data, device positioning wait Queue Pend Connect Disconnect Response time = queue + pend + connect + disconnect
DB 2 & DASD Primer – More Terminology! • Other terms you may hear (but not necessarily need to understand in depth!) • High Performance FICON (aka z. HPF) and • High Performance FIbre CONnection, IBM’s latest enterprise I/O protocol, replacing older ESCON and FICON standards • Triples maximum IOPS for random I/Os with correct channel configuration, reduces connect time • All DB 2 I/O is able to use it, especially beneficial for list prefetch operations • List Prefetch Optimiser • Storage subsystem feature aimed at reducing disconnect time • Needs z. HPF • Originally supported by IBM DS 8000 systems only, now available from other vendors such as EDS • MIDAW (Modified Indirect Data Address Word) • Optimisation of standard z/OS channel programming to improve efficiency of FICON channels – DB 2 workloads are especially suitable • AMP (Adaptive Multi-stream Prefetch) • Autonomic control of prefech size/timing 13
Topics • • • Introduction DB 2 & DASD – A Primer Measuring & Tuning DB 2 I/O Performance Case Study Conclusion 14
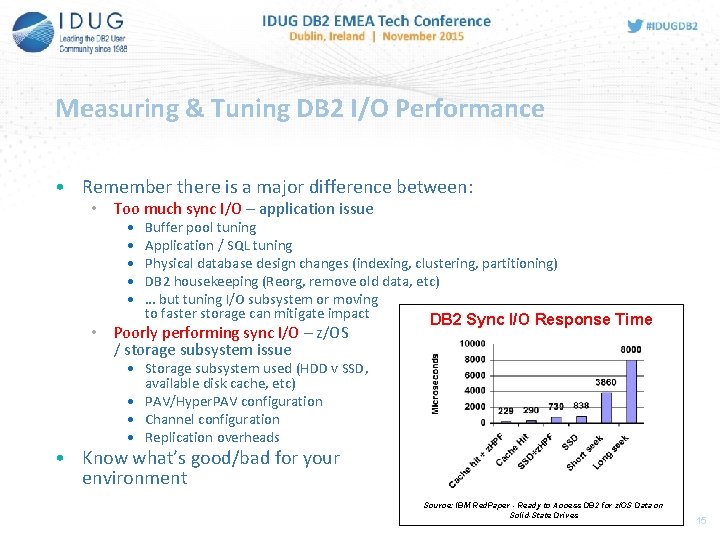
Measuring & Tuning DB 2 I/O Performance • Remember there is a major difference between: • Too much sync I/O – application issue • • • Buffer pool tuning Application / SQL tuning Physical database design changes (indexing, clustering, partitioning) DB 2 housekeeping (Reorg, remove old data, etc) … but tuning I/O subsystem or moving to faster storage can mitigate impact DB 2 Sync I/O Response Time • Poorly performing sync I/O – z/OS / storage subsystem issue • Storage subsystem used (HDD v SSD, available disk cache, etc) • PAV/Hyper. PAV configuration • Channel configuration • Replication overheads • Know what’s good/bad for your environment Source: IBM Red. Paper - Ready to Access DB 2 for z/OS Data on Solid-State Drives 15
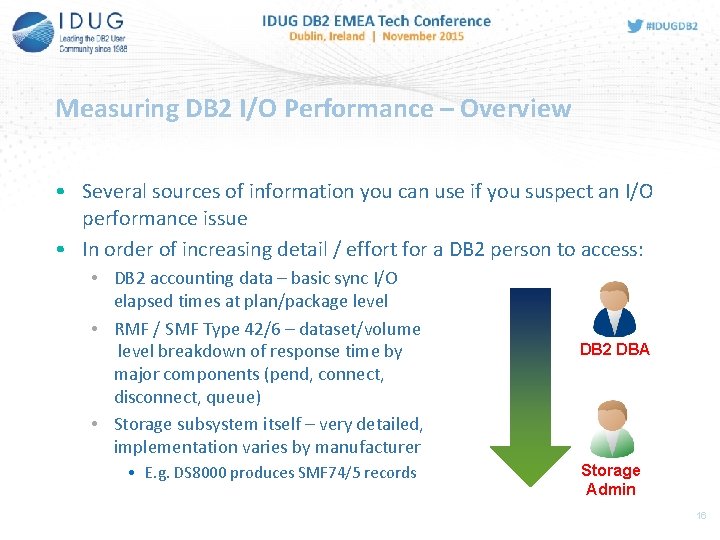
Measuring DB 2 I/O Performance – Overview • Several sources of information you can use if you suspect an I/O performance issue • In order of increasing detail / effort for a DB 2 person to access: • DB 2 accounting data – basic sync I/O elapsed times at plan/package level • RMF / SMF Type 42/6 – dataset/volume level breakdown of response time by major components (pend, connect, disconnect, queue) • Storage subsystem itself – very detailed, implementation varies by manufacturer • E. g. DS 8000 produces SMF 74/5 records DB 2 DBA Storage Admin 16
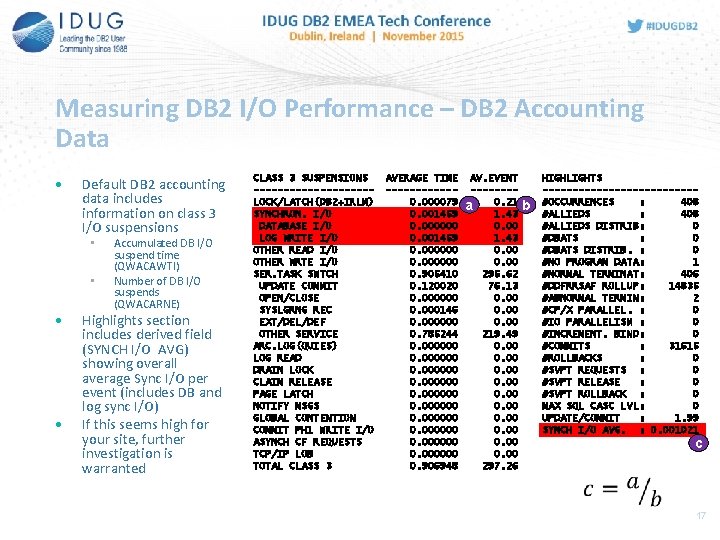
Measuring DB 2 I/O Performance – DB 2 Accounting Data • Default DB 2 accounting data includes information on class 3 I/O suspensions • • Accumulated DB I/O suspend time (QWACAWTI) Number of DB I/O suspends (QWACARNE) Highlights section includes derived field (SYNCH I/O AVG) showing overall average Sync I/O per event (includes DB and log sync I/O) If this seems high for your site, further investigation is warranted CLASS 3 SUSPENSIONS ----------LOCK/LATCH(DB 2+IRLM) SYNCHRON. I/O DATABASE I/O LOG WRITE I/O OTHER READ I/O OTHER WRTE I/O SER. TASK SWTCH UPDATE COMMIT OPEN/CLOSE SYSLGRNG REC EXT/DEL/DEF OTHER SERVICE ARC. LOG(QUIES) LOG READ DRAIN LOCK CLAIM RELEASE PAGE LATCH NOTIFY MSGS GLOBAL CONTENTION COMMIT PH 1 WRITE I/O ASYNCH CF REQUESTS TCP/IP LOB TOTAL CLASS 3 AVERAGE TIME ------0. 000079 0. 001459 0. 000000 0. 905410 0. 120020 0. 000000 0. 000146 0. 000000 0. 785244 0. 000000 0. 906948 AV. EVENT -------0. 21 a 1. 43 0. 00 295. 62 76. 13 0. 00 219. 49 0. 00 0. 00 297. 26 b HIGHLIGHTS -------------#OCCURRENCES : 408 #ALLIEDS DISTRIB: 0 #DBATS DISTRIB. : 0 #NO PROGRAM DATA: 1 #NORMAL TERMINAT: 406 #DDFRRSAF ROLLUP: 14835 #ABNORMAL TERMIN: 2 #CP/X PARALLEL. : 0 #IO PARALLELISM : 0 #INCREMENT. BIND: 0 #COMMITS : 31615 #ROLLBACKS : 0 #SVPT REQUESTS : 0 #SVPT RELEASE : 0 #SVPT ROLLBACK : 0 MAX SQL CASC LVL: 0 UPDATE/COMMIT : 1. 99 SYNCH I/O AVG. : 0. 001021 c 17
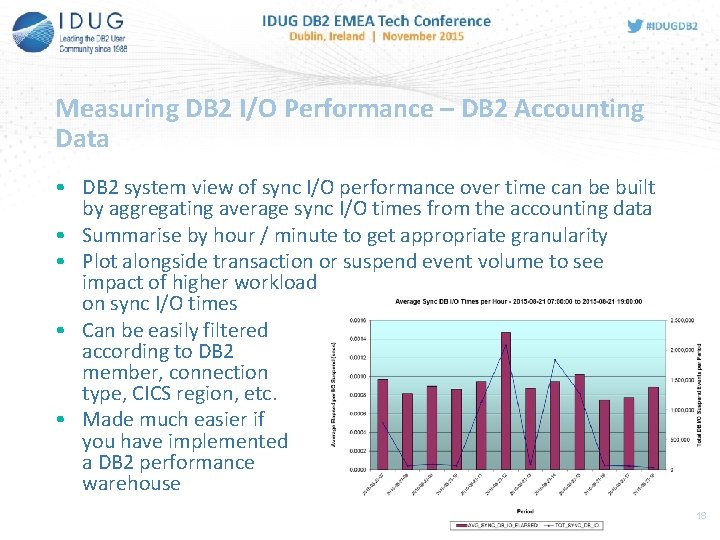
Measuring DB 2 I/O Performance – DB 2 Accounting Data • DB 2 system view of sync I/O performance over time can be built by aggregating average sync I/O times from the accounting data • Summarise by hour / minute to get appropriate granularity • Plot alongside transaction or suspend event volume to see impact of higher workload on sync I/O times • Can be easily filtered according to DB 2 member, connection type, CICS region, etc. • Made much easier if you have implemented a DB 2 performance warehouse 18
Measuring DB 2 I/O Performance – SMF 42/6 • SMF 42 (DFSMS Statistics and Configuration) • Many variations, but Subtype 6 records DASD data set level I/O statistics • Two events that cause subtype 6 to be generated • Immediately after writing SMF 30 interval record (one SMF 42/6 record for each SMF 30 interval record) • Dataset close • Wealth of useful information • Job name, dataset, volume, avg. /max I/O response, total I/Os, connect, pend, disconnect, queue • Filter for Jobname=DBM 1 address space to see DB 2 application data I/O statistics • Provides very useful breakdown of overall response time, as well as dataset and volume-level analysis • Load data into a DB 2 table and make part of your performance warehouse
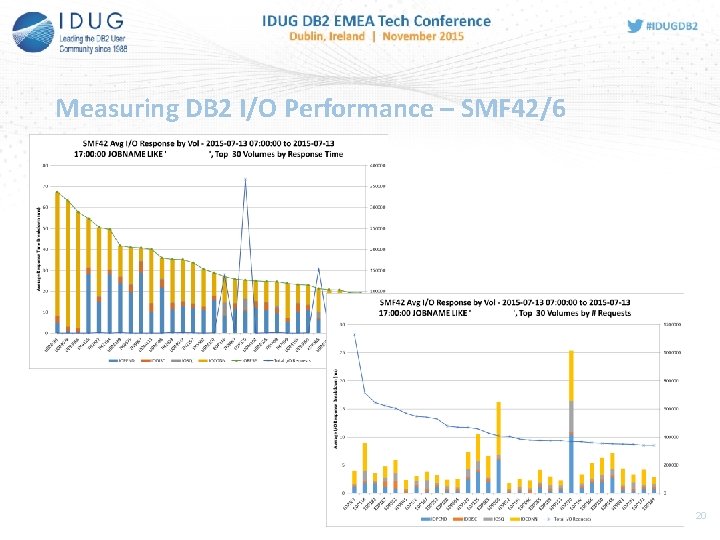
Measuring DB 2 I/O Performance – SMF 42/6 20
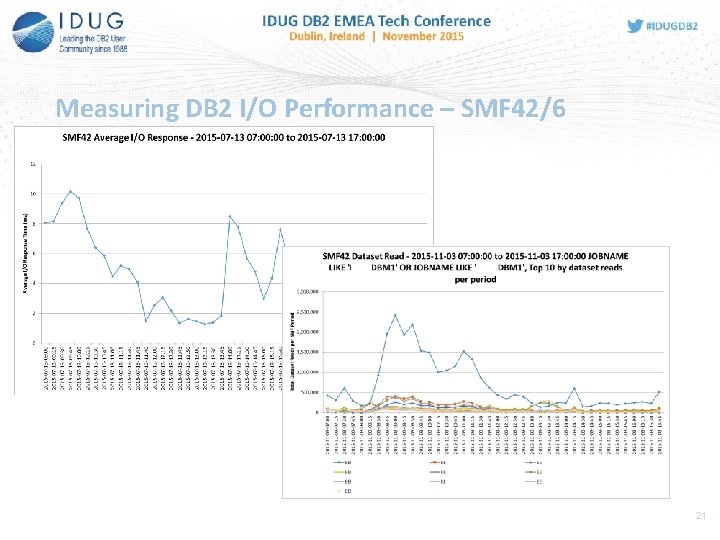
Measuring DB 2 I/O Performance – SMF 42/6 21
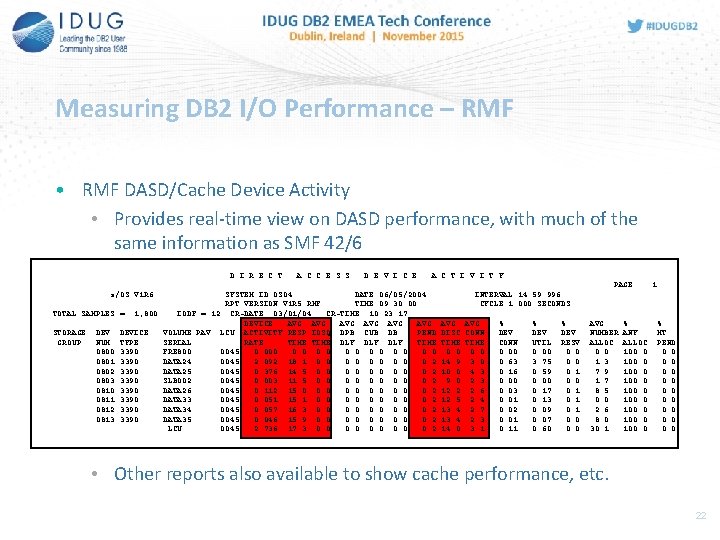
Measuring DB 2 I/O Performance – RMF • RMF DASD/Cache Device Activity • Provides real-time view on DASD performance, with much of the same information as SMF 42/6 D I R E C T A C C E S S D E V I C E A C T I V I T Y PAGE z/OS V 1 R 6 TOTAL SAMPLES STORAGE GROUP DEV NUM 0800 0801 0802 0803 0810 0811 0812 0813 SYSTEM ID OS 04 DATE 06/05/2004 RPT VERSION V 1 R 5 RMF TIME 09. 30. 00 = 1, 800 IODF = 12 CR-DATE: 03/01/04 CR-TIME: 10. 23. 17 DEVICE AVG AVG AVG DEVICE VOLUME PAV LCU ACTIVITY RESP IOSQ DPB CUB DB PEND TYPE SERIAL RATE TIME DLY DLY TIME 3390 FRE 800 0045 0. 000 0. 0 0. 0 3390 DATA 24 0045 2. 092 18. 1 0. 0 0. 2 3390 DATA 25 0045 0. 376 14. 5 0. 0 0. 2 3390 SLB 002 0045 0. 003 11. 5 0. 0 0. 2 3390 DATA 26 0045 0. 112 15. 0 0. 2 3390 DATA 33 0045 0. 051 15. 1 0. 0 0. 2 3390 DATA 34 0045 0. 057 16. 3 0. 0 0. 2 3390 DATA 35 0045 0. 046 15. 9 0. 0 0. 2 LCU 0045 2. 736 17. 3 0. 0 0. 2 1 INTERVAL 14. 59. 996 CYCLE 1. 000 SECONDS AVG DISC CONN TIME 0. 0 14. 9 3. 0 10. 0 4. 3 9. 0 2. 3 12. 2 2. 6 12. 5 2. 4 13. 4 2. 7 13. 4 2. 3 14. 0 3. 1 % DEV CONN 0. 00 0. 63 0. 16 0. 00 0. 03 0. 01 0. 02 0. 01 0. 11 % DEV UTIL 0. 00 3. 75 0. 59 0. 00 0. 17 0. 13 0. 09 0. 07 0. 60 % DEV RESV 0. 0 0. 1 0. 0 AVG NUMBER ALLOC 0. 0 1. 3 7. 9 1. 7 8. 5 0. 0 2. 6 8. 0 30. 1 % ANY ALLOC 100. 0 100. 0 % MT PEND 0. 0 0. 0 • Other reports also available to show cache performance, etc. 22
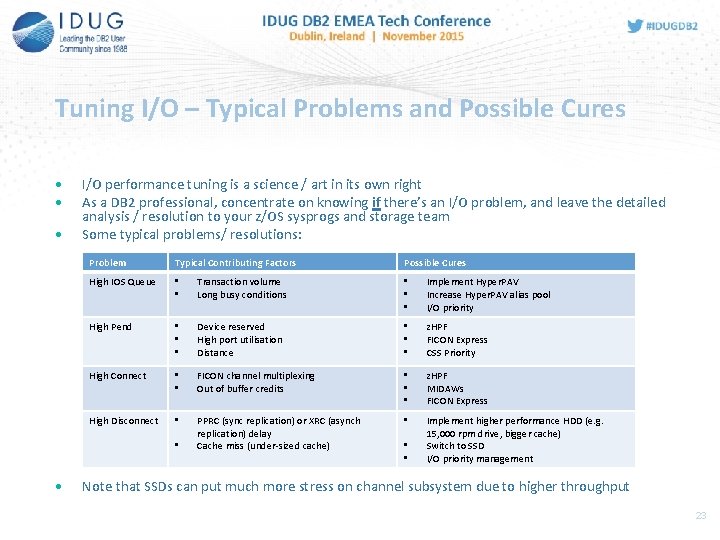
Tuning I/O – Typical Problems and Possible Cures • • • I/O performance tuning is a science / art in its own right As a DB 2 professional, concentrate on knowing if there’s an I/O problem, and leave the detailed analysis / resolution to your z/OS sysprogs and storage team Some typical problems/ resolutions: Problem Typical Contributing Factors High IOS Queue • • Transaction volume Long busy conditions • • • Implement Hyper. PAV Increase Hyper. PAV alias pool I/O priority High Pend • • • Device reserved High port utilisation Distance • • • z. HPF FICON Express CSS Priority High Connect • • FICON channel multiplexing Out of buffer credits • • • z. HPF MIDAWs FICON Express High Disconnect • PPRC (sync replication) or XRC (asynch replication) delay Cache miss (under-sized cache) • Implement higher performance HDD (e. g. 15, 000 rpm drive, bigger cache) Switch to SSD I/O priority management • • Possible Cures • • Note that SSDs can put much more stress on channel subsystem due to higher throughput 23
Topics • • • Introduction DB 2 & DASD – A Primer Measuring & Tuning I/O Performance Case Study Conclusion 24
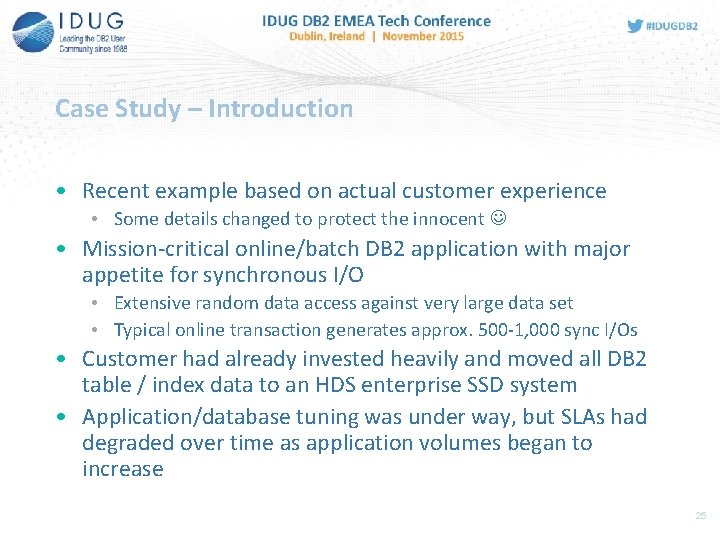
Case Study – Introduction • Recent example based on actual customer experience • Some details changed to protect the innocent • Mission-critical online/batch DB 2 application with major appetite for synchronous I/O • Extensive random data access against very large data set • Typical online transaction generates approx. 500 -1, 000 sync I/Os • Customer had already invested heavily and moved all DB 2 table / index data to an HDS enterprise SSD system • Application/database tuning was under way, but SLAs had degraded over time as application volumes began to increase 25
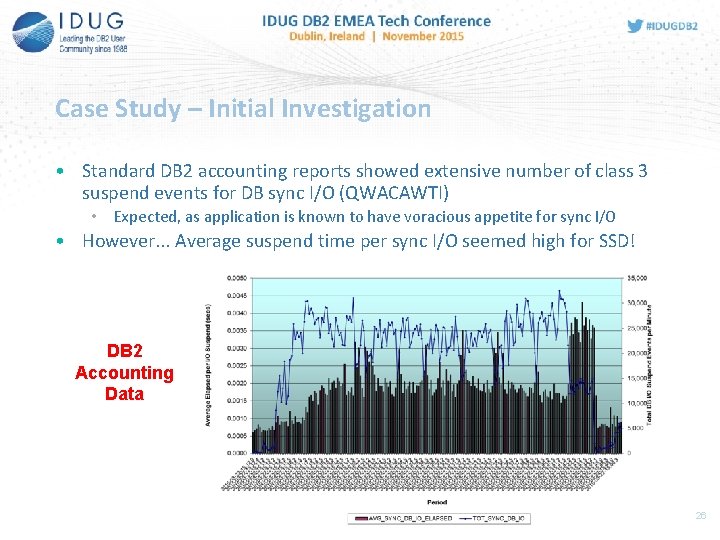
Case Study – Initial Investigation • Standard DB 2 accounting reports showed extensive number of class 3 suspend events for DB sync I/O (QWACAWTI) • Expected, as application is known to have voracious appetite for sync I/O • However. . . Average suspend time per sync I/O seemed high for SSD! DB 2 Accounting Data 26
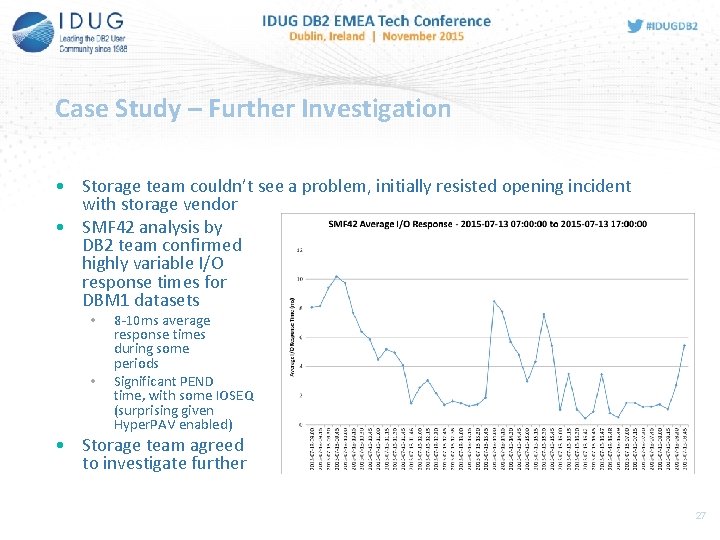
Case Study – Further Investigation • Storage team couldn’t see a problem, initially resisted opening incident with storage vendor • SMF 42 analysis by DB 2 team confirmed highly variable I/O response times for DBM 1 datasets • • 8 -10 ms average response times during some periods Significant PEND time, with some IOSEQ (surprising given Hyper. PAV enabled) • Storage team agreed to investigate further 27
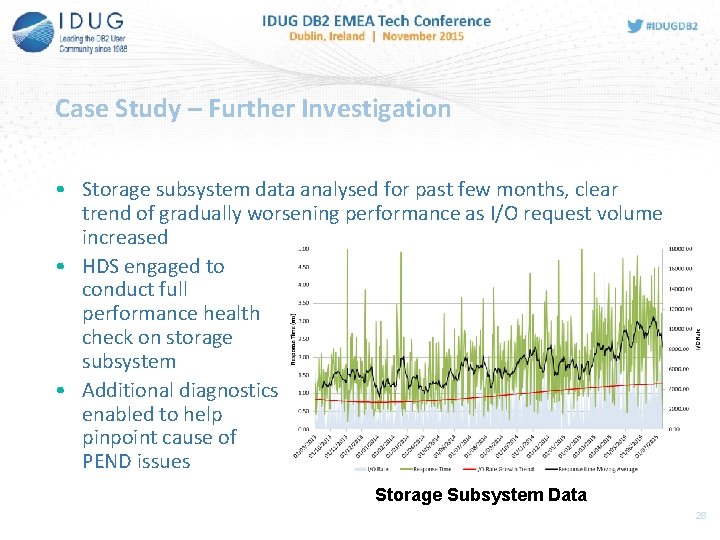
Case Study – Further Investigation • Storage subsystem data analysed for past few months, clear trend of gradually worsening performance as I/O request volume increased • HDS engaged to conduct full performance health check on storage subsystem • Additional diagnostics enabled to help pinpoint cause of PEND issues Storage Subsystem Data 28
Case Study – Major Tuning Actions • HDS performance report detected significant imbalance between utilisation of the 4 control unit processor boards, with one consistently >70% busy • Action: Rebalanced storage processor allocation (non disruptive change), resulting in all processors <40% busy at peak • Remaining IOSQ issue traced to shortage of Hyper. PAV aliases, maximum regularly being reached at peak times • Action: Additional Hyper. PAV aliases added • Caution: Increasing alias pool not always the answer, can be caused by sudden write spikes as buffer pools flushed – see http: //blog. intellimagic. com/less-ismore-why-32 -hyperpavs-are-better-than-128/ • HDS performance report recommended microcode upgrade • Action: Upgraded to Disk Microcode from level 70 -06 -28 to 70 -06 -32 • General performance benefits, but also enabled z/HPF List Prefetch Optimizer which helped elsewhere 29
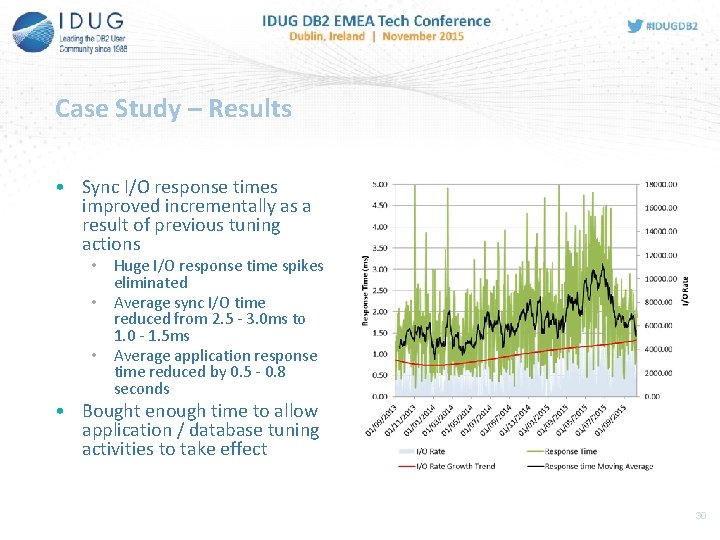
Case Study – Results • Sync I/O response times improved incrementally as a result of previous tuning actions • Huge I/O response time spikes eliminated • Average sync I/O time reduced from 2. 5 - 3. 0 ms to 1. 0 - 1. 5 ms • Average application response time reduced by 0. 5 - 0. 8 seconds • Bought enough time to allow application / database tuning activities to take effect 30

Topics • • • Introduction DB 2 & DASD – A Primer Measuring & Tuning I/O Performance Case Study Conclusion 31
Conclusion • Avoid I/O when you can – “the best I/O is no I/O” • • SQL / application tuning Physical database design Data organisation / housekeeping Local & group buffer pool tuning • Some I/O is of course inevitable, but monitor it and take steps to address the problem if performance is poor • Understand what’s good/bad for your environment • Use the instrumentation (DB 2 accounting data, RMF, SMF 42 Subtype 6) • Make friends with your storage administrator, and if you see poor I/O performance make a pest of yourself until it’s sorted! • Don’t forget other critical areas we didn’t have time to cover (e. g. DB 2 log I/O and new features such as z. Hyper. Write) 32
Useful References • IBM Redpaper: Ready to Access DB 2 for z/OS Data on Solid-State Drives • http: //www. redbooks. ibm. com/redpapers/pdfs/redp 4537. pdf • IBM Redpaper: How does the MIDAW facility improve the performance of FICON channels with DB 2 and other workloads • http: //www. redbooks. ibm. com/redpapers/pdfs/redp 4201. pdf • IBM Redbook: DB 2 9 for z/OS and Storage Management • http: //www. redbooks. ibm. com/redbooks/pdfs/sg 247823. pdf • IBM Redpaper: DB 2 for z/OS and List Prefetch Optimizer • http: //www. redbooks. ibm. com/redpapers/pdfs/redp 4862. pdf • IBM Systems Magazine: Make DB 2 Zip with IBM’s z. Hyper. Write • http: //www. ibmsystemsmag. com/mainframe/administrator/db 2/z. Hyp er. Write-zip/ 33

Julian Stuhler Triton Consulting julian. Stuhler@triton. co. uk DASD for DBAs – The Stuff You Need to Know Please fill out your session evaluation before leaving!
- Slides: 34