
Danish Tvdrama Me CETES Ib Bondebjerg Dan Pedersen
Danish Tv-drama Me. CETES, Ib Bondebjerg & Dan Pedersen November 2013
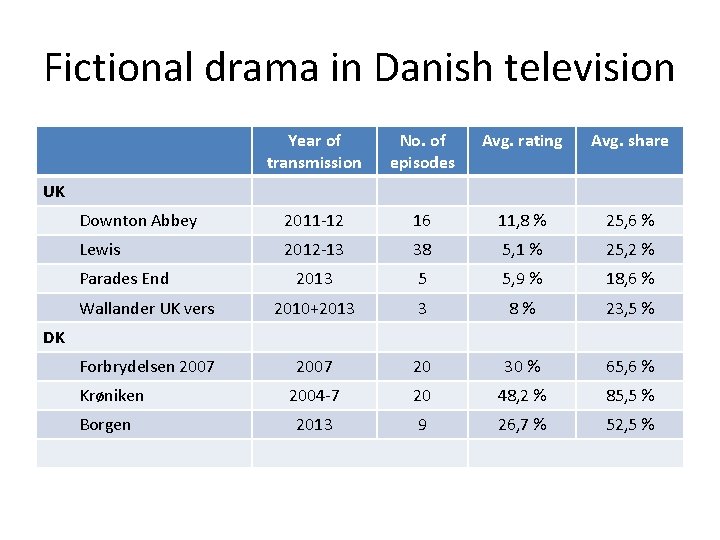
Fictional drama in Danish television Year of transmission No. of episodes Avg. rating Avg. share Downton Abbey 2011 -12 16 11, 8 % 25, 6 % Lewis 2012 -13 38 5, 1 % 25, 2 % 2013 5 5, 9 % 18, 6 % Wallander UK vers 2010+2013 3 8% 23, 5 % Forbrydelsen 2007 20 30 % 65, 6 % 2004 -7 20 48, 2 % 85, 5 % 2013 9 26, 7 % 52, 5 % UK Parades End DK Krøniken Borgen
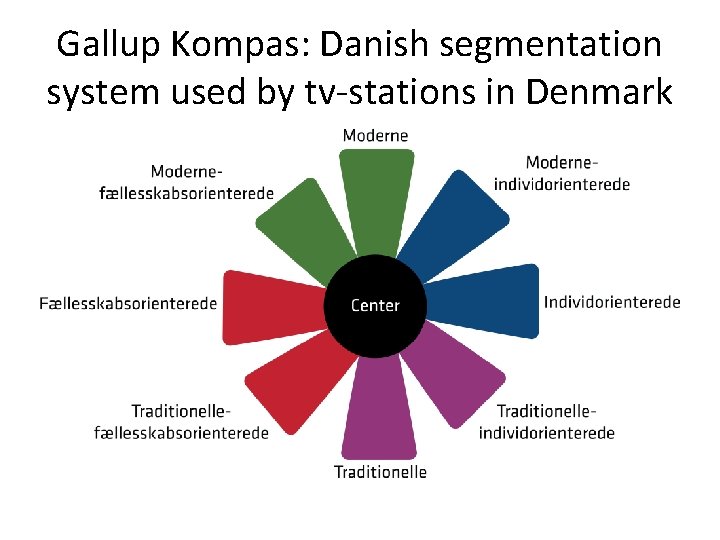
Gallup Kompas: Danish segmentation system used by tv-stations in Denmark
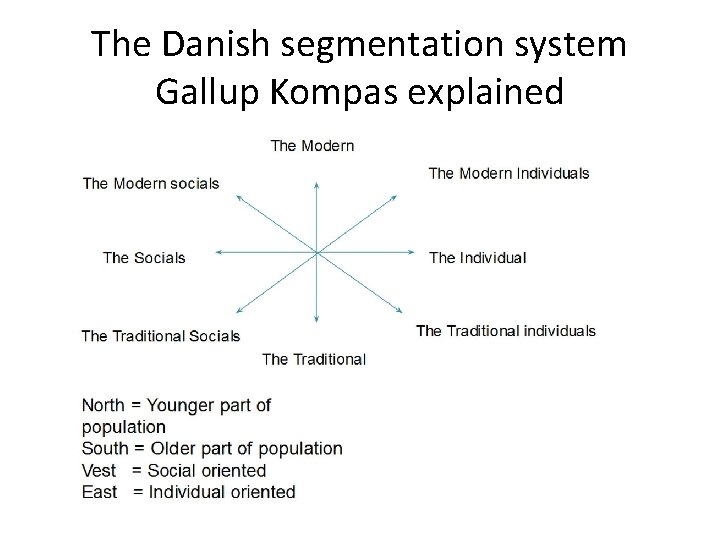
The Danish segmentation system Gallup Kompas explained
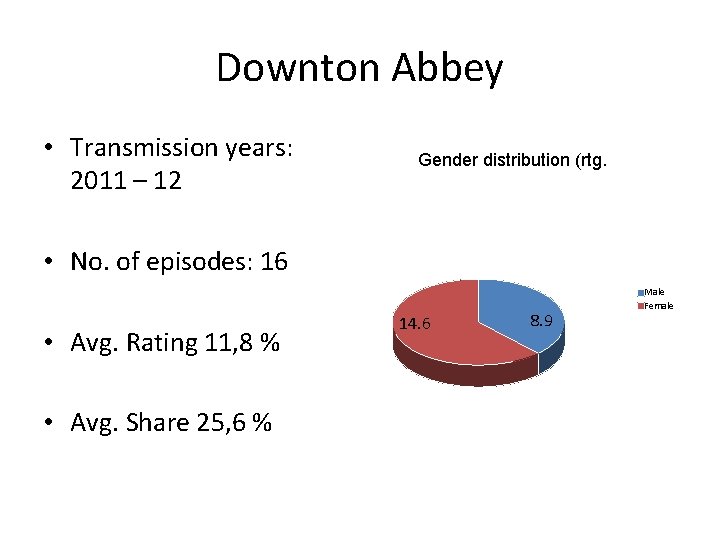
Downton Abbey • Transmission years: 2011 – 12 Gender distribution (rtg. • No. of episodes: 16 • Avg. Rating 11, 8 % • Avg. Share 25, 6 % 14. 6 8. 9 Male Female
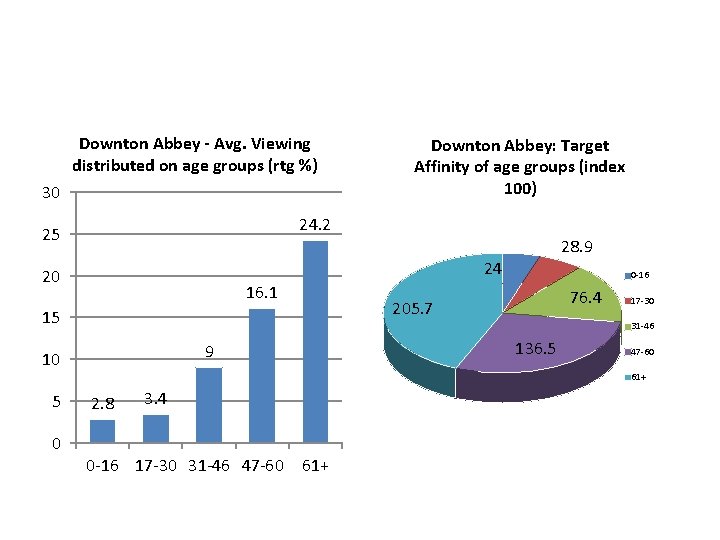
Downton Abbey - Avg. Viewing distributed on age groups (rtg %) 30 Downton Abbey: Target Affinity of age groups (index 100) 24. 2 25 28. 9 24 20 16. 1 0 -16 76. 4 205. 7 15 17 -30 31 -46 136. 5 9 10 47 -60 61+ 5 0 2. 8 3. 4 0 -16 17 -30 31 -46 47 -60 61+
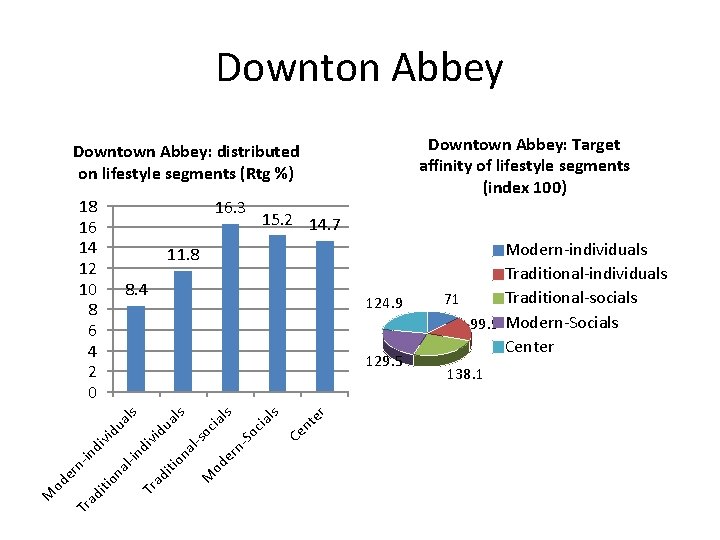
Downton Abbey Downtown Abbey: Target affinity of lifestyle segments (index 100) Downtown Abbey: distributed on lifestyle segments (Rtg %) 18 16 14 12 10 8 6 4 2 0 16. 3 11. 8 8. 4 s d Tr ivi ad du iti al on s al -so M cia od ls er n. So cia ls Ce nt er al du al -in ivi in d iti on ner 124. 9 129. 5 Tr ad od M 15. 2 14. 7 Modern-individuals Traditional-socials 71 99. 9 Modern-Socials Center 138. 1
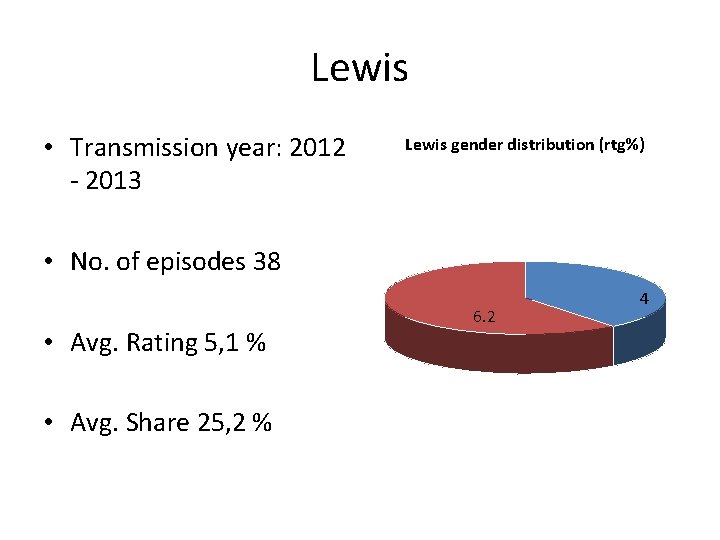
Lewis • Transmission year: 2012 - 2013 Lewis gender distribution (rtg%) • No. of episodes 38 • Avg. Rating 5, 1 % • Avg. Share 25, 2 % 6. 2 4
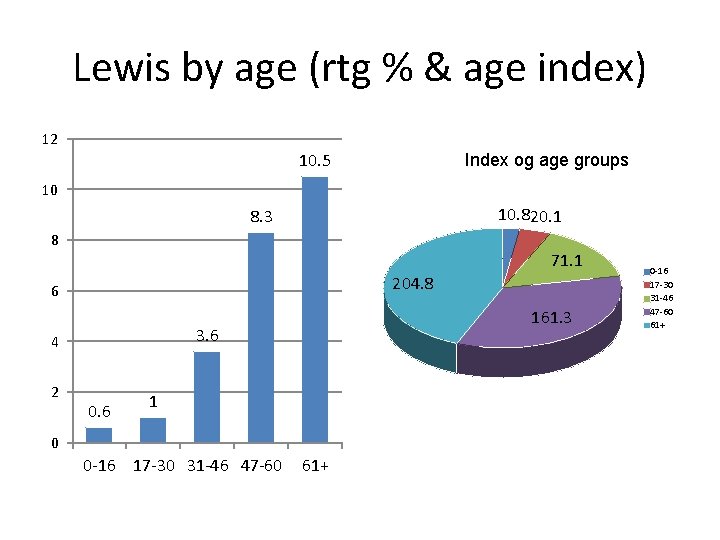
Lewis by age (rtg % & age index) 12 10. 5 Index og age groups 10 10. 820. 1 8. 3 8 71. 1 204. 8 6 3. 6 4 2 161. 3 0. 6 1 0 0 -16 17 -30 31 -46 47 -60 61+
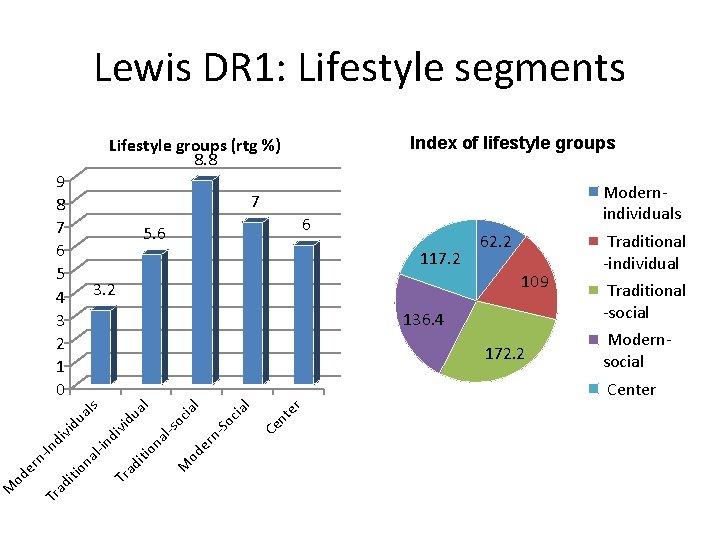
Lewis DR 1: Lifestyle segments Index of lifestyle groups Lifestyle groups (rtg %) 8. 8 9 8 7 6 5 4 3 2 1 0 117. 2 62. 2 109 3. 2 136. 4 172. 2 Traditional -individual Traditional -social Modernsocial So ner od M r te Ce n l cia l ia na l-s oc du Tr ad l-i na iti o di nd ivi vid ua al ls Center In Tr 6 5. 6 ad er nod M Modernindividuals 7
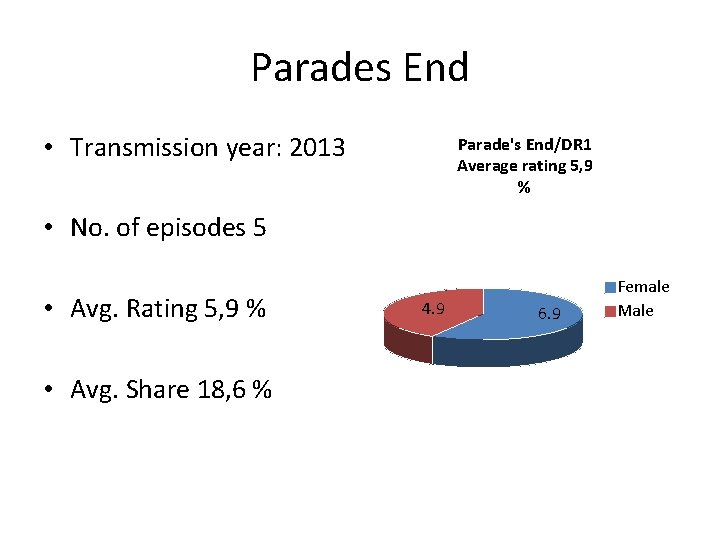
Parades End • Transmission year: 2013 Parade's End/DR 1 Average rating 5, 9 % • No. of episodes 5 • Avg. Rating 5, 9 % • Avg. Share 18, 6 % 4. 9 6. 9 Female Male
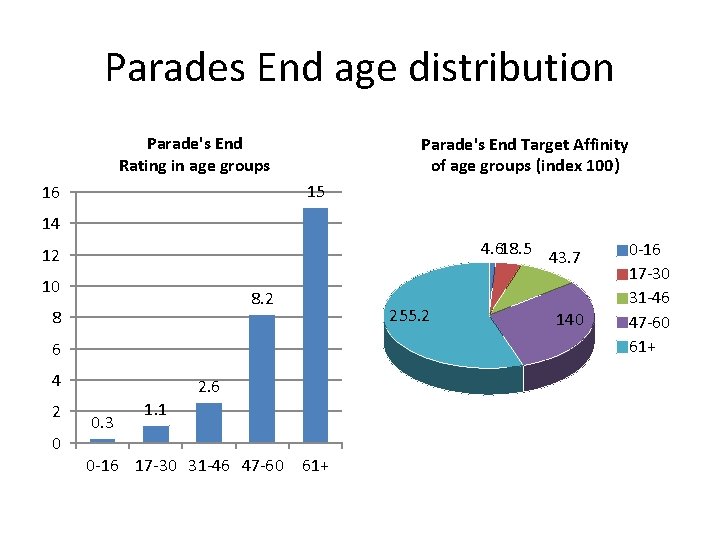
Parades End age distribution Parade's End Rating in age groups Parade's End Target Affinity of age groups (index 100) 15 16 14 4. 618. 5 43. 7 12 10 8. 2 8 255. 2 6 4 2 0 2. 6 0. 3 1. 1 0 -16 17 -30 31 -46 47 -60 61+ 140 0 -16 17 -30 31 -46 47 -60 61+
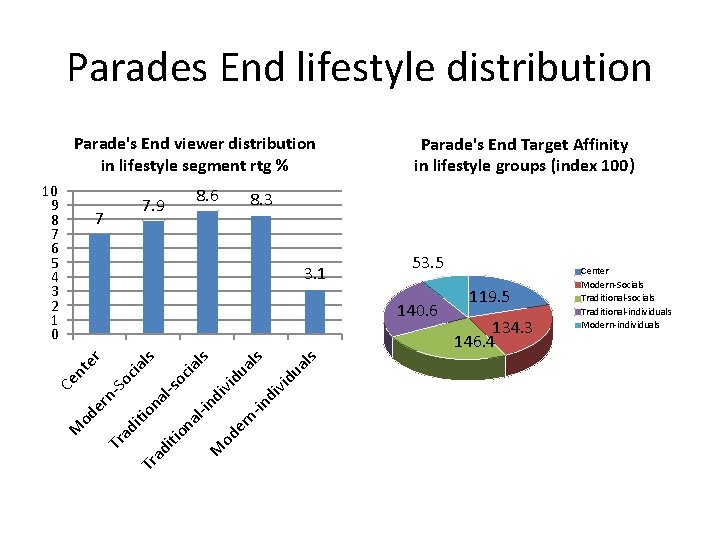
Parades End lifestyle distribution Parade's End viewer distribution in lifestyle segment rtg % 10 9 8 7 6 5 4 3 2 1 0 7. 9 7 8. 6 Parade's End Target Affinity in lifestyle groups (index 100) 8. 3 3. 1 53. 5 na l-s tio oc na ia l-i ls n M di od vid er ua nls in di vid ua ls cia ls tio Tr ad i M od er n- So Ce n te r 140. 6 119. 5 134. 3 146. 4 Center Modern-Socials Traditional-socials Traditional-individuals Modern-individuals
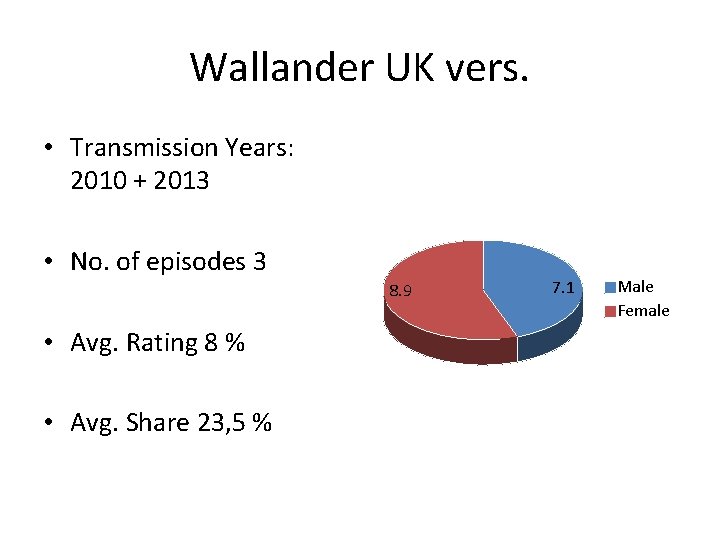
Wallander UK vers. • Transmission Years: 2010 + 2013 • No. of episodes 3 8. 9 • Avg. Rating 8 % • Avg. Share 23, 5 % 7. 1 Male Female
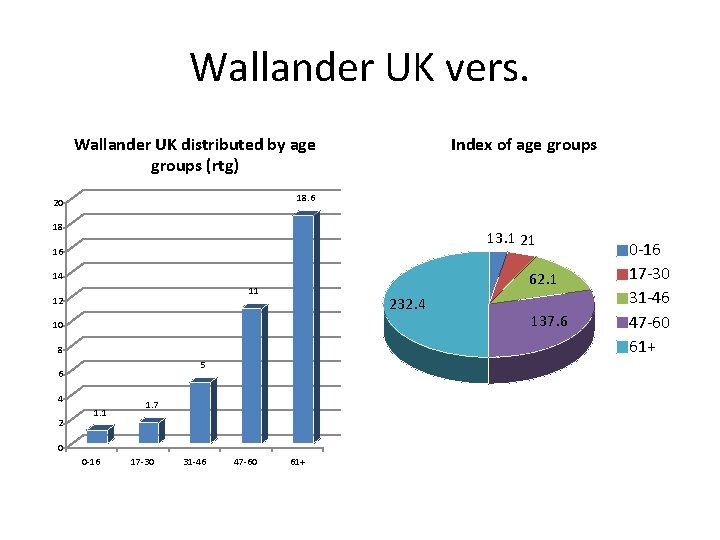
Wallander UK vers. Wallander UK distributed by age groups (rtg) Index of age groups 18. 6 20 18 13. 1 21 16 62. 1 14 11 12 232. 4 10 8 5 6 4 2 1. 1 1. 7 0 0 -16 17 -30 31 -46 47 -60 61+ 137. 6 0 -16 17 -30 31 -46 47 -60 61+
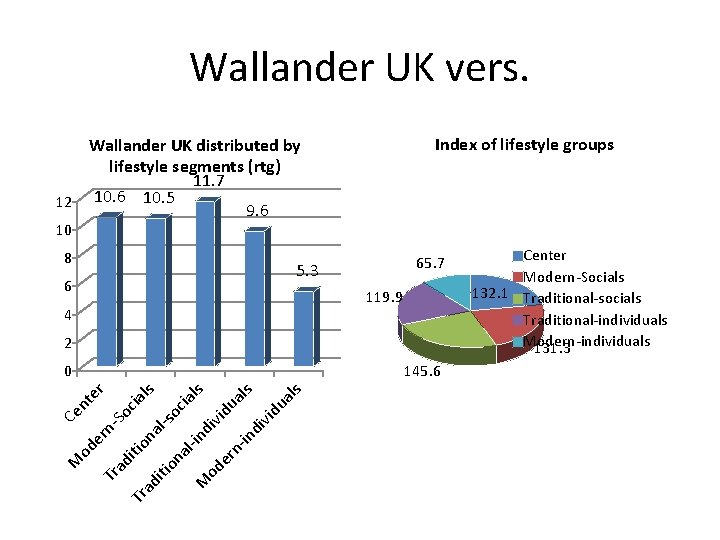
Wallander UK vers. Index of lifestyle groups Wallander UK distributed by lifestyle segments (rtg) 11. 7 12 10. 6 10. 5 9. 6 10 8 65. 7 5. 3 6 119. 9 4 2 Tr M ua ls di vid ua ls in n- er od al -in di vid cia ls ad iti on on iti ad Tr M od er al n- -so So cia nt Ce ls 145. 6 er 0 Center Modern-Socials 132. 1 Traditional-socials Traditional-individuals Modern-individuals 131. 3
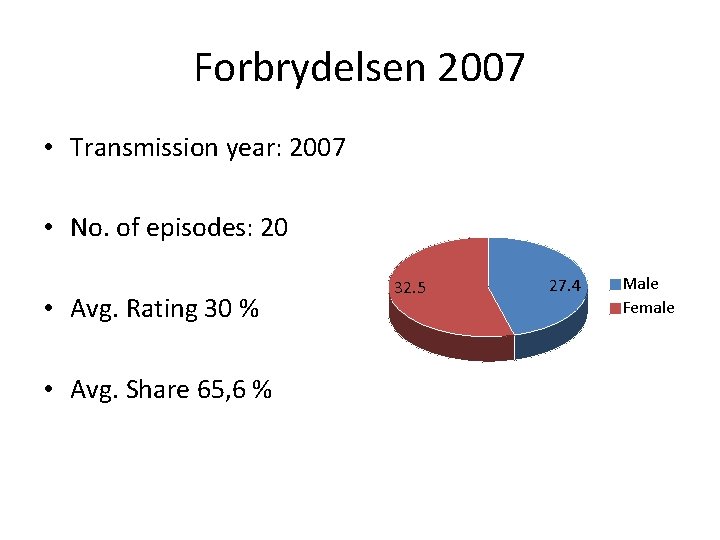
Forbrydelsen 2007 • Transmission year: 2007 • No. of episodes: 20 • Avg. Rating 30 % • Avg. Share 65, 6 % 32. 5 27. 4 Male Female
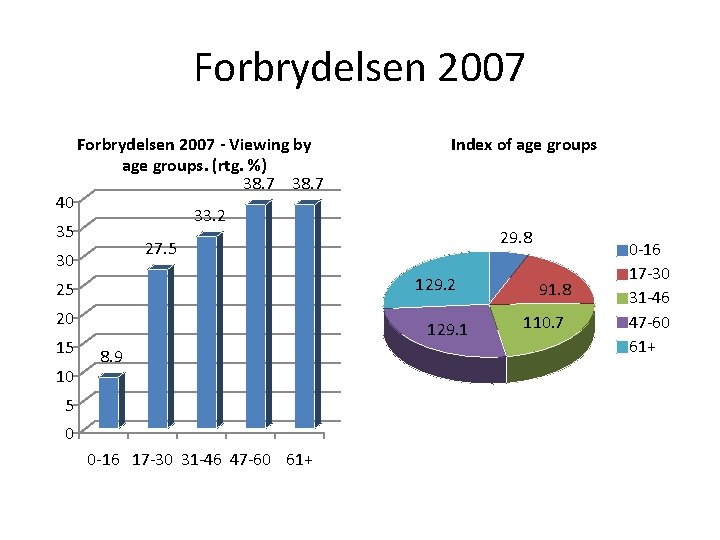
Forbrydelsen 2007 40 Forbrydelsen 2007 - Viewing by age groups. (rtg. %) 38. 7 33. 2 35 129. 2 25 20 10 29. 8 27. 5 30 15 Index of age groups 129. 1 8. 9 5 0 0 -16 17 -30 31 -46 47 -60 61+ 91. 8 110. 7 0 -16 17 -30 31 -46 47 -60 61+
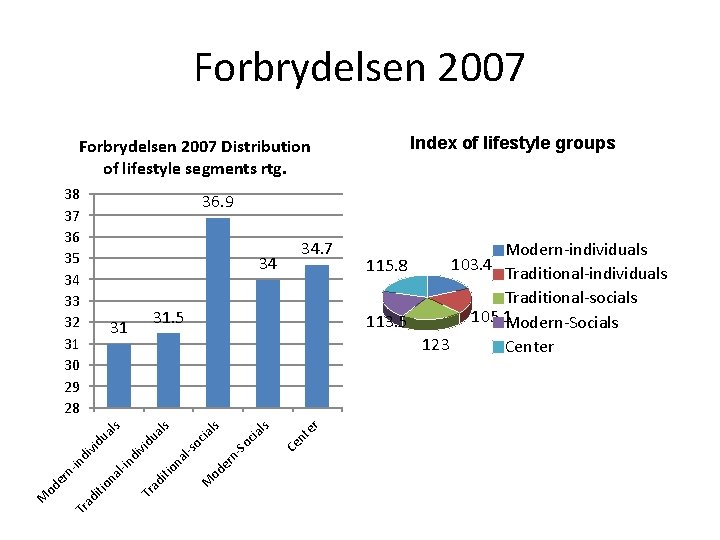
Forbrydelsen 2007 Distribution of lifestyle segments rtg. 38 37 36 35 34 33 32 31 30 29 28 36. 9 34 r te Ce n ls od er n- So cia ls oc ia M on a Tr ad iti -in di al on l-s vid ua l s s ua l vid di -in 34. 7 31. 5 31 Tr ad iti rn od e M Index of lifestyle groups Modern-individuals 103. 4 115. 8 Traditional-individuals Traditional-socials 105. 1 Modern-Socials 113. 5 123 Center
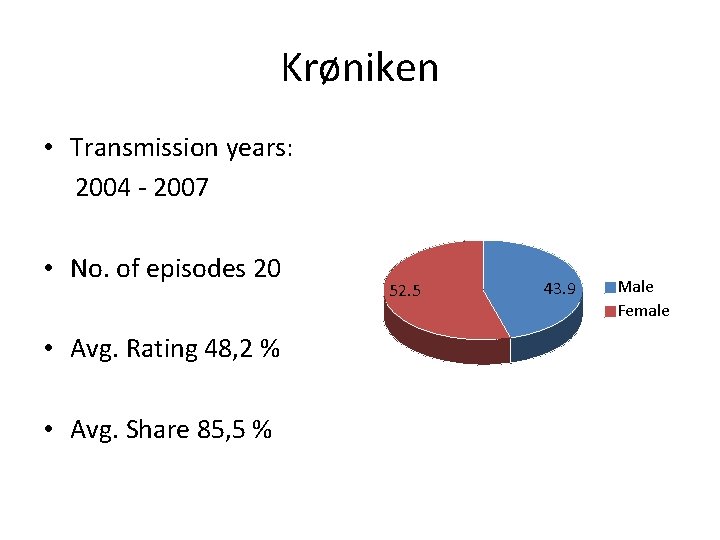
Krøniken • Transmission years: 2004 - 2007 • No. of episodes 20 • Avg. Rating 48, 2 % • Avg. Share 85, 5 % 52. 5 43. 9 Male Female
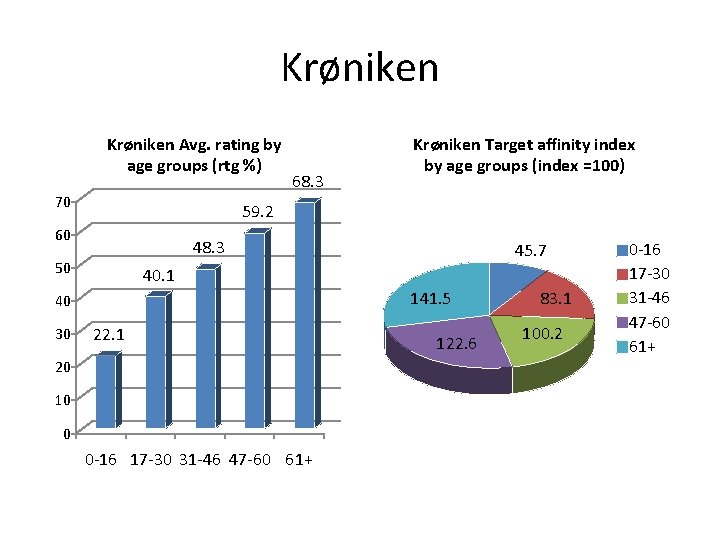
Krøniken Avg. rating by age groups (rtg %) 70 68. 3 59. 2 60 48. 3 50 45. 7 40. 1 141. 5 40 30 Krøniken Target affinity index by age groups (index =100) 22. 1 20 10 0 0 -16 17 -30 31 -46 47 -60 61+ 122. 6 83. 1 100. 2 0 -16 17 -30 31 -46 47 -60 61+
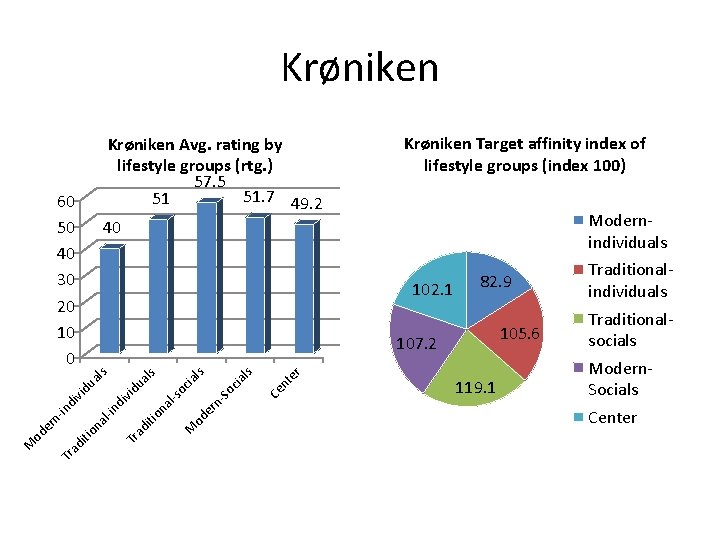
Krøniken Avg. rating by lifestyle groups (rtg. ) 57. 5 51. 7 49. 2 51 40 60 50 40 30 20 10 0 82. 9 105. 6 er nt Ce ls oc ia rn -S ls od e M on a l-s oc ia ls du a ad iti Tr on a l-i nd ivi du al s 107. 2 di vi rn -in Modernindividuals 102. 1 Tr ad iti od e M Krøniken Target affinity index of lifestyle groups (index 100) 119. 1 Traditionalindividuals Traditionalsocials Modern. Socials Center
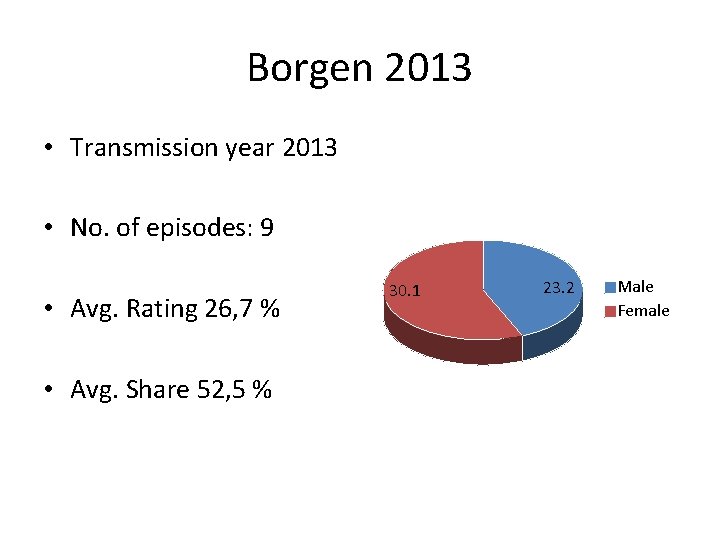
Borgen 2013 • Transmission year 2013 • No. of episodes: 9 • Avg. Rating 26, 7 % • Avg. Share 52, 5 % 30. 1 23. 2 Male Female
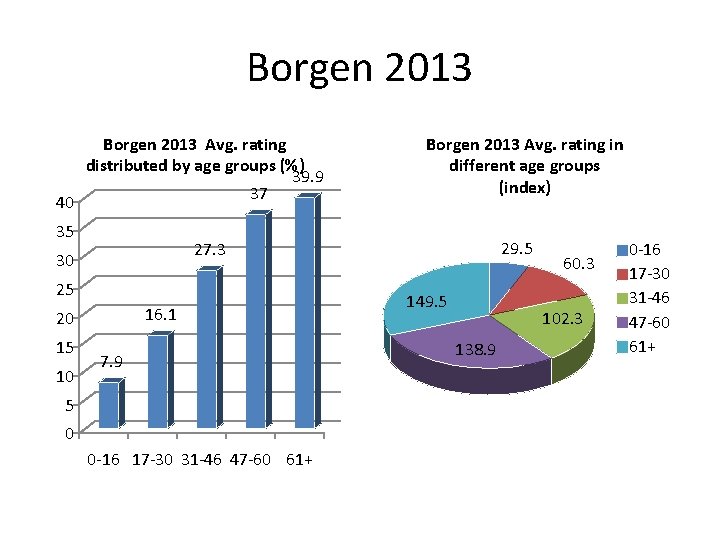
Borgen 2013 Avg. rating distributed by age groups (%) 39. 9 37 40 35 25 16. 1 20 10 29. 5 27. 3 30 15 Borgen 2013 Avg. rating in different age groups (index) 7. 9 5 0 0 -16 17 -30 31 -46 47 -60 61+ 149. 5 60. 3 102. 3 138. 9 0 -16 17 -30 31 -46 47 -60 61+
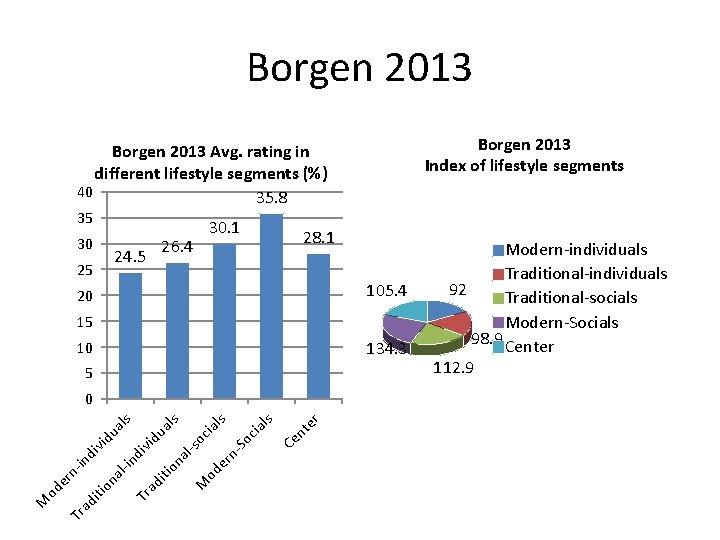
Borgen 2013 Index of lifestyle segments Borgen 2013 Avg. rating in different lifestyle segments (%) 40 35. 8 35 30 25 24. 5 26. 4 30. 1 28. 1 20 105. 4 15 10 5 iti on ad Tr M od er n- in d ivi du al al -in s d Tr ivi ad du iti al on s al -so M cia od ls er n. So cia ls Ce nt er 0 134. 3 Modern-individuals Traditional-individuals 92 Traditional-socials Modern-Socials 98. 9 Center 112. 9
- Slides: 25