Dalitz Plots I A powerful method for visualizing


 JP(t+)=0 - ?")
=0 - conflicts q+ p+p 0 decays")


 ρ f 2(980) σ Phys. Rev. D 73,")


- Slides: 22
Dalitz Plots I A powerful method for visualizing the dynamics in three-body particle systems Richard Dalitz 1925 -2006 Stephen Lars Olsen Graphics from Brian Lindquist (SLAC)
invented to study t+ p+p+p- decays photographic emulsion τ+ π+ ππ+ τ + π +π +π - mτ = 970 me (495 Me. V) R. Brown et al. , Nature 163, 47, 82 (1949) today, this is called a K+ p+p+p- decay
Fermi’s Golden Rule for 3 -body decays d. G d. E 1 d. E 2
in the case of t+ p+p+p- use T 3=Tp- , the plot is L-R symmetric & can be folded
Expectations for different t-meson JP values
data in 1954 Dalitz: data favors J-even, P=odd (-1) JP(t+)=0 - ?
JP(t+)=0 - conflicts q+ p+p 0 decays
1956: Weak interactions violate parity a discovery that can be attributed^to the 1 st application of Dalitz Plots In part, at least,
Dalitz Plots: old- vs modern-style old-style here symmetries are more obvious modern-style
A resonance on a Daltiz p 2 p 3 X p 1
parent with spin 1, 2 3 1 2 3
Resonance spin
Constructive interference very abrupt
Destructive interference
crossing resonances
Invariant mass histograms don’t give a clue about the physics
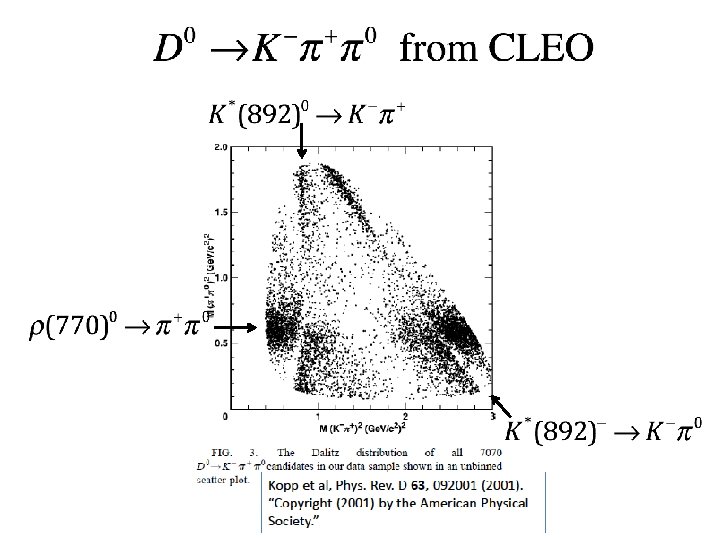
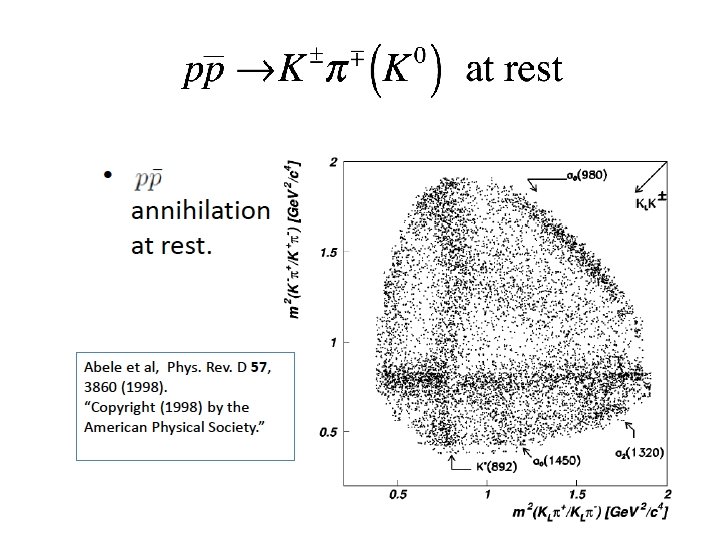
Dalitz plot tells all! reflections K*(892) ρ f 2(980) σ Phys. Rev. D 73, 112009 (2006)
Details
Dalitz plot symmetries only Ispin=1 allowed
Interpretation JP=0 -