DAC Data Analytics Using State and Local Data


- Slides: 28
DAC Data Analytics Using State and Local Data to Improve Results
DAC GOAL Form partnerships in states that join state and local agencies in the use of data to drive improved results
Premises Data Use involves: • Working through a Collaborative Team approach. • Engaging Team in a Continuous Improvement Process. • Relating the Data to specific Problem/Issue. Using Data is an Iterative Process!
Why Data Analysis? To identify strategies for continual improvement To be responsive when issues arise To avoid surprises during monitoring
Proactive Versus Reactive Proactive A process to review existing data to select priorities for program improvement. A process to determine program compliance and effectiveness. Reactive A process used to respond to a state identified problem. A process used to respond to a locally identified problem.
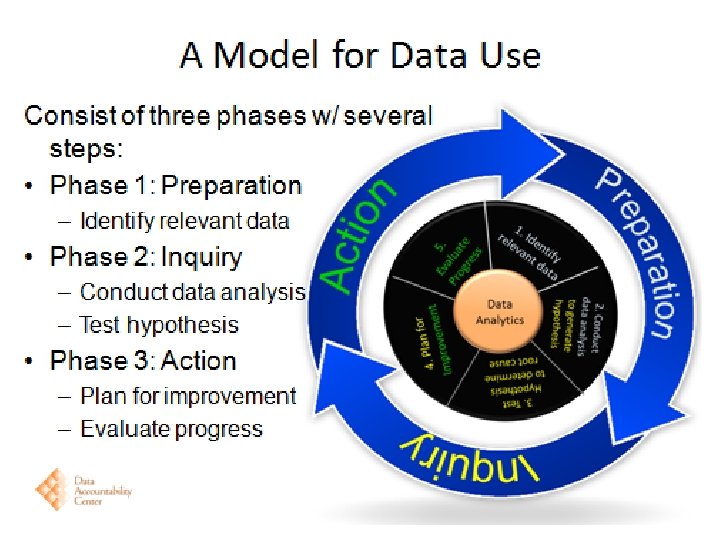
Preparation Phase Step 1: Identify Relevant Data Module 1 - Identify relevant data to define/refine problem • • Provide overview of data quality standards Demonstrate how to visually represent data Review available data Identify relevant data based on defined/refined problem
Inquiry Phase Step 2: Conduct Data Analysis Module 2 – Conduct data analysis to generate hypothesis • • Review relevant data Define hypothesis Analyze data Develop analysis plan
Inquiry Phase Step 3: Test Hypothesis Module 3 – Test hypothesis to determine root cause(s) • Triangulate data • Discuss how to test hypothesis • Determine root cause(s)
Action Phase Step 4: Plan for Improvement Module 4 – Improvement planning • Discuss goal setting • Review basic components of an improvement plan • Give examples of good v. unacceptable components of improvement plan • Develop improvement plan
Action Phase Step 5: Evaluate Progress Module 5 – Evaluate progress • Discuss evaluation types, performance data & measures • Differentiate between efforts v. effects
Infant & Toddler Connection of Virginia Data Analysis for System Improvement PREPARATION • Define the purpose and the people • Identify the people and the process • Identify relevant Data Analytic Model ACTION INQUIRY • Develop and Implement Improvement Plans • Evaluate Progress • Analyze the data • Generate and Test Hypotheses • Determine Actionable Causes
Data Quality Standards Question: How do we know if we are using high quality data? Answer: Data collected, submitted, analyzed, and reported must be: Timely Useful Accurate (Reliable and valid) Secure
Steps in Preparation What is the issue? Who needs to be involved and how will they interact? How long will it take? What data are available and how will it be displayed?
Collecting the Available Relevant Data What data are available related to the issue? State? Local? Other data sources? How many years of trend data should be reviewed? What data should be included for comparison purposes? State ? Other locality data? How can the data be disaggregated? By age of child? By service coordinator? By a time period? Do we have qualitative as well as quantitative data that relate to the issue?
For easy analysis how should the data be displayed? Possible ways to display data include: ØColumn charts ØBar charts ØLine charts ØPie charts ØMaps
Begin with Setting Guidelines Remind the Team • Ensure that your data are valid • Ensure that your data are reliable Remind the team • Follow the data where it leads you • Only make data-based decisions Remind the team • Leave Inquiry when you have determined Actionable Cause (s)
Generating a Hypotheses What actions in practice have contributed to local results in these areas: Infrastructu re Policies and Procedures Daily Practices Monitoring Resources and Supervision
Generating Hypotheses Only consider the factors involved in the inquiry phase (i. e. , relevant data) Document ideas and/or preliminary observations about why something is or is not working Write the hypothesis including the who, what, when, where and why Note: Hypothesis are tentative statements, and might be re-written several times as they are tested and retested.
Hypothesis Testing Guiding Questions • What procedures might have contributed to current performance? • Is there any information that would lead us to reject or accept each hypothesis? • Given our data picture, are there any other possible explanations we might pose? • What data if any, do we still need to collect to determine our actionable causes.
Analysis involves organizing and understanding data based on criteria you develop; it is useful when you want to find some trend or pattern. Source: Purdue Online Writing Lab
Determining the Actionable Causes: Helps resolve the issue Eliminates meaningless effort Conserves resources Identifies efficient and effective strategies Leads to Improvement
The Data Analysis Process Preparation Define the purpose and the issue Identify the people and the process Identify relevant data
The Data Analysis Process Inquiry Analyze the data Generate and Test Hypotheses Determine Actionable Cause(s)
The Data Analysis Process Action Develop and Implement Improvement Plans Evaluate Progress
“I’ll pause for a moment so you can let this information sink in. ”
Discussion Questions • What approaches or methods are you using at the state level to analyze your child and family outcome data to improve results for children and families? Can you share any lessons learned? • Are you working with local programs to assist them in using outcome data to consider how quality practices impact child and family outcome results? If so, describe the process or tools you use to help locals examine data and practices to make changes for improvement.
Discussion Questions • How might the DAC data analytic model or the Relationship of Quality Practices to Child and Family Outcome Measurement Results tool help you with these efforts? • What additional information or technical assistance would be beneficial?