D M A I C Manual 6 Sigma


 6 Sigma활동은 편차와 불량을 줄이기 위한 methodology뿐만 아니라 performance")


 Note: Ppk is based")

 Note: Ppk is based")

- Slides: 56
D M A I C Manual
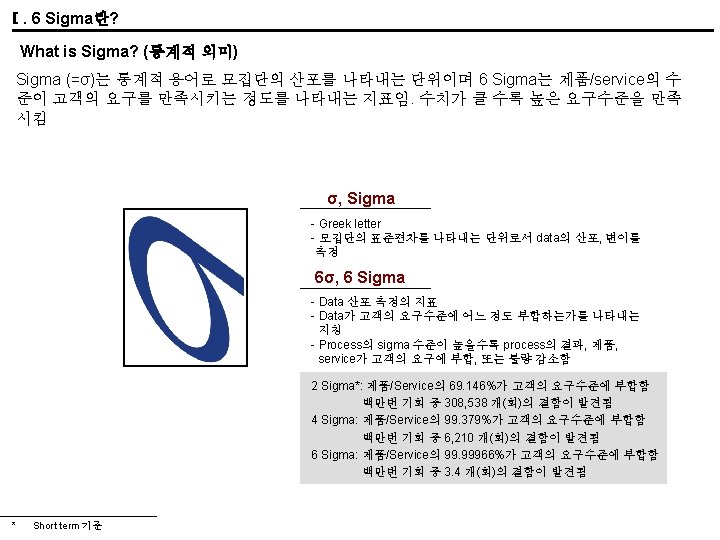
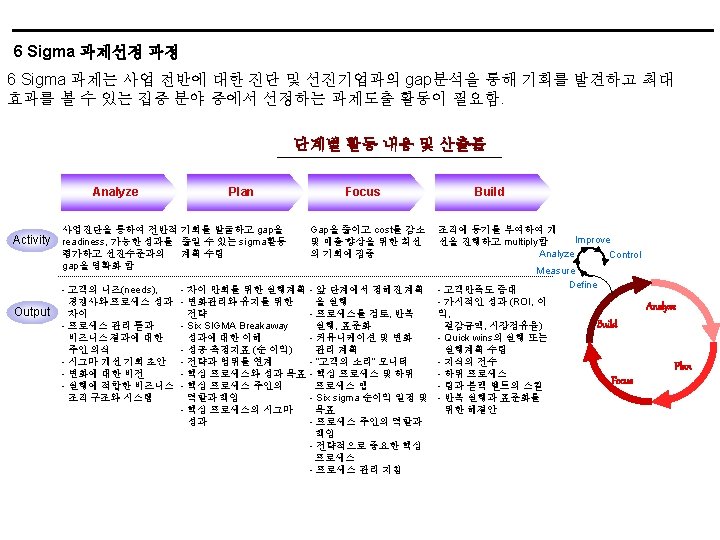
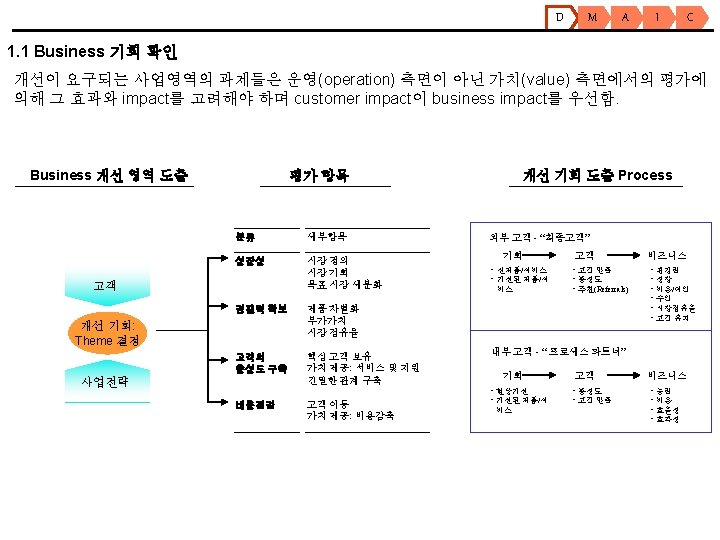
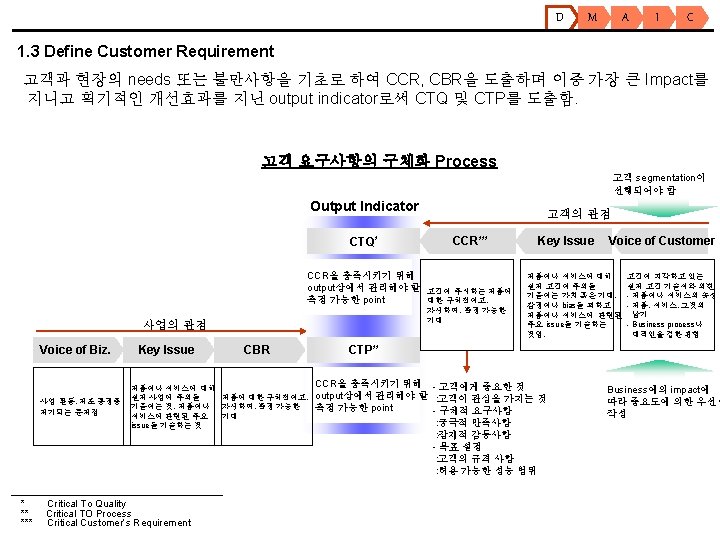
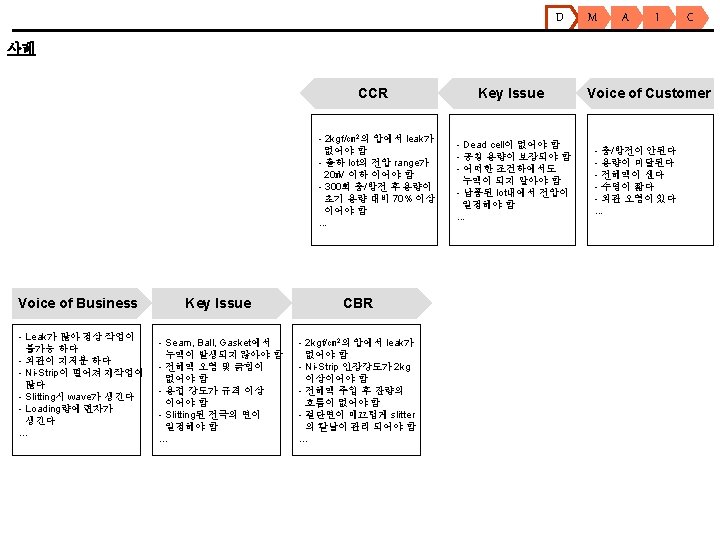
6 Sigma 활동 (전략적 의미) 6 Sigma활동은 편차와 불량을 줄이기 위한 methodology뿐만 아니라 performance excellence를 얻기 위해 업무 process, culture 등을 변환시키는 조직적 활동임 전략적 변화의 매체… Performance excellence에 이르는 조직적 활동 - Transformational Change Across-the-board: 혁신적 결과의 성취와 유지를 위해 process, culture, customer를 포함한 조직전반의 근본적인 변화활동 - Operational Change Business processes: 변이와 결함을 줄여 사업결과를 극적으로 개선하는 tool, methodology Critical Customer Requirement : CCR Defect: Service unacceptable to customer Product or Service Output
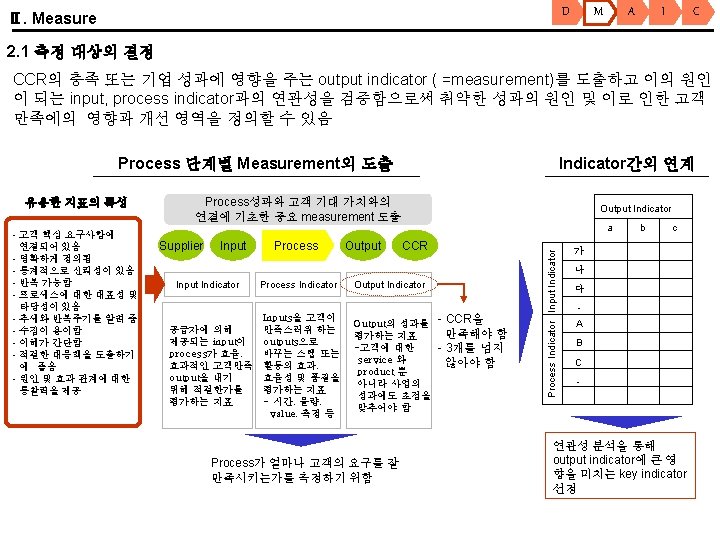
Sigma 개선활동 6 Sigma 활동은 고객의 요구수준을 기준으로 output의 불량여부를 판정하고 supplier, input, process 에 존재하는 불량의 원인을 찾아 제거함으로써 영구적인 defect 감소를 추구하는 활동임 6 Sigma 개선 영역 Market Suppliers Inputs Business Process Output Gap Defects Defect의 근본원인 (root cause)분석은 영구적인 defect의 감소로 연결됨 Process output에서의 variation은 defect를 유발함 Critical Customer Requirement
사업전략과의 연계성 6 Sigma 활동은 선정된 시장에서 기업의 사업전략에 맞추어 선택된 process의 “Key Performance Measure”를 측정하고 이를 유발시키는 요인을 process상에서 찾아 개선하는 활동을 수행함 개선 영역의 선정 Business Strategy Key Performance Measure* Business Process Output Chosen Market Leadership Processes Process Sigma Critical Customer Requirement
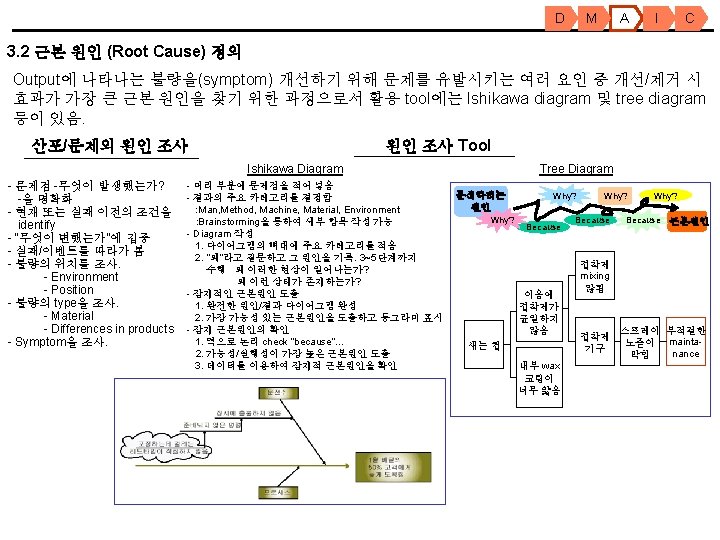
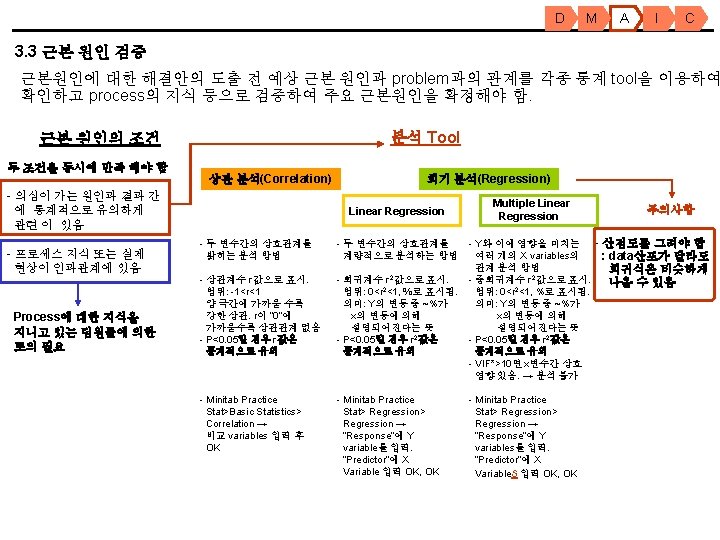
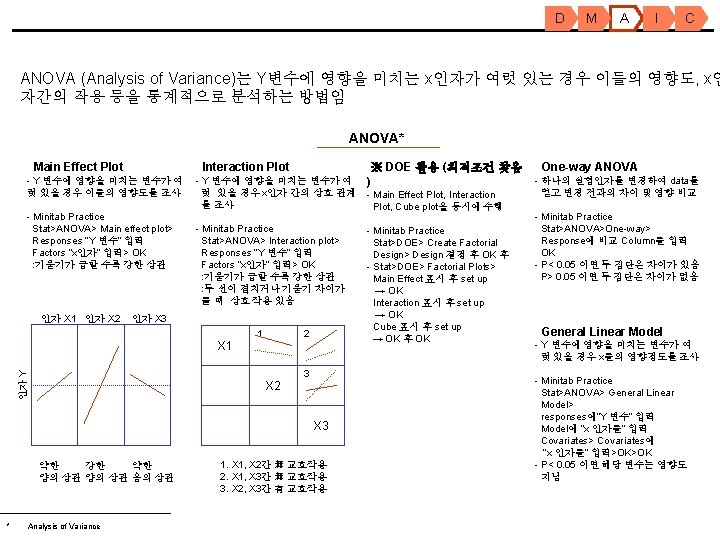
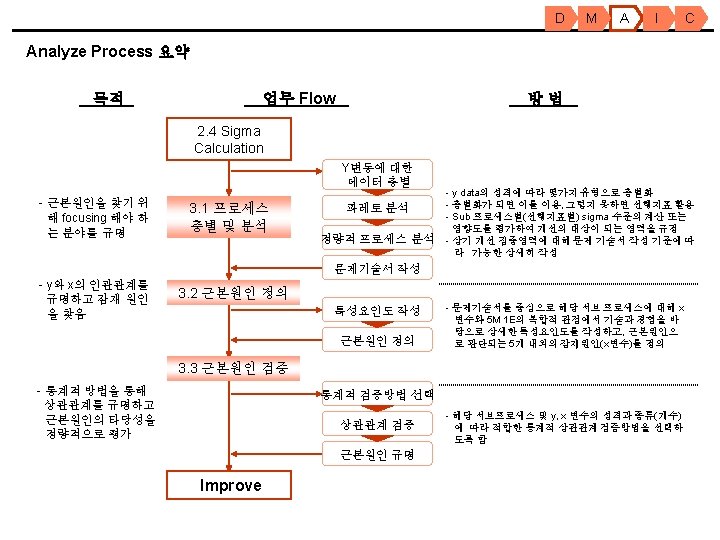
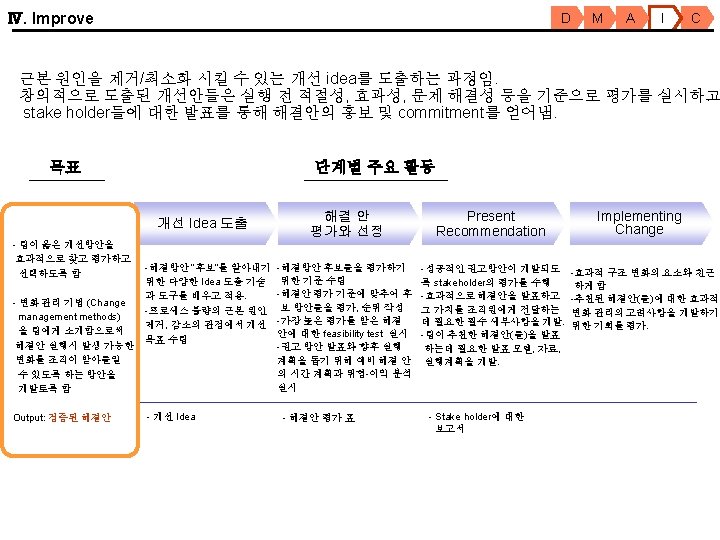
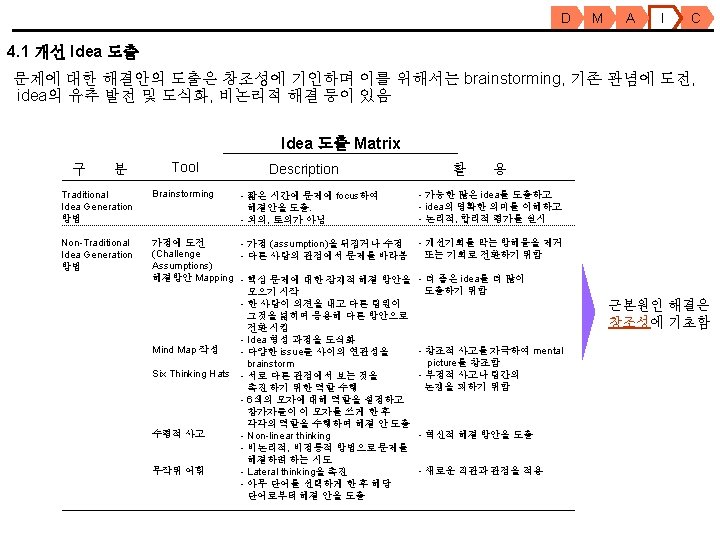
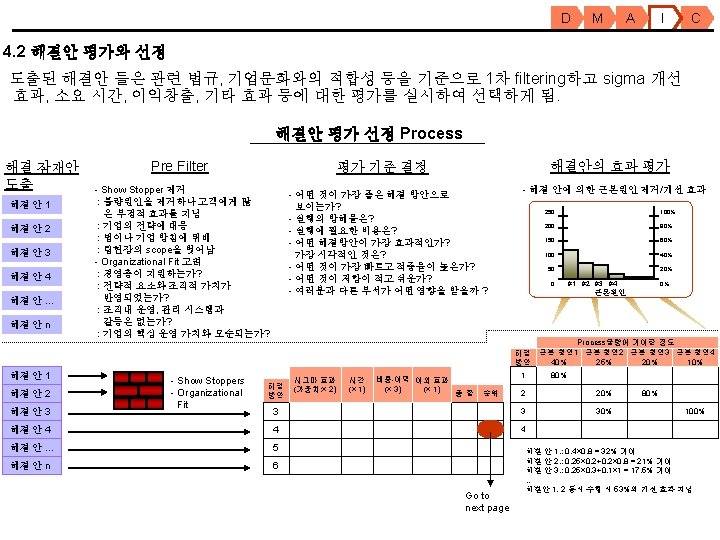
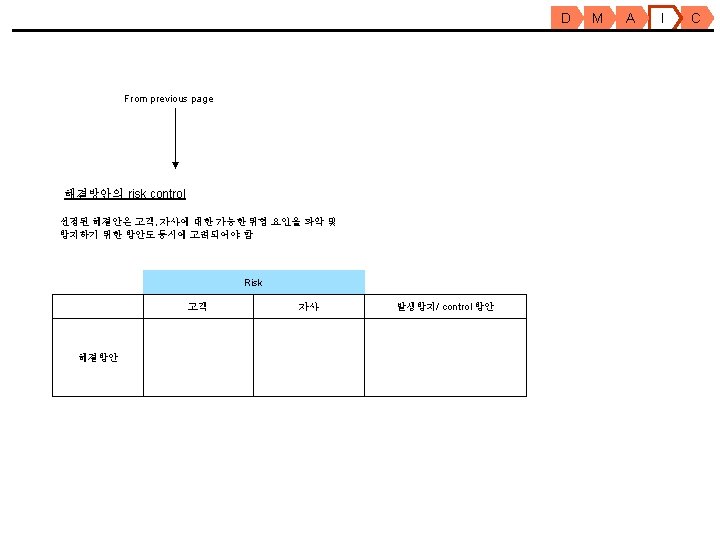
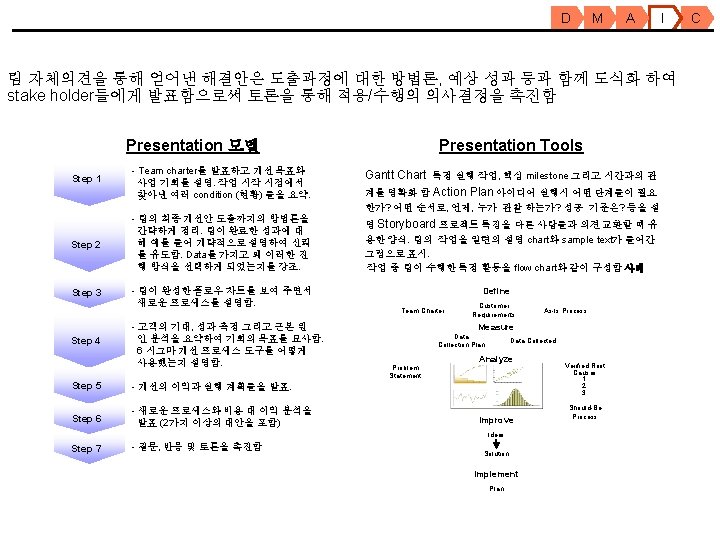
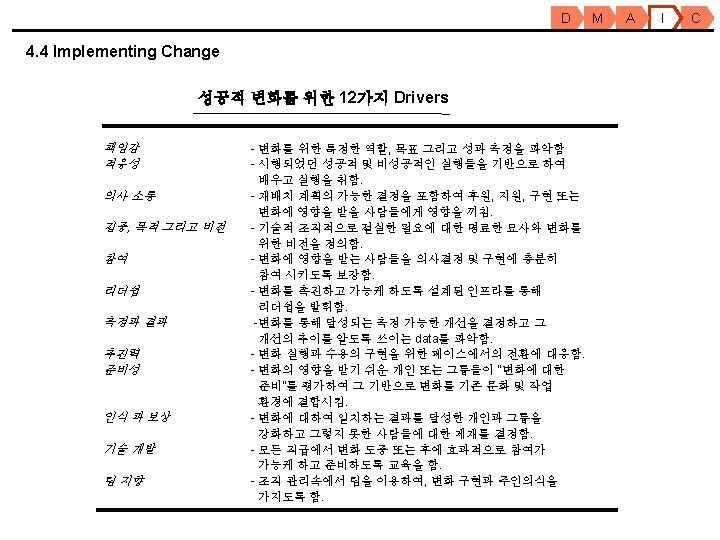
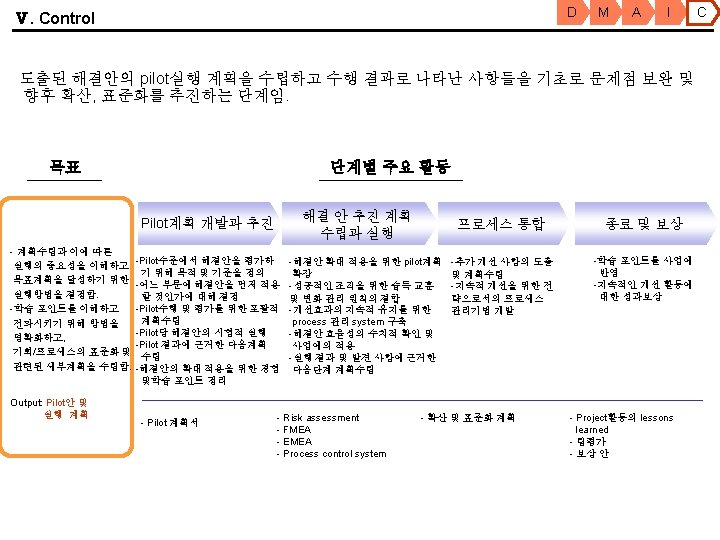
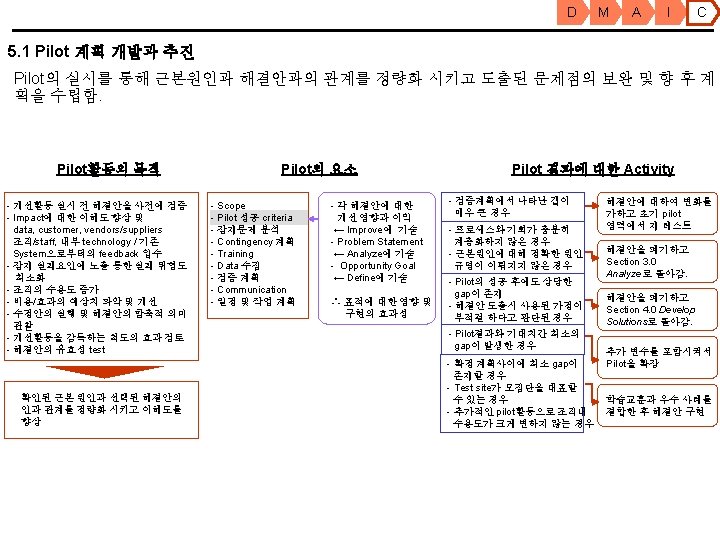
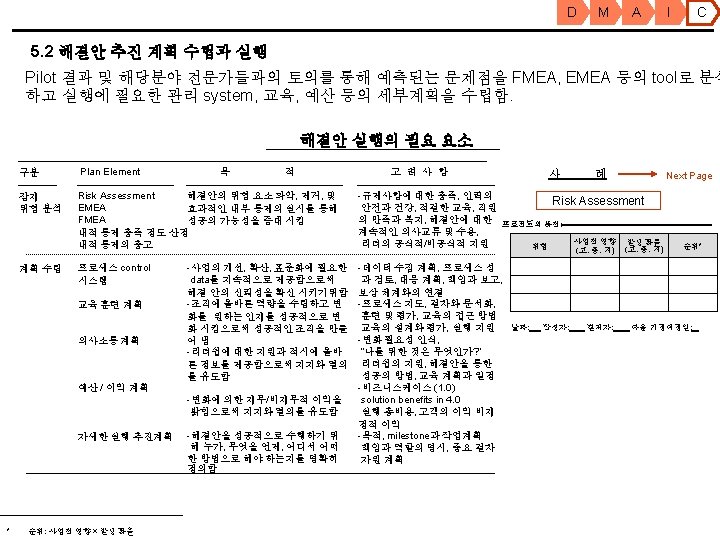
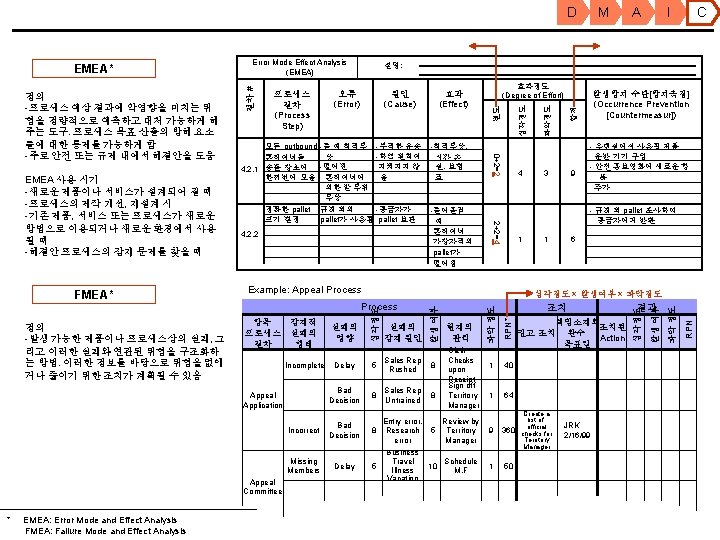
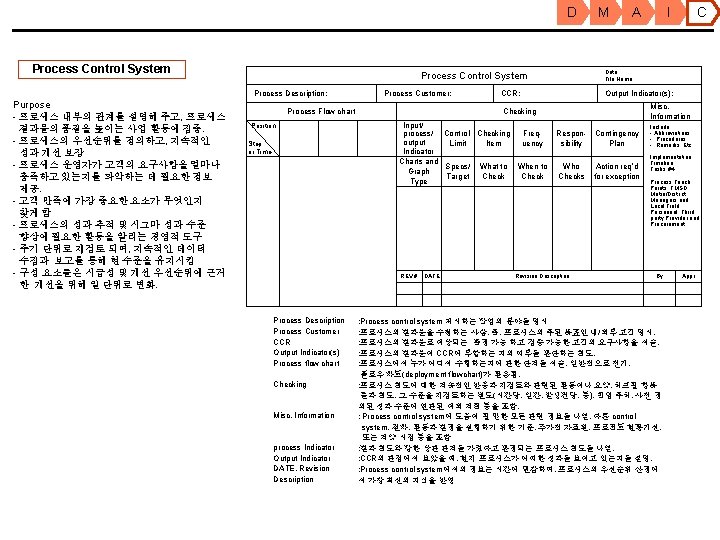
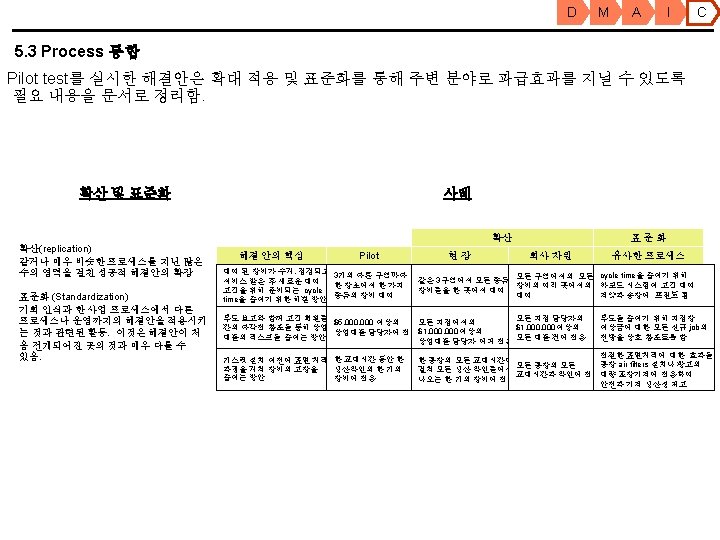
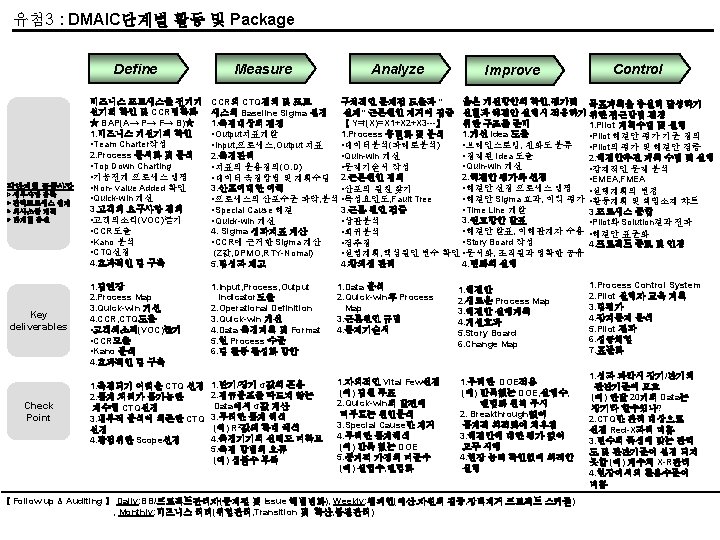
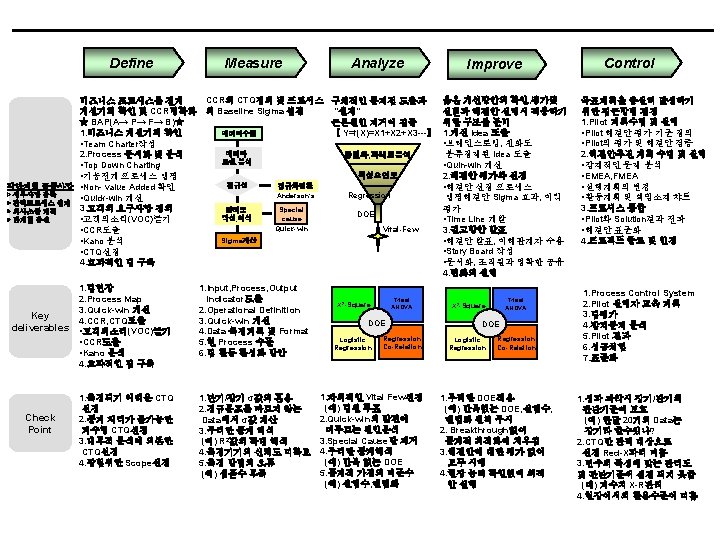
6 Sigma 활동 Process 6 Sigma 과제활동은 개선 영역의 발견, 해당분야의 data 측정 및 수집, data 분석을 통한 근본원 인 발견, 해결안의 도출 및 평가, pilot 실행 및 process 표준화의 5 단계 활동으로 이루어짐 6 Sigma 5단계 활동 내용 Define Opportunities 내용 Measure Performance Analyze Opportunities Improve (Develop Solutions) Control (Implement) 1. 1 Validate Business Opportunity 2. 1 Determine What to Measure 3. 1 Process Stratification and Analysis 4. 1 Generate Improvement Ideas 1. 2 Document and Analyze Processes 2. 2 Manage Measurement 3. 2 Determine Root Causes 4. 2 Evaluate and Select 5. 2 Plan and Solutions Implement Solution 3. 3 Validate Root Causes 4. 3 Present Recommendations 3. 4 Manage Creativity 4. 4 Implementing Change - Cause & Effect Analysis - Correlation - Design of Experiment - Fault Tree - Pareto Charts - Process Simulation - Quantitative Process Analysis - Regression - Stratification - Structure Tree - Value Analysis - Challenge Assumption - Error Mode Effect Analysis - CDAM* - Process Control System - Cost Benefit Analysis - Replication - Criteria Selection Matrix - Standardization - Force Field Analysis - Work Planning - How-By Pursuit - Lateral Thinking - Mind Mapping - Random Word - Storyboard - Solution Mapping 1. 3 Define Customer Requirements 1. 4 Build Effective Teams - Affinity Diagram - Brainstorming - Customer Research Mapping Tool & -- Deployment Gantt Chart Technique- Kano Analysis - Team Charter - Qualitative Process Analysis - Top Down Mapping - VOC Translation - Quality Function Analysis * Combine, delete, add, modify 2. 3 Understand Variation 2. 4 Determine Sigma Performance 2. 5 Excel Team Performance - Control Charts - Data Charts - Gauge R&R - Histogram - Indicators - Run Charts - Sigma Calculation - Stratification - Variation 5. 1 Develop Pilot Plan 5. 3 Process Integration 5. 4 Closure and Recognition
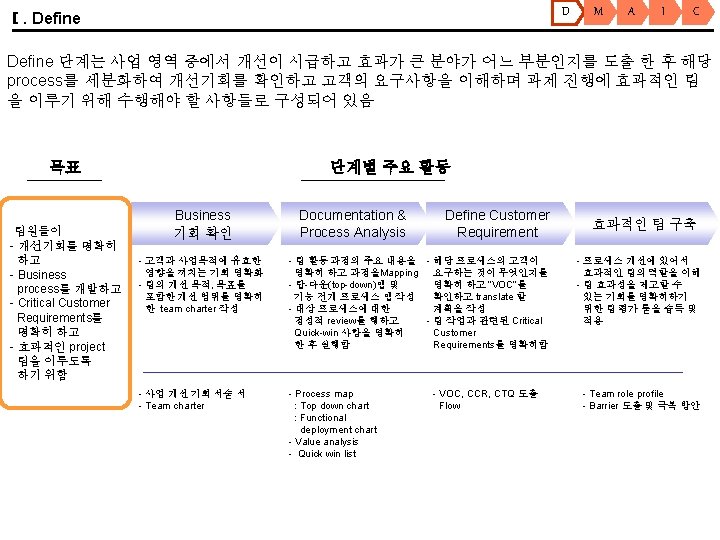
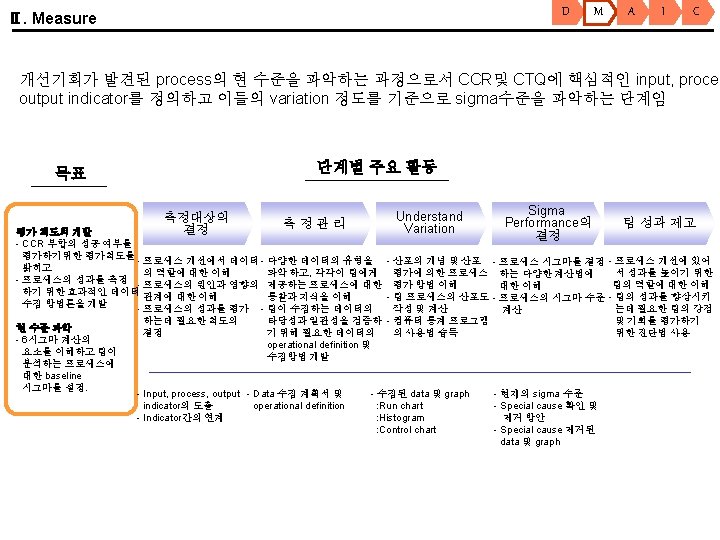
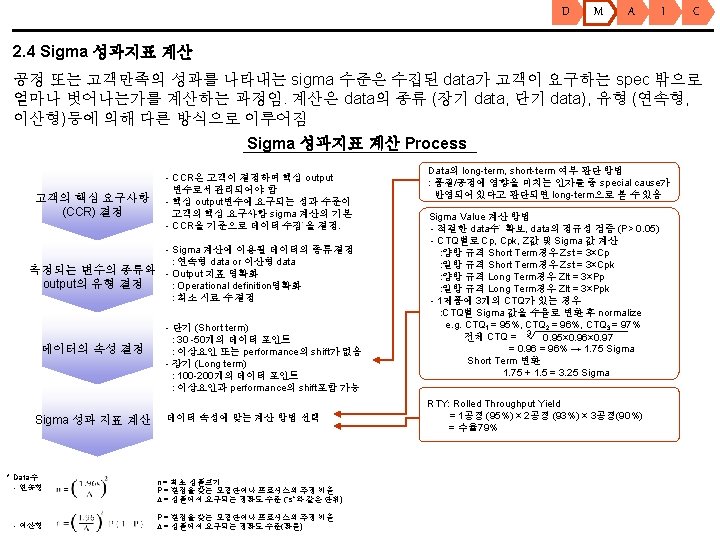
D M A Define Opportunity 요약 Define CTQ별 수준, 공정수율 등 Data 수집 (최소 숫자 확보) CCR 정의, CTQ 선정, Team Charter 단기 Data : variation만 반영 장기 Data : 평균치 변동과, variation 모두 반영 Chart화(Run, Histogram) N 정규성 검증 Sigma 수준 측정 정규화 Y 관리도 선택 및 작성 Common Cause, Special Cause 파악 제품 Sigma Special Cause 파악 및 제거 (Quick Win의 한 point) Special Cause 제거된 새로운 Data 수집 Analyze 공정 Sigma 단기 : Cp, Cpk 장기 : Pp, Ppk Measure단계 team charter의 개선 기회 재검토 통한 개선 기회 명확화 Root Cause의 발견 I C
유첨 1. Cp, Cpk, Ppk Process Capability Ratios: Cp • • The greater the design margin, the lower the Total Defects Per Unit(TDU). Design margin is measured by the Process Capability Index(Cp) Cp = (Maximum Allowable Range of Characteristic) (Normal Variation of Process -- Short Term) Note: It is often suggested that the short-term standard deviation should be corrected for certain theoretical bias(which may be present) prior to calculation of Cp, Cpk, Pp, or Ppk. Such an adjustment is made by dividing the short-term standard deviation by C 4, a constant used in conjunction with control charts. The theoretical merits of such a corrective device can be mathematically argued; however, the practical implications of such argument is highly unwarranted when given a sufficient sample. -3 sst m 0 +3 sst Cp = │USL-LSL│ ± 3 s st Process Width ZST = 3 Cp Design Width LSL T USL Note: Pp is based on the same equation as Cp with one exception: namely, Pp employs the long-term standard deviation(whereas Cp employthe shortterm standard deviation. )
Cpk Process Capability Ratios: Cpk = Cp (1 - k) Note: Ppk is based on the same equation as Cpk with one exception: namely, Pp employs the long-term standard deviation(whereas Cp employs the short-term standard deviation. ) Where k is the proportion of the tolerance zone consumed by the static mean shift k = │T - m│ (USL-LSL)/2 Example: Cp = 2, k =. 25 Cpk = 2( 1 -. 25 ) = 1. 5 m 0 m 1 6 s st 4. 5 s st 0 ppm 3. 4 ppm LSL T USL
Pp Process Capability Ratios: Pp Note: Pp is based on the same equation as Cp with one exception: namely, Pp employs the long-term standard deviation(whereas Cp employs the short-term standard deviation. ) Pp = │USL-LSL│ ± 3 s lt ZLT = 3 Pp (Maximum Allowable Range of Characteristic) (Normal Variation of Process -- Long Term) Short-term distribution displays only pure error, I. e. , white noise only. Mean is artifically centered on the target value(by virtue of the equation). -3 slt Long-term distribution displays white and black noise. In this instance, black noise are the nonrandom variations in the process mean which tends to expand the standard deviation. In the instance of Pp, the mean is artifically centered on the target value(by virtue of the equation). m 0 +3 slt Process Width Design Width T LSL USL
Ppk Process Capability Ratios: Ppk = Pp (1 - k) Note: Ppk is based on the same equation as Cpk with one exception: namely, Pp employs the long-term standard deviation(whereas Cp employs the short-term standard deviation. ) Where k is the proportion of the tolerance zone consumed by the static mean shift Note: The k value is computed the same way as in the Cpk metric. Again, the only difference is that Cpk utilizes the short-term standard deviation whereas Ppk employs the long-term standard deviation. k = Long Term │T - m│ (USL-LSL)/2 m 0 m 1 Long Term with Static Offset Short Term LSL T USL
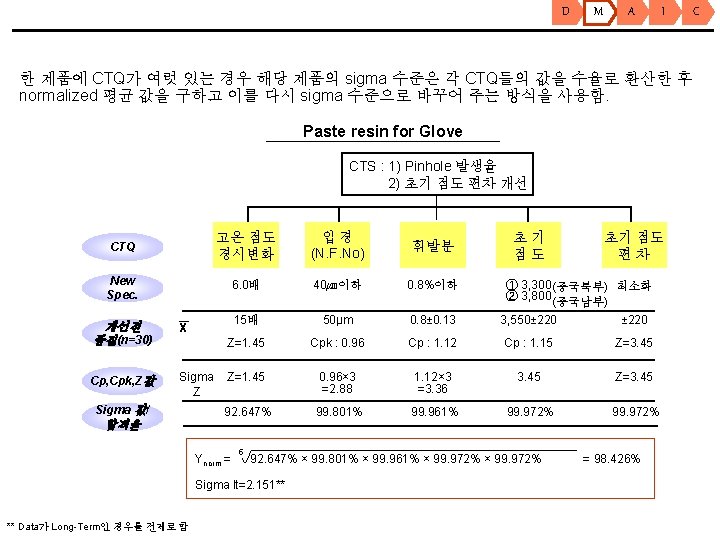
유첨 2. Sigma계산법 양방 규격일 때의 Zlt 을 산출하는 방법 비교 1. Pp값에 의한 Z값 계산 LSL T=1. 95 USL Z Pp = Example : LDPE의 LB 7500 MT에 대한 Long Term Data LSL T=1. 95 USL - LSL 6* slt = 0. 74 Zlt = 3*Pp = 2. 22 1. 7 2. 2 2. Ppk값에 의한 Z값 계산 T=1. 95 LSL Z 0. 72% 2. 32% USL Ppk = Min ( USL - X bar 3 * slt , X bar-LSL 3 * slt = 0. 66 Zlt = 3*Ppk = 1. 98 1. 7 X bar =1. 92 slt = 0. 11263 2. 2 1. 7 2. 2 X bar =1. 92 1. Z값의 직접 계산 P(X<LSL) + P(X>USL) = 0. 0304 표준정규분포표에서 0. 0304에 3. 04% 해당하는 Z 값을 찾는다. 0 1. 875 Z Zlt = 1. 875 )