Curvilinear Regression Monotonic but NonLinear The relationship between

Curvilinear Regression

Monotonic but Non-Linear • The relationship between X and Y may be monotonic but not linear. • The linear model can be tweaked to take this into account by applying a monotonic transformation to Y, X, or both X and Y. • Predicting calories consumed from number of persons present at the meal.

R 2 =. 584

R 2 =. 814

Calories Log Model Persons

Polynomial Regression

Aggregation of Ladybugs • A monotonic transformation will not help here. • A polynomial regression will. • Copp, N. H. Animal Behavior, 31, 424 -430 • Subjects = containers, each with 100 ladybugs • Y = number of ladybugs free (not aggregated) • X = temperature

Polynomial Models • Quadratic: • Cubic: • For each additional power of X added to the model, the regression line will have one more bend.

Using Copp’s Data • Compute Temp 2, Temp 3 and Temp 4. • Conduct a sequential multiple regression analysis, entering Temp first, then Temp 2, then Temp 3, and then Temp 4. • When deciding which model to adopt, consider whether making the model more complex is justified by the resulting increase in R 2.

SAS • Curvi -- Polynomial Regression, Ladybugs. • Download and run the program. • Refer to it and the output as Professor Karl goes over the code and the output.

Linear Model, R 2 =. 615

Quadratic Model, R 2=. 838

Cubic Model, R 2=. 861

Which Model to Adopt? • Adding Temp 2 significantly increased R 2, by. 838 -. 615 =. 223, keep Temp 2. • Adding Temp 3 significantly increased R 2, by. 861 -. 838 =. 023 – does this justify keeping Temp 3 ? • Adding Temp 4 did not significantly increase R 2. • Somewhat reluctantly, I went cubic.

SHIFT • Shift to the OUTPUT PDF at this point, come back to the slideshow later.

Phototaxis • Subjects = containers, each with 100 ladybugs • Containers lighted on one side, dark on the other • Y = number on the lighted side • X = temperature

R 2 Linear =. 137 Quadratic =. 601

The Quadratic Model • The quadratic model clearly fits the data better than does the linear model. • Phototaxis is positive as temps rise to about 18 and negative thereafter.

A Cubic Model • R 2 has increased significantly, from. 601 to. 753, p <. 001 • Does an increase of 15. 2% of the variance justify making the model more complex? • I think so.
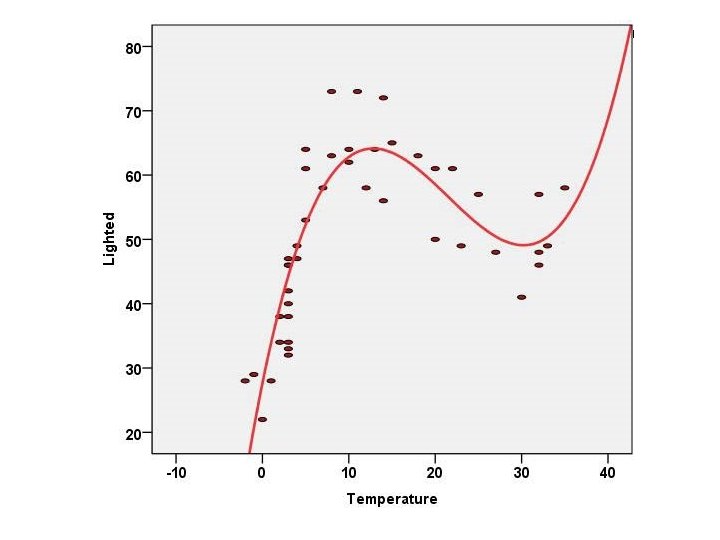

Interpretation • Ladybugs buried in leaf mold in Winter head up, towards light, as temperatures warm. • With warming beyond 12 (54 F), head for some shade – the aphids are in the shade under Karl’s tomato plant leaves. • With warming beyond 32 (90 F), this place is too hot, lets get out of here.

A Quartic Model • R 2 =. 029, p =. 030 • Does this small increase in R 2 justify making the model more complex? • Can you make sense of a third bend in the curve.

The quartic plot does not look much different than the cubic.

Multicollinearity • May be a problem whenever you have products or powers of predictors in the model. • Center the predictor variables, • Or simply standardize all variables to mean 0, standard deviation 1.

I am so Cute

SPSS • See the document for an example of polynomial regression using SPSS.
- Slides: 26