Current World Population http www worldometers infopopulation 072511


- Slides: 45
Current World Population http: //www. worldometers. info/population/ 07/25/11 at 02: 16 is 311, 838, 466 World: 6, 979, 491, 043 One birth every. . . 7 seconds One death every. . . 13 seconds (we added a whole second since last year)! One international migrant (net) every. . . 45 seconds (It was 29 last year) Net gain of one person every. . . 12 seconds
History of Human Population Growth Years Elapsed Year Human Population 3, 000 10, 000 B. C. (Agricultural Revolution) 5 -10 Million 10, 000 1 A. D. 170 Million 1, 800 1800 (Industrial Revolution) 1 Billion 130 1930 2 Billion 30 1960 3 Billion 15 1975 4 Billion 12 1987 5 Billion 12 1999 1310 2009 6 Billion 6. 8 Billion
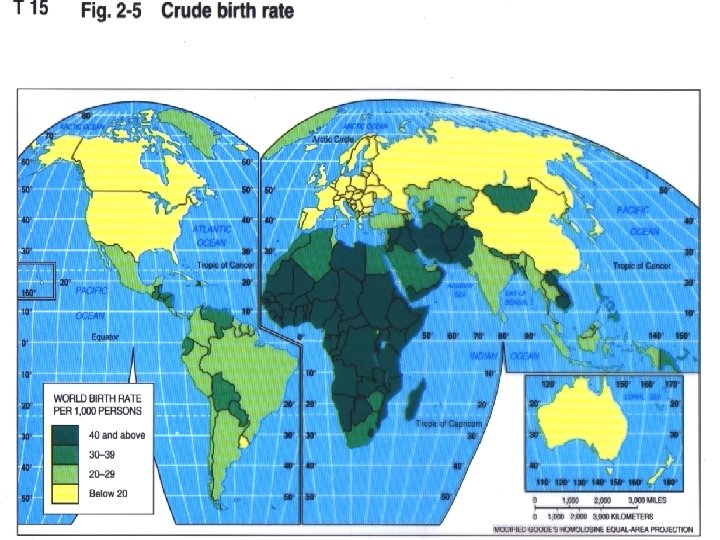
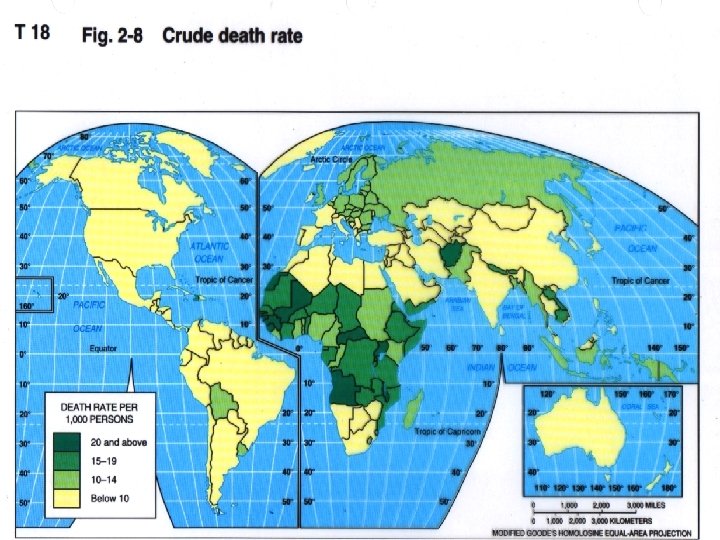
Terms to Know: • Death rate: number of deaths per year per every 1000 people • Birthrate: # of births per year for every 1000 people • Natural increase = birthrate – death rate • Zero population: birthrate and death rate are = • Doubling time: number of years it takes to double in size • Negative Growth Rate: death rate exceed birthrates
Rates of Natural Increase
The world’s population is growing because: • Better medical care / medicine • Improved sanitation • Lower infant mortality • Longer life expectancy • Birth rates not declining as fast as death rates. • More abundant food. • Better living conditions Birth rates have not increased. Around the world women are actually having less children than in the past.
Challenges to Rapid Growth • Difficulty producing enough food • Use resources too quickly • Too many children – not contributing to farming or paying taxes.
What problems can be caused by population increase? • We will need more of everyday things: Food, land to grow food, clean water, shelter, schools, hospitals, roads, energy • Poor will probably not be able to change circumstances because more people will be sharing the same amount of resources • Governments will have difficulty keeping up with demands of the people.
Negative Population Growth • Must import workers from other countries. • Immigrant populations don’t always get along with native population.
Growth in More Developed and Less Developed Countries More Developed Countries Billions
Present Rate of Growth 80 Million a Year World Adds as many people as: • 1 New York City every month • 1 Germany every year • 1 Europe every decade
Population J-Curve Estimated Population: 9 billion by 2025 12 Billion by 2050
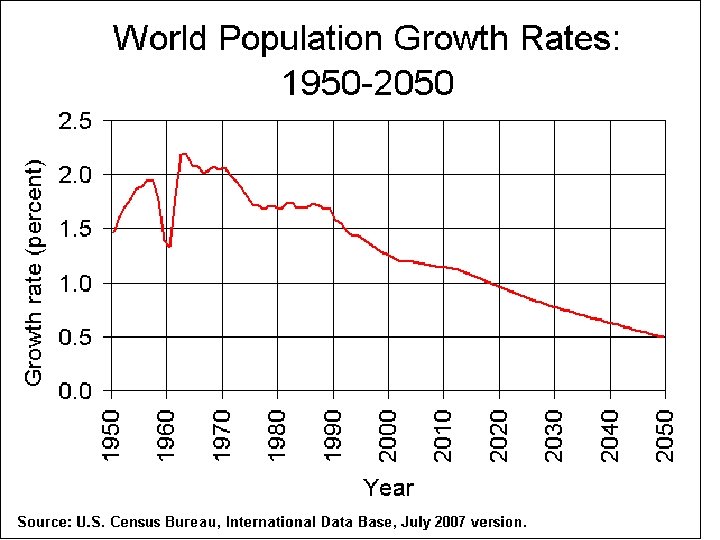
Annual World Population Growth Rate 1. 4% At current growth rate by 2050 world population will be: 12 Billion
World’s most populated countries Know top 5
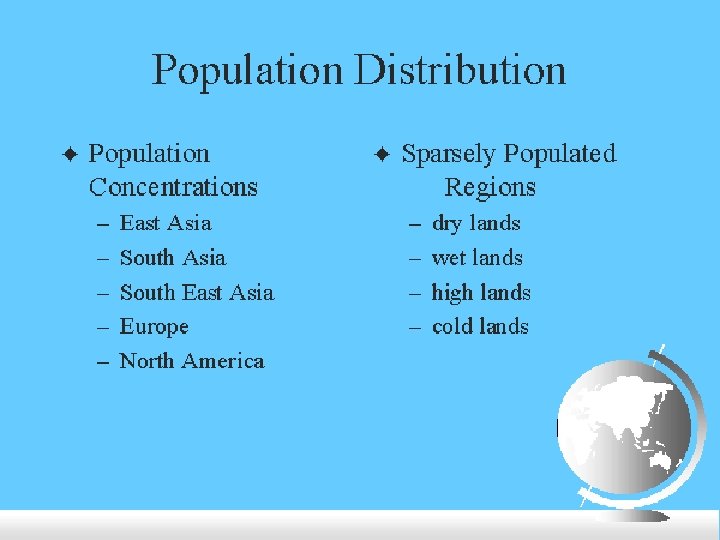
Where do people live? • 61% live in Asia. • Most people want to live on – Fertile soil – Near available water – In a mild climate
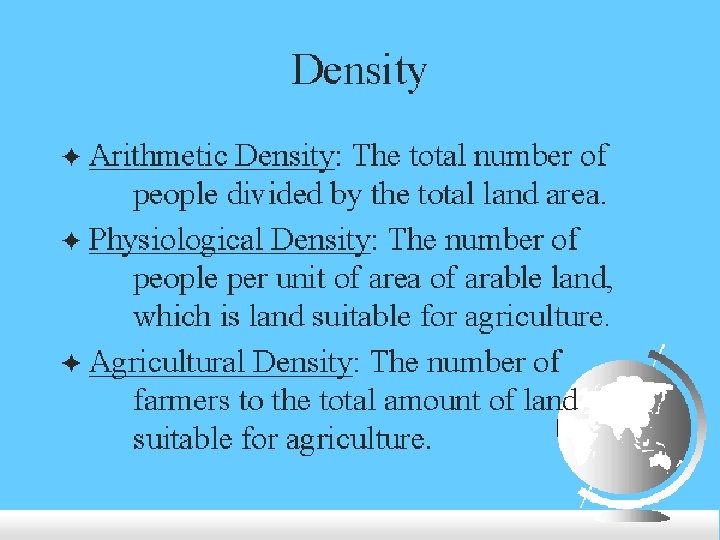
World Population Density Map Population density is people per square mile / kilometer – total population divided by total land area.
What is the most important factor influencing population distribution? Geography! There are some areas that are not suitable or comfortable to live – too hot, too cold, too high, swampy, dry, rocky, etc. Population distribution is where people actually live. All the world’s people live on about 1/3 of the world’s land Think about it – very few people live in Alaska
Egypt as a Case Study • Arithmetic = 181 per sq. mile • Physiological = 5, 807 per sq mile • Why the disparity?
Migration? • Natural increase does not account for migration – movement of people from place to place • Common migrations: – – Rural to urban Why do you think this occurs Country to country Emigrants in their homelands; immigrants to new county – Why do you think this occurs?
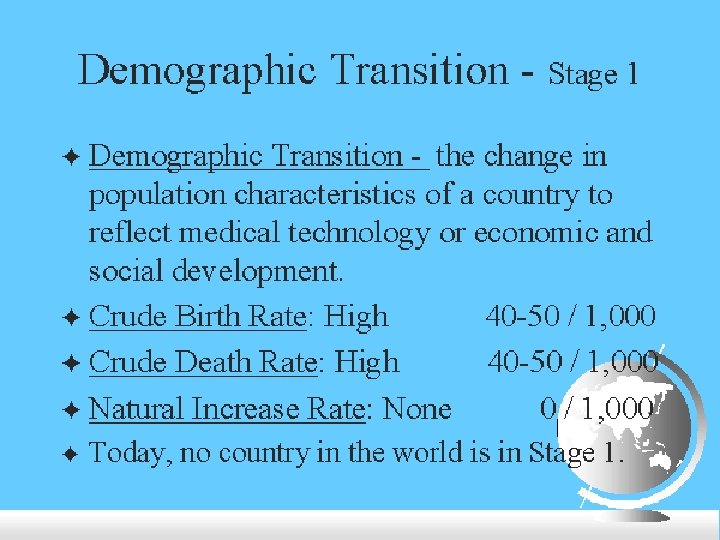
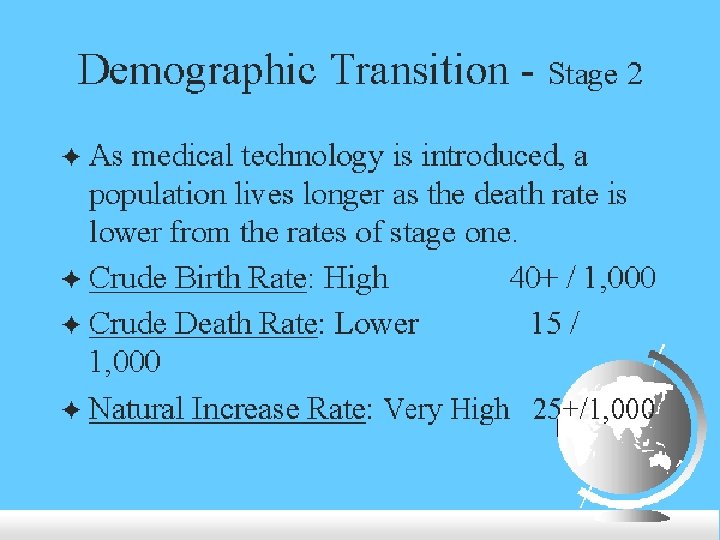
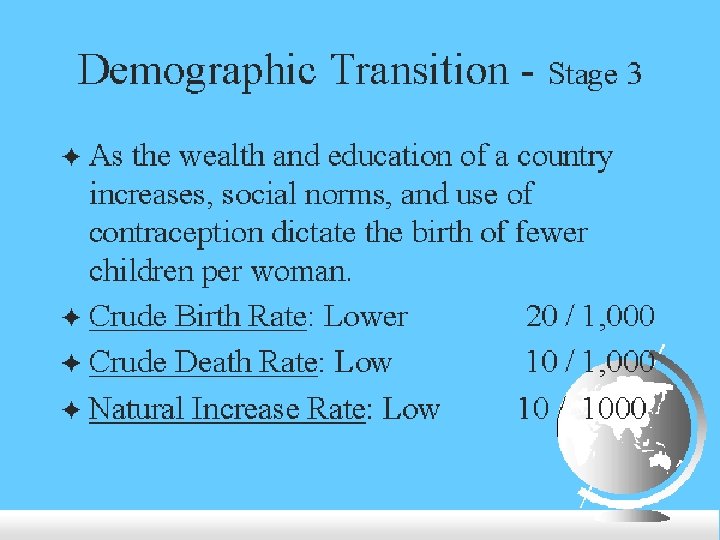
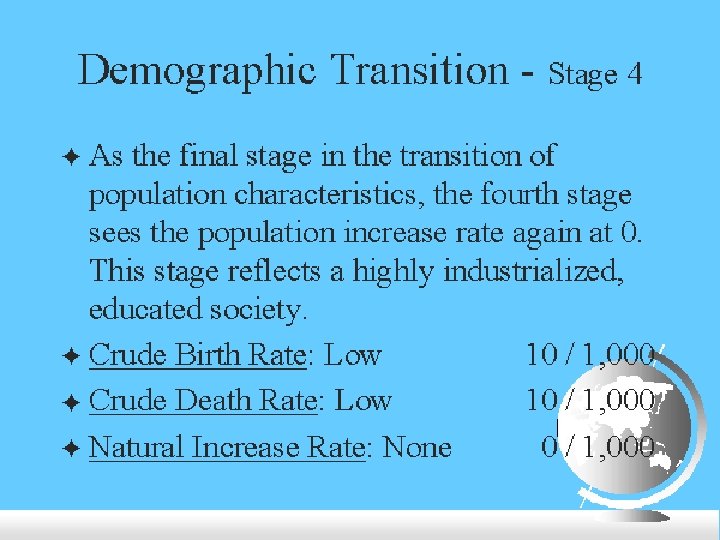
Demographic Transition Model
Problems with the Demographic Transition Model • based on European experience, assumes all countries will progress to complete industrialization • many countries “stuck” in stage 2 or stage 3 • reflects logic of continuous growth, an impossibility
When geographers want to examine the structure of a population and the potential for growth in that population, they turn to a basic tool in demography: the population pyramid. Just as a builder uses a blueprint for depicting the structure of a house, a geographer uses a population pyramid as a blueprint for interpreting the dynamics of a population
Population Pyramids: · graphically display a population's age and gender · are bar graphs; · show numbers or proportions of males and females in each age group · show gains of cohort members due to immigration and birth, · show loss of cohort members due to emigration and death; · reflect population growth or decline
Rapidly Growing Population – usually developing & poor
Slow Population Growth – usually developed - stable
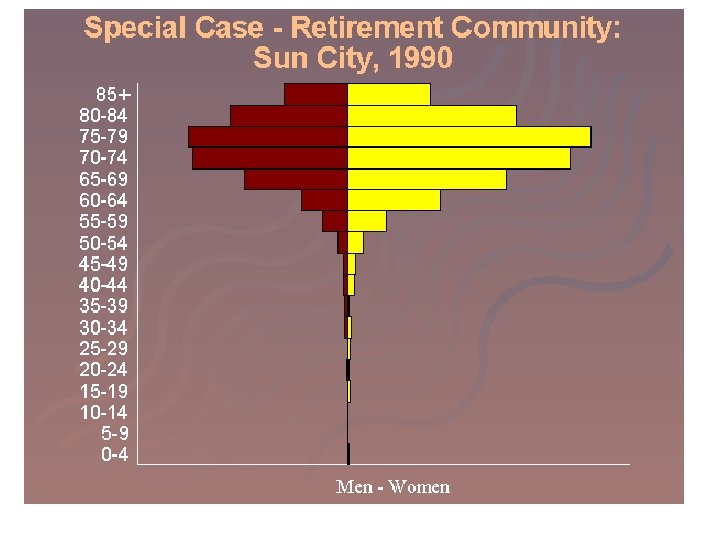
Negative Population Growth – will need to import workers. Notice the big change between 25 -29 and 20 -25 and also 20 -25 and 15 -19
Population Structures by Age and Sex, 2005 Millions Less Developed Regions More Developed Regions Age Male Female 80+ 75 -79 70 -74 65 -69 60 -64 55 -59 50 -54 45 -49 40 -44 35 -39 30 -34 25 -29 20 -24 17 -19 10 -16 59 0 -4 Male Female
That long arm of post-adolescent males should be a dead giveaway for a military town, in this case Onslow County, NC, home of Marine Corps Base Camp Lejuene.
The tourist town has little opportunity for young adults and they clear out as shown here in Narrangasett, RI.
Seniors rule in Sarasota, Fl, but not the ones in high school. The high concentration of senior citizens puts Sarasota County Transit at among the highest demand response trips per fixed route trip in Florida.
The overwhelming number of co-eds should instantly reveal the college town, this one the home of the Gators, Gainesville, FL.
Computer engineers – small families – working women and men.
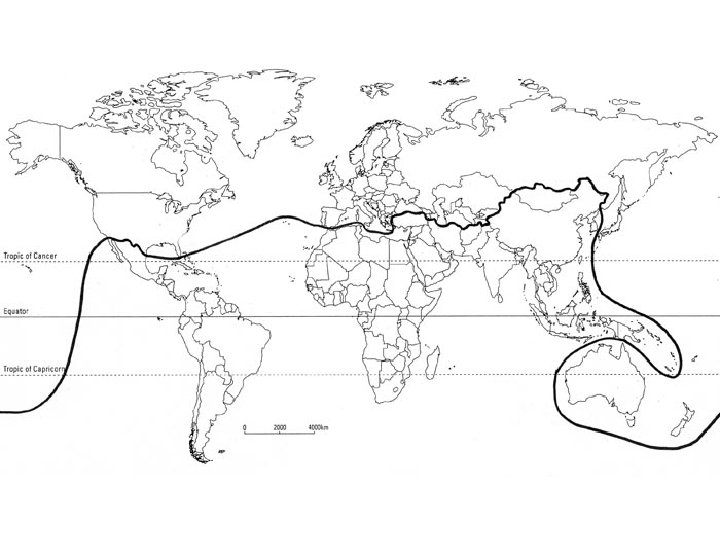
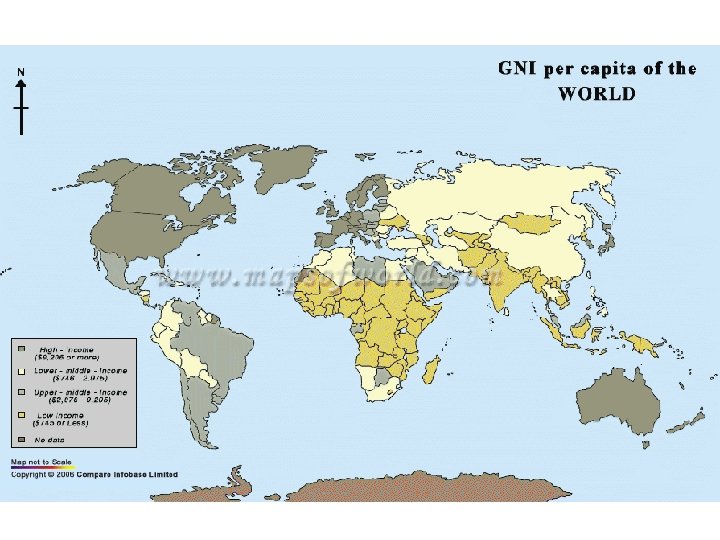
Brandt Line – haves and have nots.