
Current Physics Results Gordon Thomson Rutgers University Outline
- Slides: 35
Current Physics Results Gordon Thomson Rutgers University
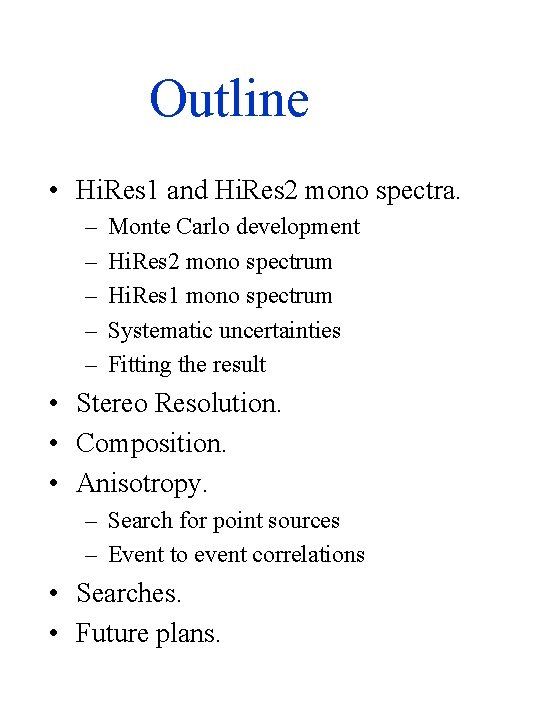
Outline • Hi. Res 1 and Hi. Res 2 mono spectra. – – – Monte Carlo development Hi. Res 2 mono spectrum Hi. Res 1 mono spectrum Systematic uncertainties Fitting the result • Stereo Resolution. • Composition. • Anisotropy. – Search for point sources – Event to event correlations • Searches. • Future plans.
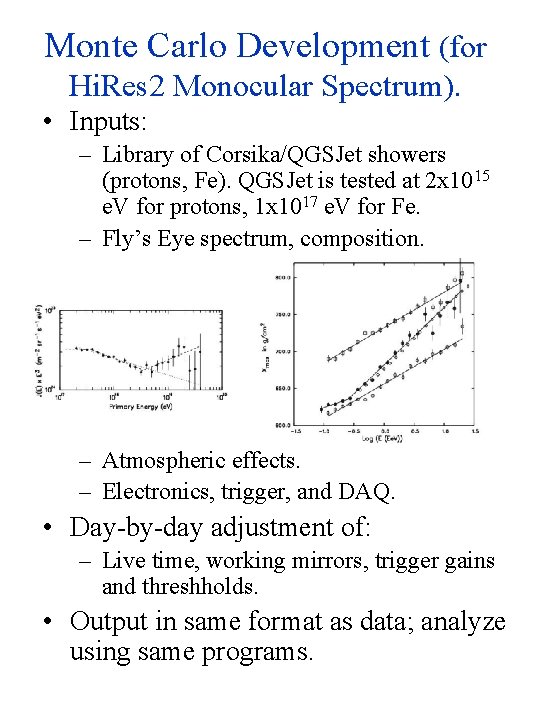
Monte Carlo Development (for Hi. Res 2 Monocular Spectrum). • Inputs: – Library of Corsika/QGSJet showers (protons, Fe). QGSJet is tested at 2 x 10¹⁵ e. V for protons, 1 x 10¹⁷ e. V for Fe. – Fly’s Eye spectrum, composition. – Atmospheric effects. – Electronics, trigger, and DAQ. • Day-by-day adjustment of: – Live time, working mirrors, trigger gains and threshholds. • Output in same format as data; analyze using same programs.
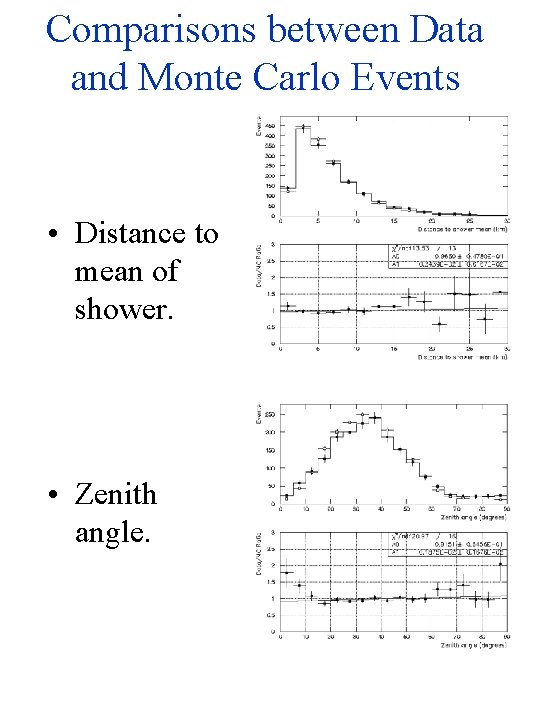
Comparisons between Data and Monte Carlo Events • Distance to mean of shower. • Zenith angle.
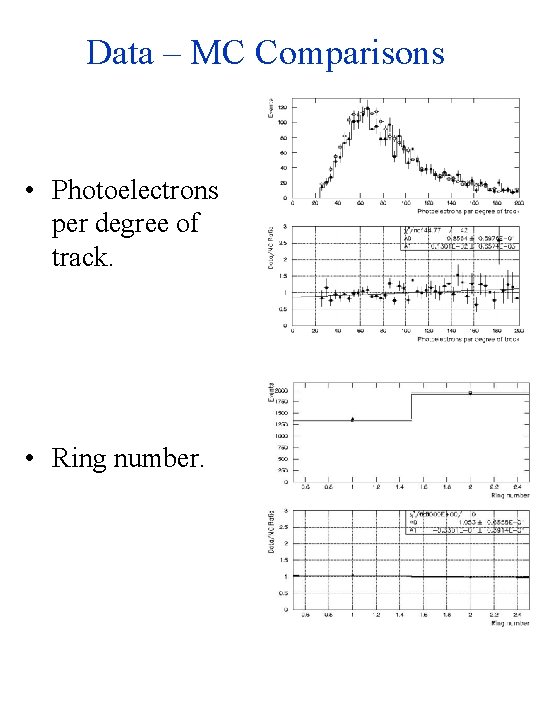
Data – MC Comparisons • Photoelectrons per degree of track. • Ring number.
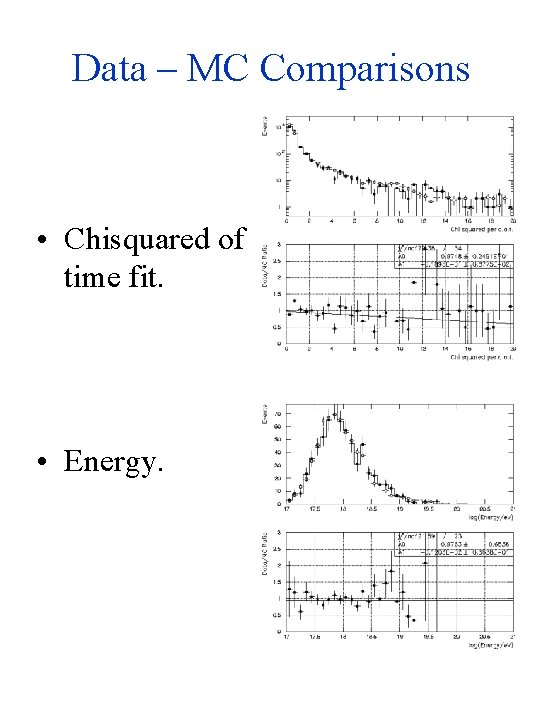
Data – MC Comparisons • Chisquared of time fit. • Energy.
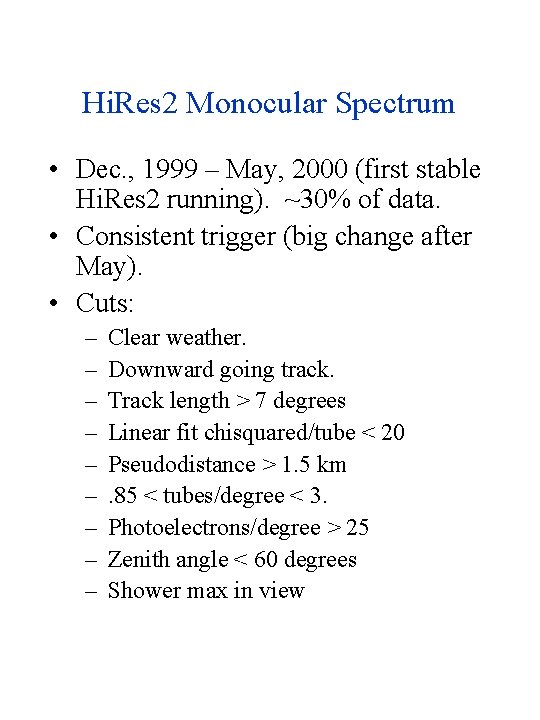
Hi. Res 2 Monocular Spectrum • Dec. , 1999 – May, 2000 (first stable Hi. Res 2 running). ~30% of data. • Consistent trigger (big change after May). • Cuts: – – – – – Clear weather. Downward going track. Track length > 7 degrees Linear fit chisquared/tube < 20 Pseudodistance > 1. 5 km. 85 < tubes/degree < 3. Photoelectrons/degree > 25 Zenith angle < 60 degrees Shower max in view
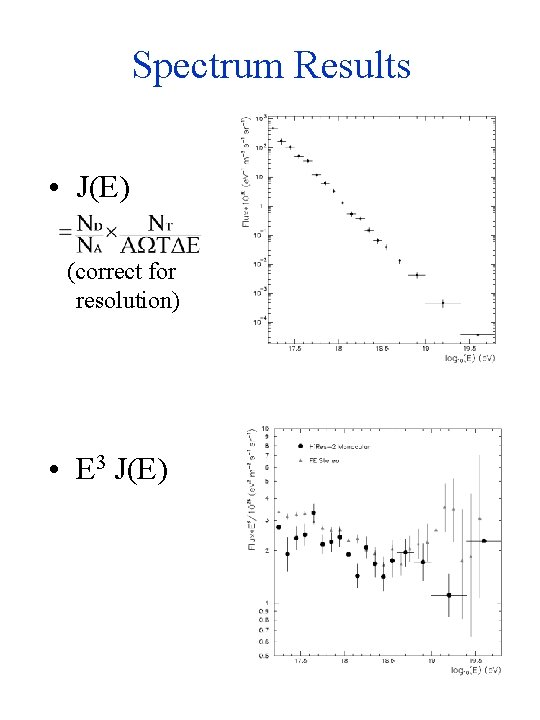
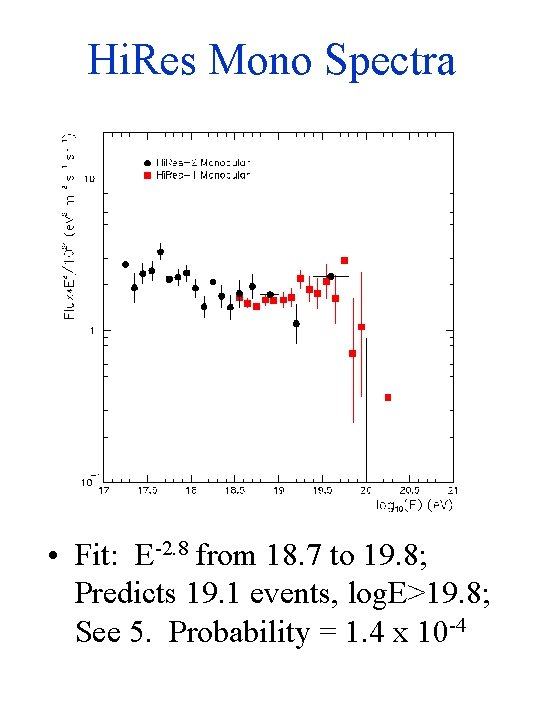
Spectrum Results • J(E) (correct for resolution) • E 3 J(E)
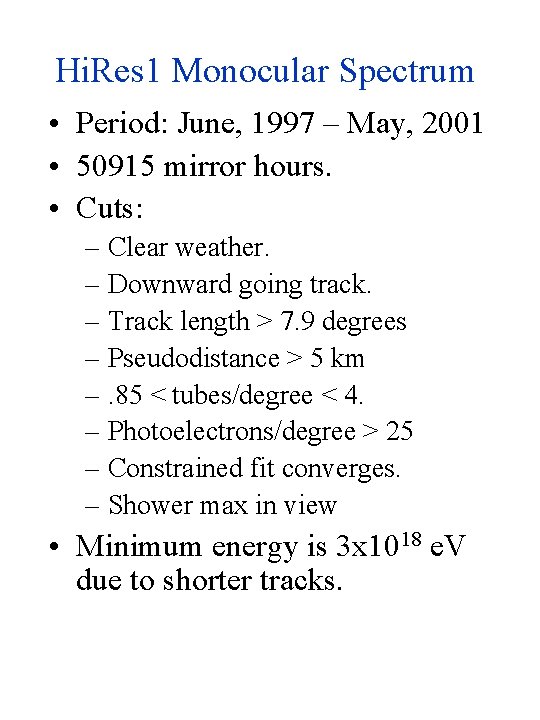
Hi. Res 1 Monocular Spectrum • Period: June, 1997 – May, 2001 • 50915 mirror hours. • Cuts: – Clear weather. – Downward going track. – Track length > 7. 9 degrees – Pseudodistance > 5 km –. 85 < tubes/degree < 4. – Photoelectrons/degree > 25 – Constrained fit converges. – Shower max in view • Minimum energy is 3 x 10¹⁸ e. V due to shorter tracks.
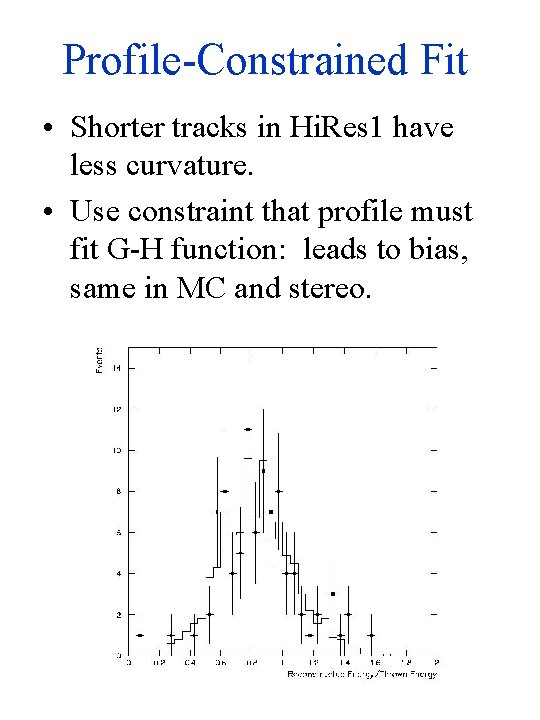
Profile-Constrained Fit • Shorter tracks in Hi. Res 1 have less curvature. • Use constraint that profile must fit G-H function: leads to bias, same in MC and stereo.
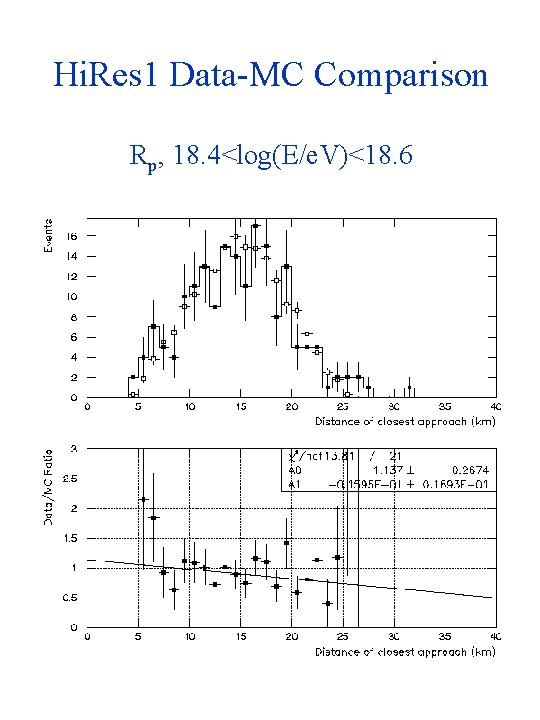
Hi. Res 1 Data-MC Comparison Rp, 18. 4<log(E/e. V)<18. 6
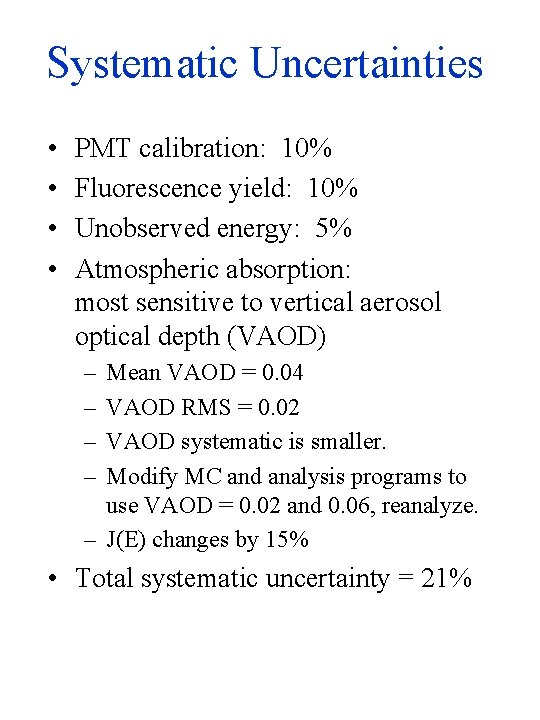
Systematic Uncertainties • • PMT calibration: 10% Fluorescence yield: 10% Unobserved energy: 5% Atmospheric absorption: most sensitive to vertical aerosol optical depth (VAOD) – – Mean VAOD = 0. 04 VAOD RMS = 0. 02 VAOD systematic is smaller. Modify MC and analysis programs to use VAOD = 0. 02 and 0. 06, reanalyze. – J(E) changes by 15% • Total systematic uncertainty = 21%
Hi. Res Mono Spectra • Fit: E-2. 8 from 18. 7 to 19. 8; Predicts 19. 1 events, log. E>19. 8; See 5. Probability = 1. 4 x 10 -4
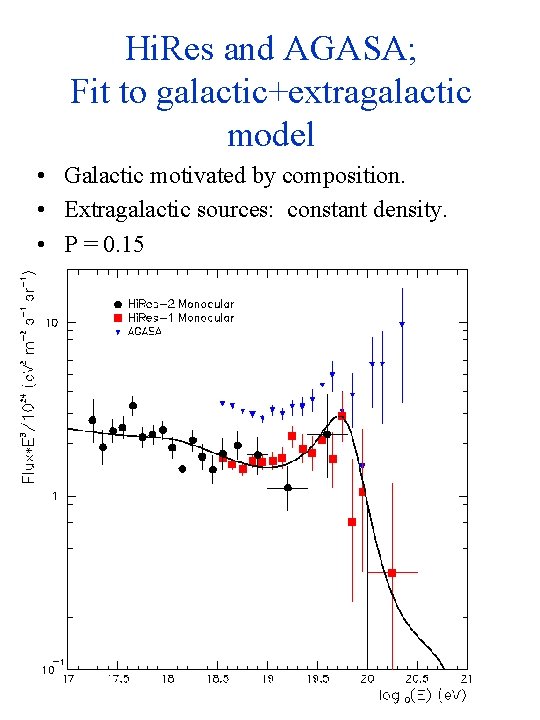
Hi. Res and AGASA; Fit to galactic+extragalactic model • Galactic motivated by composition. • Extragalactic sources: constant density. • P = 0. 15
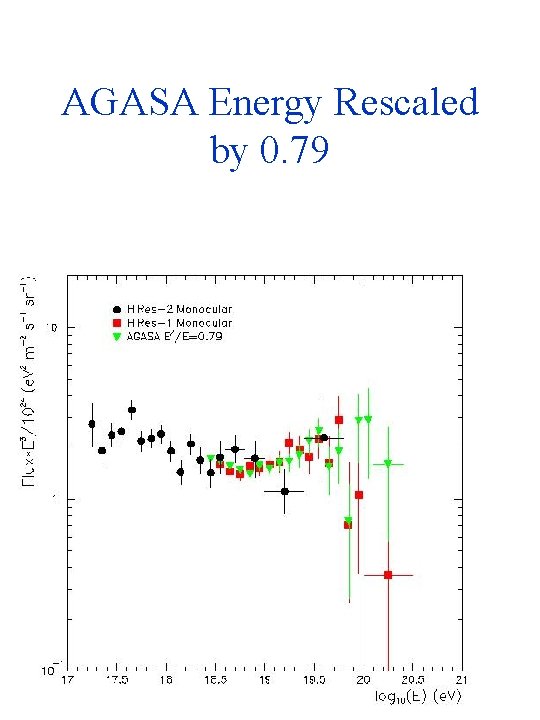
AGASA Energy Rescaled by 0. 79
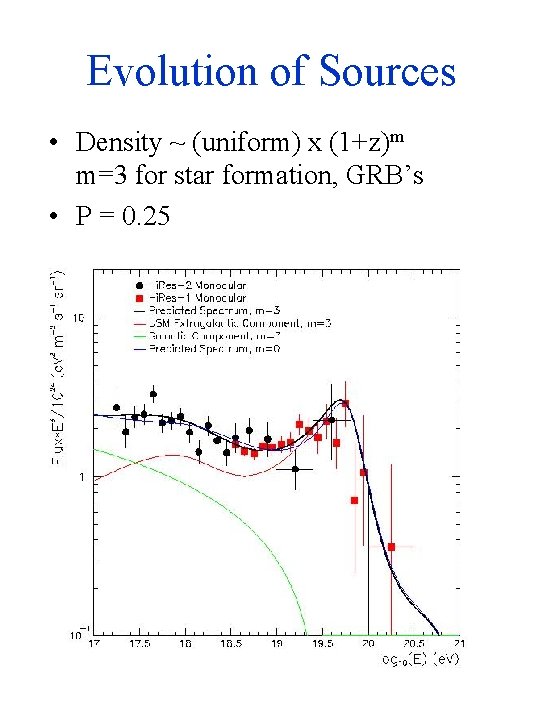
Evolution of Sources • Density ~ (uniform) x (1+z)m m=3 for star formation, GRB’s • P = 0. 25
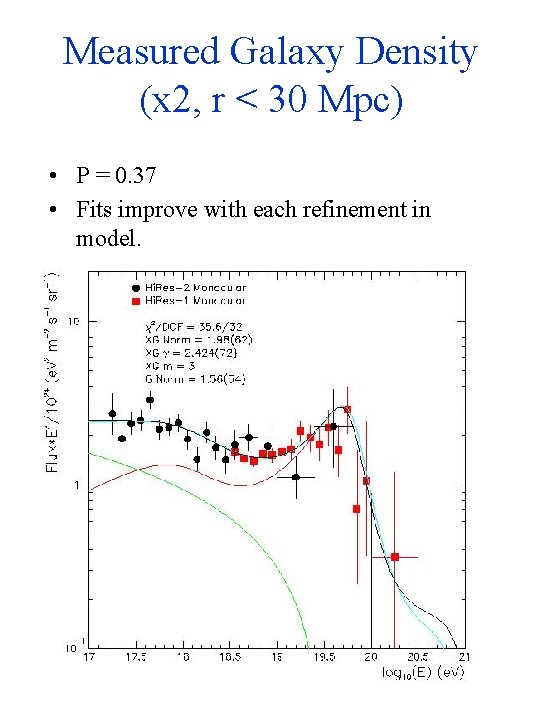
Measured Galaxy Density (x 2, r < 30 Mpc) • P = 0. 37 • Fits improve with each refinement in model.
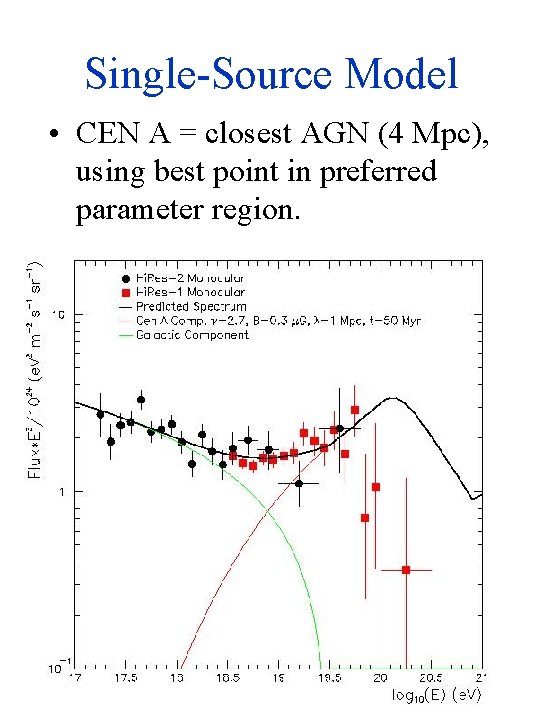
Single-Source Model • CEN A = closest AGN (4 Mpc), using best point in preferred parameter region.
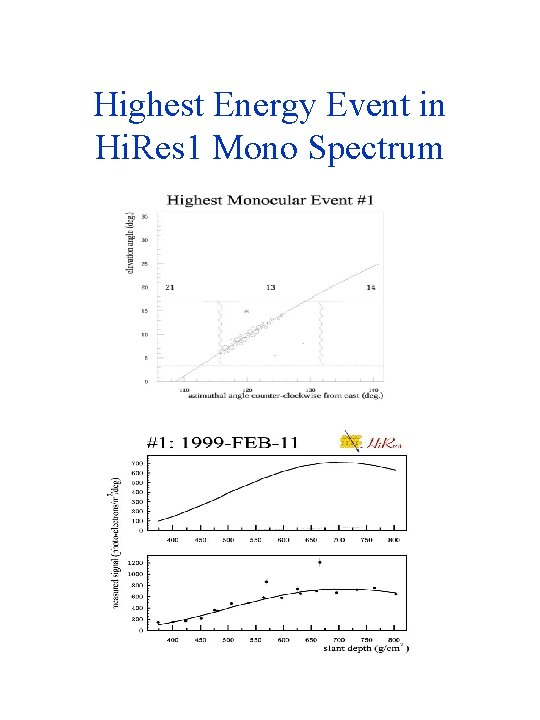
Highest Energy Event in Hi. Res 1 Mono Spectrum
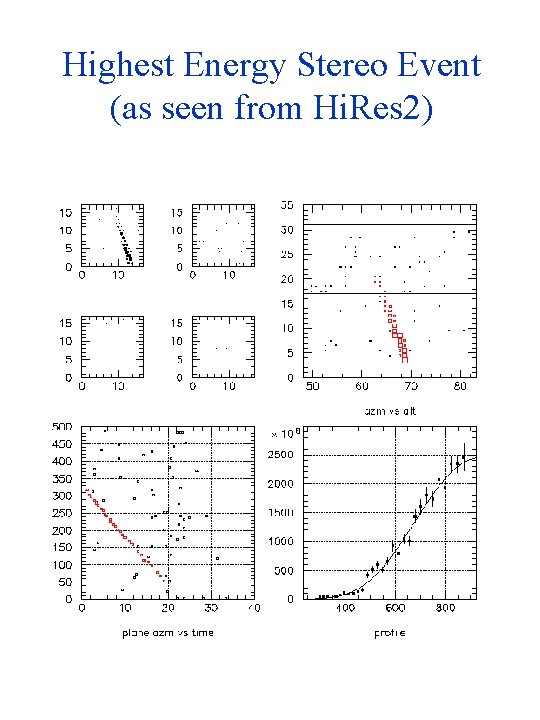
Highest Energy Stereo Event (as seen from Hi. Res 2)
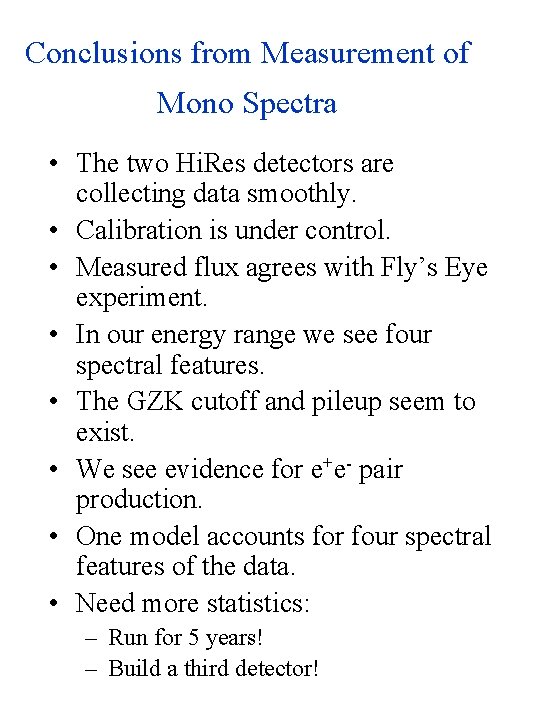
Conclusions from Measurement of Mono Spectra • The two Hi. Res detectors are collecting data smoothly. • Calibration is under control. • Measured flux agrees with Fly’s Eye experiment. • In our energy range we see four spectral features. • The GZK cutoff and pileup seem to exist. • We see evidence for e+e- pair production. • One model accounts for four spectral features of the data. • Need more statistics: – Run for 5 years! – Build a third detector!
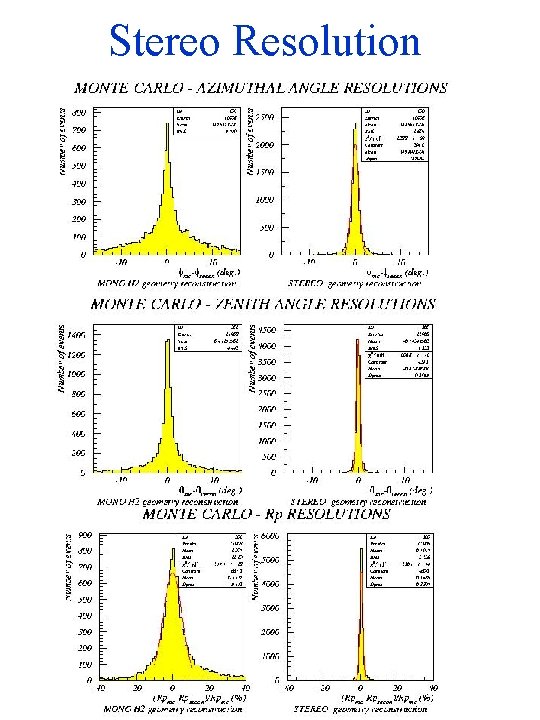
Stereo Resolution
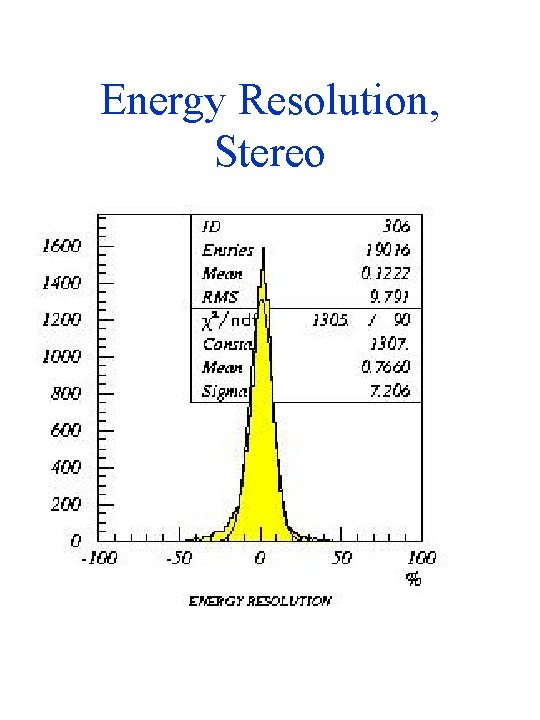
Energy Resolution, Stereo
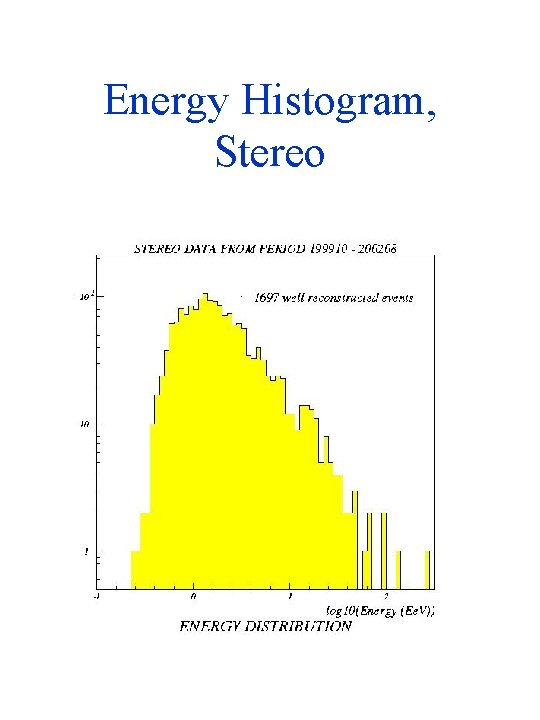
Energy Histogram, Stereo
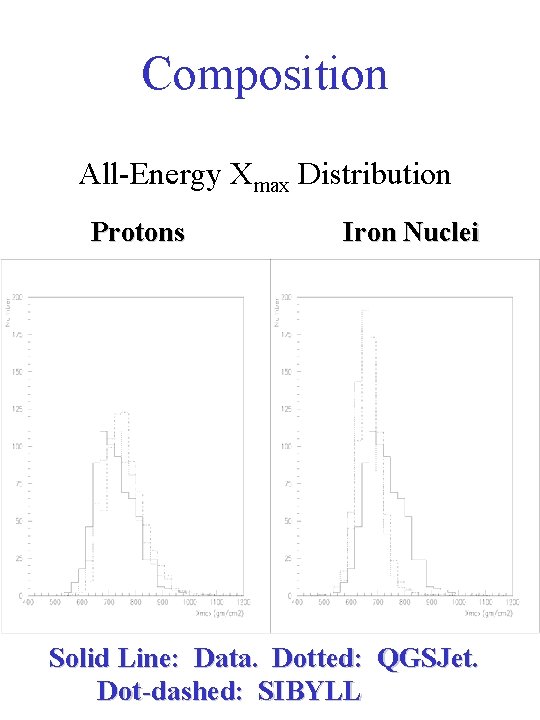
Composition All-Energy Xmax Distribution Protons Iron Nuclei Solid Line: Data. Dotted: QGSJet. Dot-dashed: SIBYLL
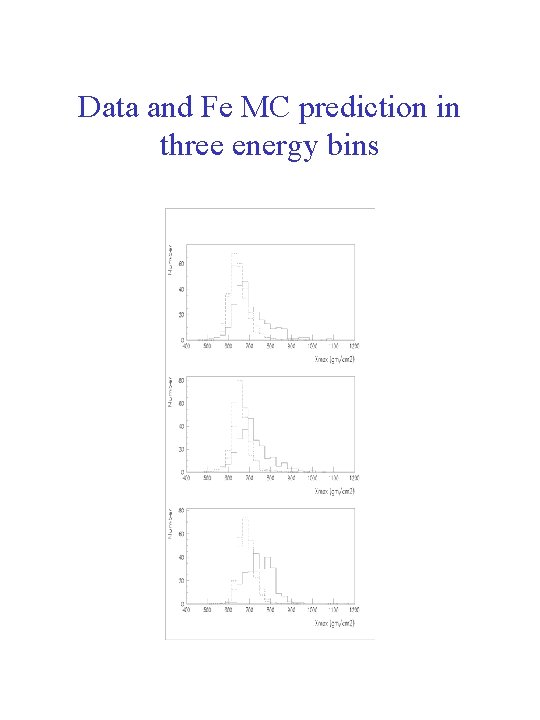
Data and Fe MC prediction in three energy bins
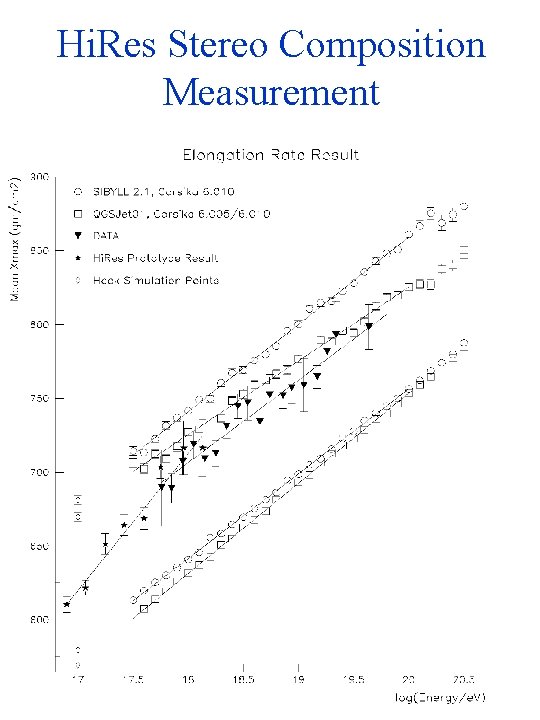
Hi. Res Stereo Composition Measurement
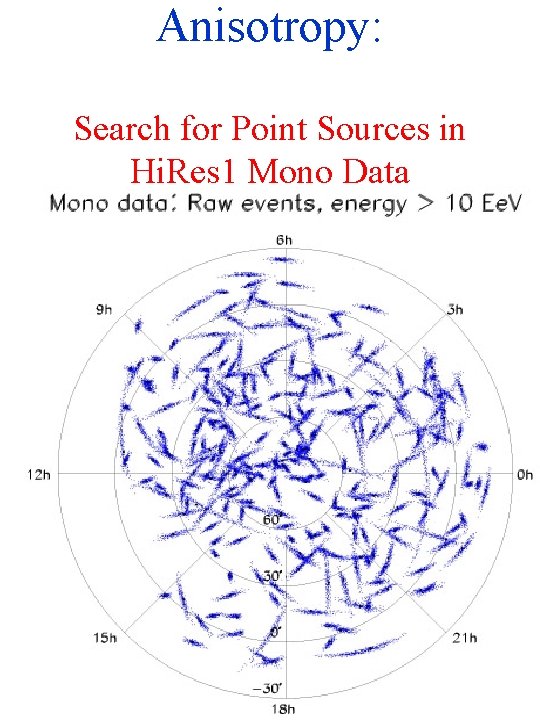
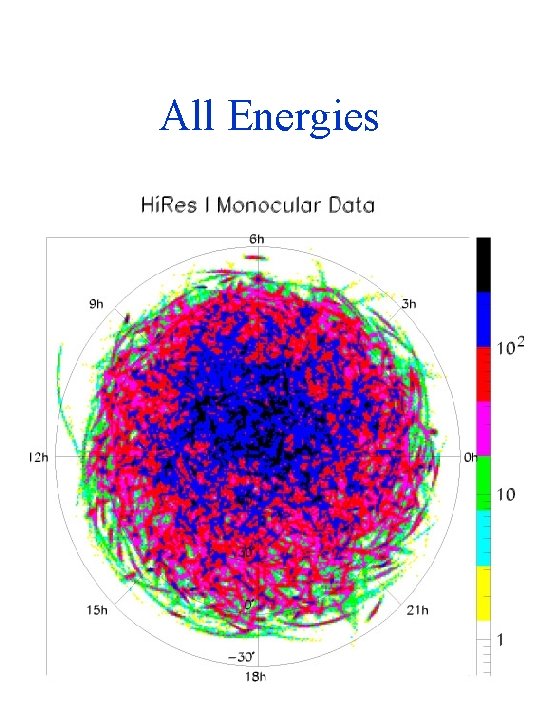
Anisotropy: Search for Point Sources in Hi. Res 1 Mono Data
All Energies
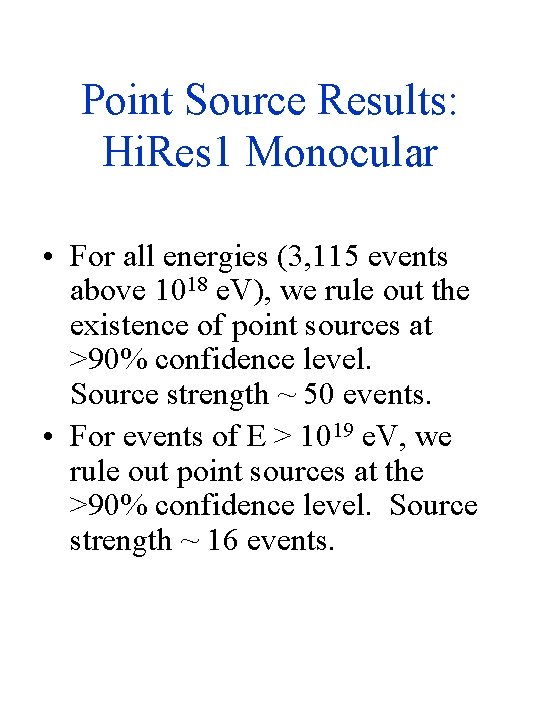
Point Source Results: Hi. Res 1 Monocular • For all energies (3, 115 events above 1018 e. V), we rule out the existence of point sources at >90% confidence level. Source strength ~ 50 events. • For events of E > 1019 e. V, we rule out point sources at the >90% confidence level. Source strength ~ 16 events.
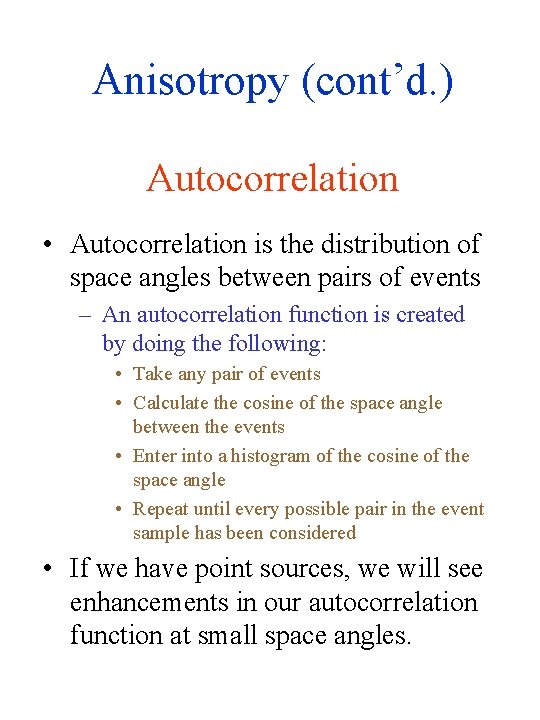
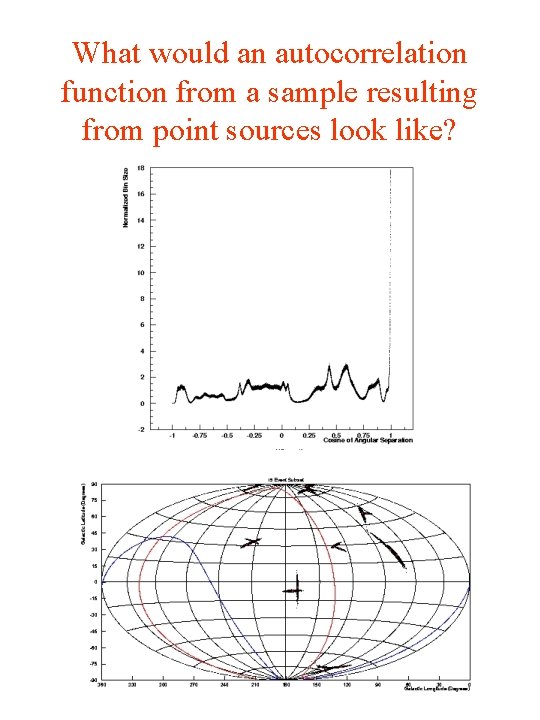
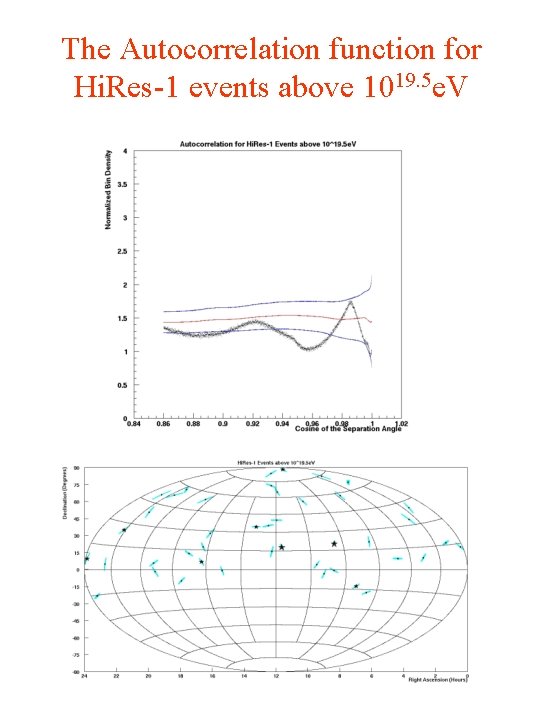
Anisotropy (cont’d. ) Autocorrelation • Autocorrelation is the distribution of space angles between pairs of events – An autocorrelation function is created by doing the following: • Take any pair of events • Calculate the cosine of the space angle between the events • Enter into a histogram of the cosine of the space angle • Repeat until every possible pair in the event sample has been considered • If we have point sources, we will see enhancements in our autocorrelation function at small space angles.
What would an autocorrelation function from a sample resulting from point sources look like?
The Autocorrelation function for Hi. Res-1 events above 1019. 5 e. V
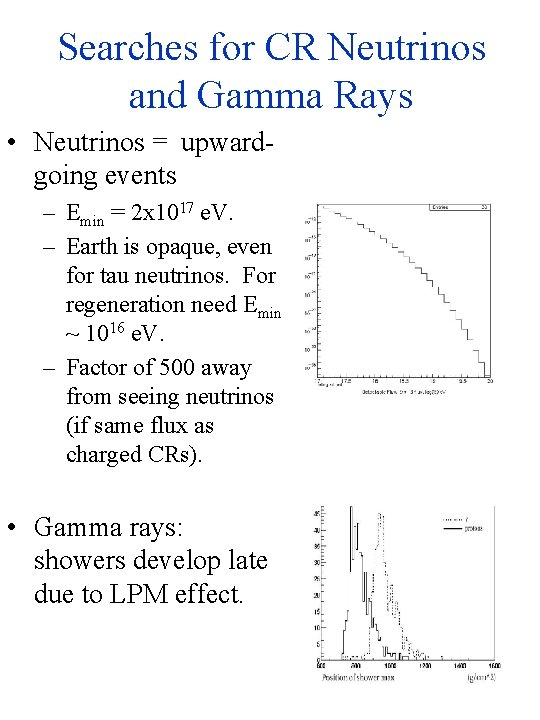
Searches for CR Neutrinos and Gamma Rays • Neutrinos = upwardgoing events – Emin = 2 x 10¹⁷ e. V. – Earth is opaque, even for tau neutrinos. For regeneration need Emin ~ 1016 e. V. – Factor of 500 away from seeing neutrinos (if same flux as charged CRs). • Gamma rays: showers develop late due to LPM effect.
Future Plans • Run for 5 years. – Better statistics at GZK cutoff. – Good statistics at GZK pileup. – Excellent statistics at e+e- pairproduction region: second knee and ankle. • Build a third detector. – Improve signal/noise by x 20. – Search for CR neutrinos down to 1 x 10¹⁶ e. V. – Increase data rate x 2 for high energy events. – Preparing NSF MRI proposal.