
Current Future Trends in Six Sigma Lean Productivity











- Slides: 37
Current & Future Trends in Six Sigma, Lean, Productivity & Process Excellence Prepared for the Quality & Performance Forum Presented by Chris Bogan President & Chief Executive Officer Copyright © BEST PRACTICES, ® LLC 1
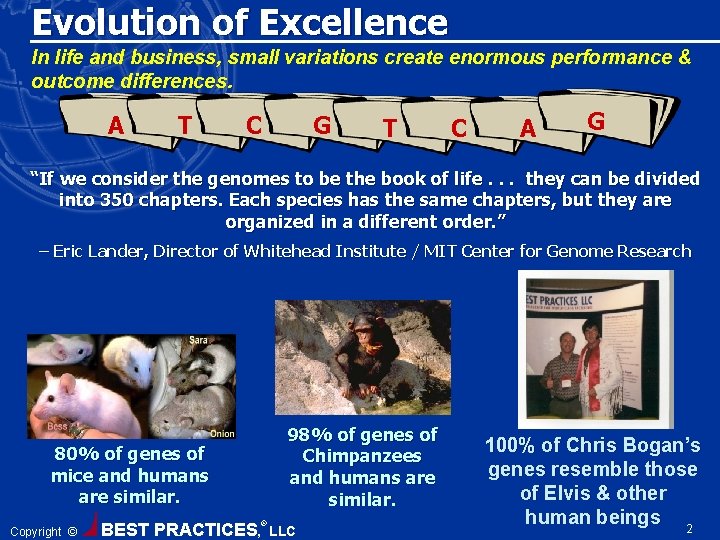
Evolution of Excellence In life and business, small variations create enormous performance & outcome differences. A T C G T C A G “If we consider the genomes to be the book of life. . . they can be divided into 350 chapters. Each species has the same chapters, but they are organized in a different order. ” – Eric Lander, Director of Whitehead Institute / MIT Center for Genome Research 98% of genes of Chimpanzees and humans are similar. 80% of genes of mice and humans are similar. Copyright © BEST PRACTICES, ® LLC 100% of Chris Bogan’s genes resemble those of Elvis & other human beings 2
Management Trends: Quality leaders must assess which management tools and approaches will lead to high performance. Then they must fit the right tools to the right situations for their company’s lifecycle and competitive landscape. Copyright © BEST PRACTICES, ® LLC 3
Increase Value Through Free Cash Flow Warren Buffet presents this view of how to create value. Value is created by enhancing free cash flow. Effective productivity efforts help managers improve the operational drivers of free cash flow. INCREASE REVENUE INCREASE LONG TERM FREE CASH FLOWS REDUCE CAPITAL EXPENDITURES INCREASE SHAREHOLDER VALUE REDUCE WORKING CAPITAL INVESTMENT REDUCE COST OF CAPITAL Copyright © BEST PRACTICES, IMPROVE OPERATING MARGIN ® LLC LOWER TAX RATE DURATION OF CASH FLOWS 4
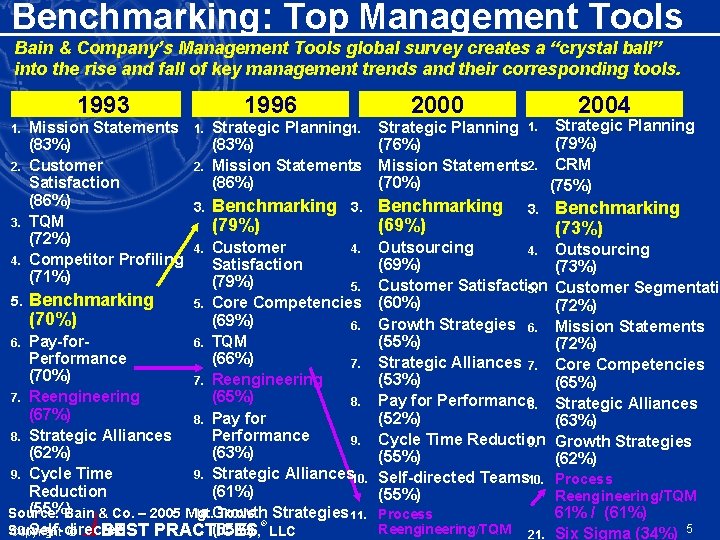
Benchmarking: Top Management Tools Bain & Company’s Management Tools global survey creates a “crystal ball” into the rise and fall of key management trends and their corresponding tools. 1993 1996 Mission Statements 1. Strategic Planning 1. (83%) 2. Customer 2. Mission Statements 2. Satisfaction (86%) 3. Benchmarking 3. 3. TQM (79%) (72%) 4. Customer 4. 4. Competitor Profiling Satisfaction (71%) (79%) 5. 5. Benchmarking 5. Core Competencies (70%) (69%) 6. 6. TQM 6. Pay-for(66%) Performance 7. (70%) 7. Reengineering (65%) 7. Reengineering 8. (67%) 8. Pay for Performance 8. Strategic Alliances 9. (63%) (62%) 9. Strategic Alliances 10. 9. Cycle Time (61%) Reduction (55%)Bain & Co. – 2005 Mgt. 10. Growth Source: Tools Strategies 11. ® (55%) , LLC 10. Self-directed Survey Copyright © BEST PRACTICES 1. 2000 2004 Strategic Planning 1. Strategic Planning (79%) (76%) Mission Statements 2. CRM (70%) (75%) Benchmarking (69%) 3. Outsourcing 4. (69%) Customer Satisfaction 5. (60%) Growth Strategies 6. (55%) Strategic Alliances 7. (53%) Pay for Performance 8. (52%) Cycle Time Reduction 9. (55%) Self-directed Teams 10. (55%) Process Reengineering/TQM 21. Benchmarking (73%) Outsourcing (73%) Customer Segmentatio (72%) Mission Statements (72%) Core Competencies (65%) Strategic Alliances (63%) Growth Strategies (62%) Process Reengineering/TQM 61% / (61%) Six Sigma (34%) 5
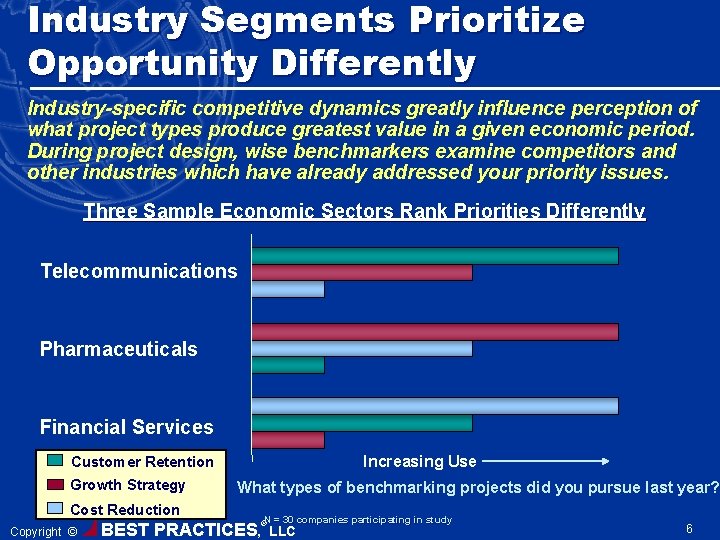
Industry Segments Prioritize Opportunity Differently Industry-specific competitive dynamics greatly influence perception of what project types produce greatest value in a given economic period. During project design, wise benchmarkers examine competitors and other industries which have already addressed your priority issues. Three Sample Economic Sectors Rank Priorities Differently Telecommunications Pharmaceuticals Financial Services Increasing Use Customer Retention Growth Strategy What types of benchmarking projects did you pursue last year? Cost Reduction Copyright © BEST PRACTICES, ®N = 30 companies participating in study LLC 6
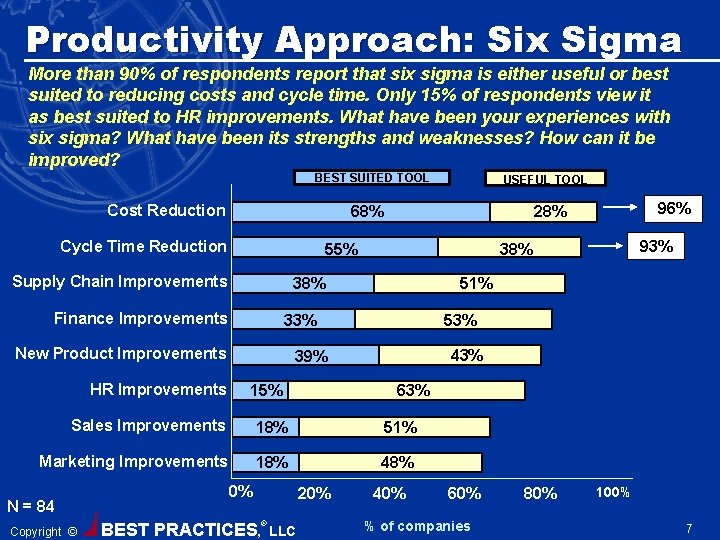
Productivity Approach: Six Sigma More than 90% of respondents report that six sigma is either useful or best suited to reducing costs and cycle time. Only 15% of respondents view it as best suited to HR improvements. What have been your experiences with six sigma? What have been its strengths and weaknesses? How can it be improved? BEST SUITED TOOL Cost Reduction 68% Cycle Time Reduction 51% 33% New Product Improvements 53% 43% 39% 15% 63% Sales Improvements 18% 51% Marketing Improvements 18% 48% N = 84 Copyright © 0% BEST PRACTICES, 20% ® LLC 93% 38% Finance Improvements 96% 28% 55% Supply Chain Improvements HR Improvements USEFUL TOOL 40% 60% % of companies 80% 100% 7
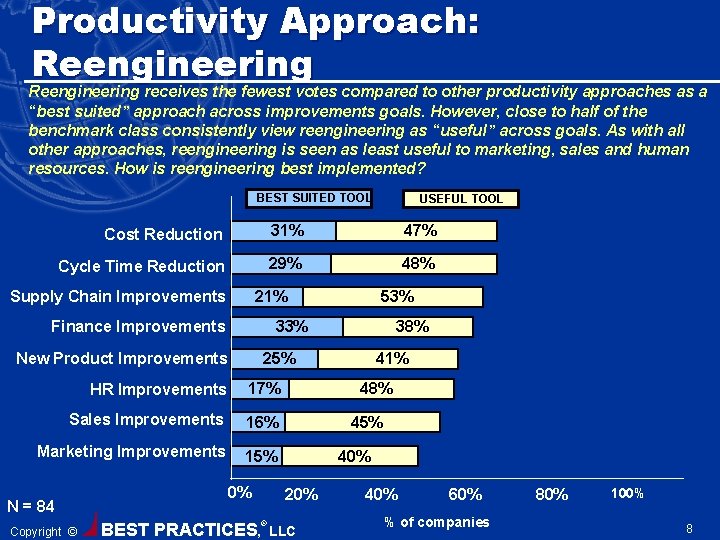
Productivity Approach: Reengineering receives the fewest votes compared to other productivity approaches as a “best suited” approach across improvements goals. However, close to half of the benchmark class consistently view reengineering as “useful” across goals. As with all other approaches, reengineering is seen as least useful to marketing, sales and human resources. How is reengineering best implemented? BEST SUITED TOOL USEFUL TOOL Cost Reduction 31% 47% Cycle Time Reduction 29% 48% Supply Chain Improvements 21% Finance Improvements 33% New Product Improvements 17% Sales Improvements 16% Marketing Improvements 15% Copyright © 38% 25% HR Improvements N = 84 53% 0% BEST PRACTICES, 48% 45% 40% 20% ® 41% LLC 40% 60% % of companies 80% 100% 8
Productivity Approach: Lean Sigma Lean sigma is viewed as well-suited to all goals. Well over half the benchmark class considers it best suited for cost and cycle reduction and supply chain. Over a quarter consider it best suited to improving sales, new products and financial processes. What has been your experience/knowledge of lean sigma? How different is it from lean or six sigma approaches? USEFUL TOOL BEST SUITED TOOL Cycle Time Reduction 71% 67% Cost Reduction 32% Finance Improvements 46% 36% New Product Improvements 39% 22% HR Improvements 47% 25% Sales Improvements 40% 22% Marketing Improvements Copyright © 21% 55% Supply Chain Improvements N = 84 17% 0% BEST PRACTICES, 40% 20% ® LLC 40% 60% % of companies 80% 100% 9
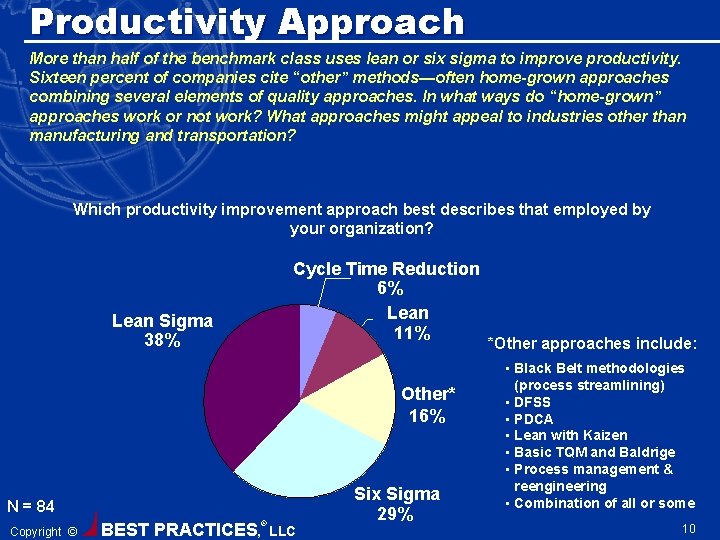
Productivity Approach More than half of the benchmark class uses lean or six sigma to improve productivity. Sixteen percent of companies cite “other” methods—often home-grown approaches combining several elements of quality approaches. In what ways do “home-grown” approaches work or not work? What approaches might appeal to industries other than manufacturing and transportation? Which productivity improvement approach best describes that employed by your organization? Cycle Time Reduction 6% Lean 11% Lean Sigma 38% Other* 16% N = 84 Copyright © BEST PRACTICES, ® LLC Six Sigma 29% *Other approaches include: • Black Belt methodologies (process streamlining) • DFSS • PDCA • Lean with Kaizen • Basic TQM and Baldrige • Process management & reengineering • Combination of all or some 10
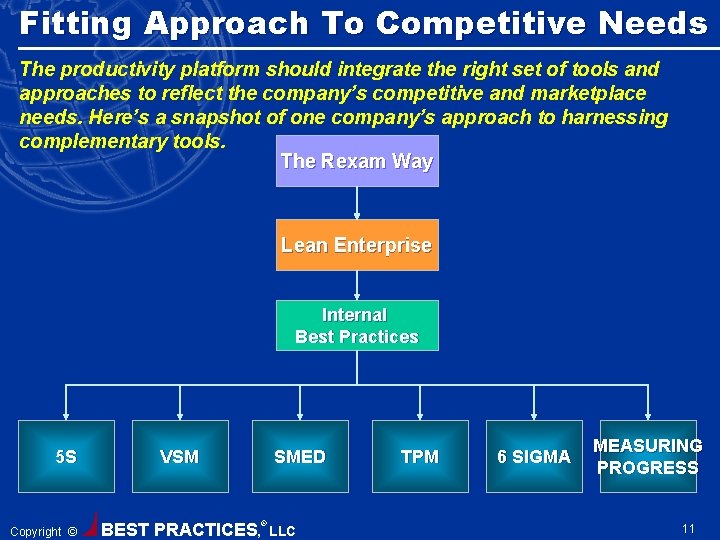
Fitting Approach To Competitive Needs The productivity platform should integrate the right set of tools and approaches to reflect the company’s competitive and marketplace needs. Here’s a snapshot of one company’s approach to harnessing complementary tools. The Rexam Way Lean Enterprise Internal Best Practices 5 S Copyright © VSM BEST PRACTICES, SMED ® LLC TPM 6 SIGMA MEASURING PROGRESS 11
Fitting Quality Structures To Competitive Needs: Quality leaders evolve their forms and approaches to optimize performance in different life stages of their organizations! Copyright © BEST PRACTICES, ® LLC 12
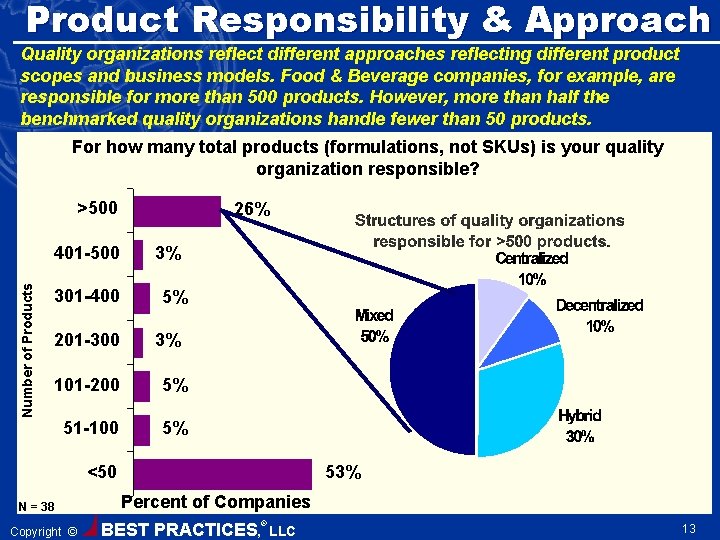
Product Responsibility & Approach Quality organizations reflect different approaches reflecting different product scopes and business models. Food & Beverage companies, for example, are responsible for more than 500 products. However, more than half the benchmarked quality organizations handle fewer than 50 products. For how many total products (formulations, not SKUs) is your quality organization responsible? >500 Number of Products 401 -500 301 -400 201 -300 26% 3% 5% 3% 101 -200 5% 51 -100 5% <50 N = 38 Copyright © 53% Percent of Companies BEST PRACTICES, ® LLC 13
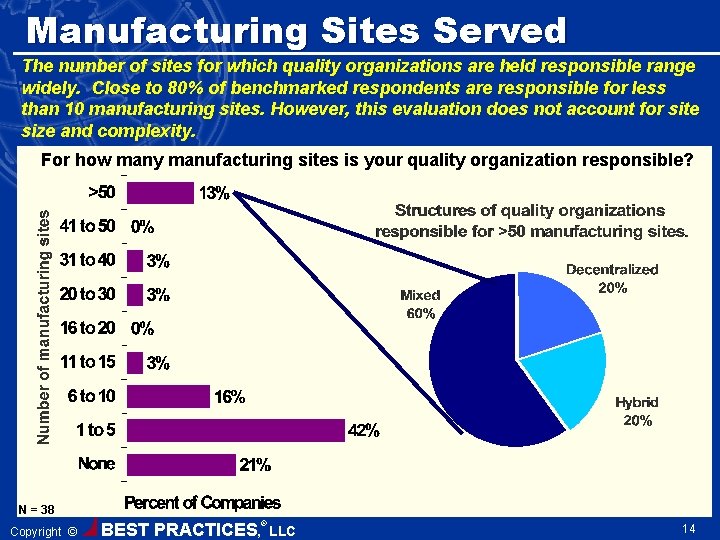
Manufacturing Sites Served The number of sites for which quality organizations are held responsible range widely. Close to 80% of benchmarked respondents are responsible for less than 10 manufacturing sites. However, this evaluation does not account for site size and complexity. For how many manufacturing sites is your quality organization responsible? N = 38 Copyright © BEST PRACTICES, ® LLC 14
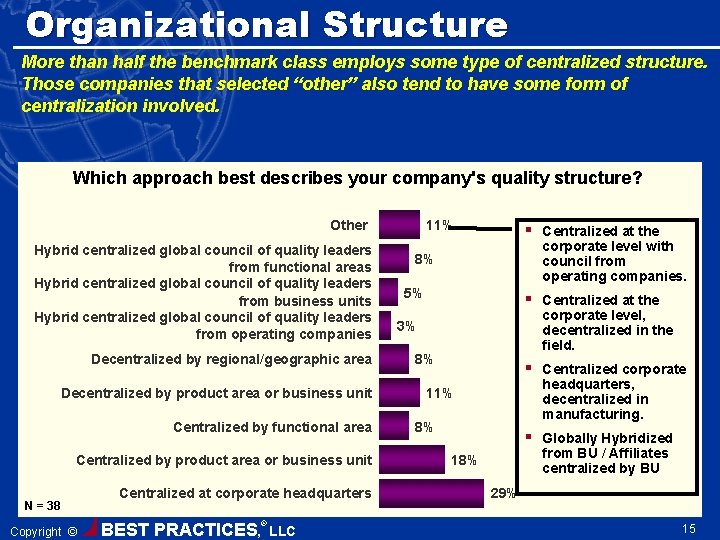
Organizational Structure More than half the benchmark class employs some type of centralized structure. Those companies that selected “other” also tend to have some form of centralization involved. Which approach best describes your company's quality structure? Other Hybrid centralized global council of quality leaders from functional areas Hybrid centralized global council of quality leaders from business units Hybrid centralized global council of quality leaders from operating companies Decentralized by regional/geographic area Decentralized by product area or business unit Centralized by functional area Centralized by product area or business unit N = 38 Copyright © Centralized at corporate headquarters BEST PRACTICES, ® LLC 11% § Centralized at the corporate level with council from operating companies. § Centralized at the corporate level, decentralized in the field. § Centralized corporate headquarters, decentralized in manufacturing. § Globally Hybridized from BU / Affiliates centralized by BU 8% 5% 3% 8% 11% 8% 18% 29% 15
Leadership & Investment: Resources are always limited. Quality leaders must determine where best to invest capital and staff resources to drive grow and productivity. Copyright © BEST PRACTICES, ® LLC 16
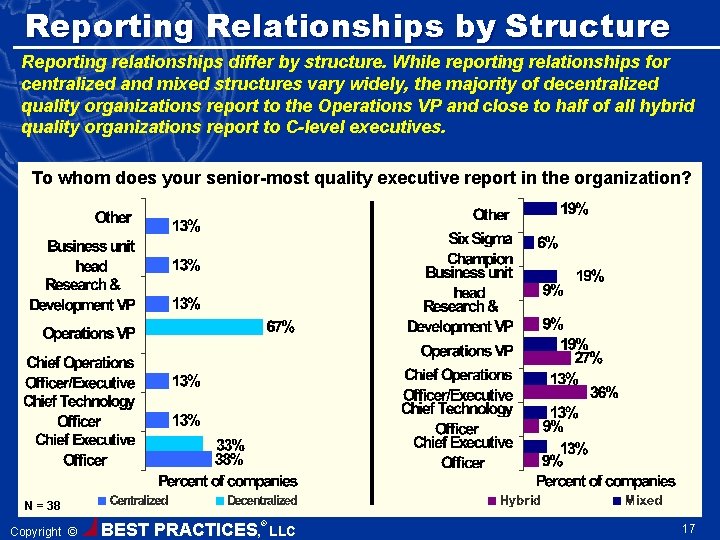
Reporting Relationships by Structure Reporting relationships differ by structure. While reporting relationships for centralized and mixed structures vary widely, the majority of decentralized quality organizations report to the Operations VP and close to half of all hybrid quality organizations report to C-level executives. To whom does your senior-most quality executive report in the organization? N = 38 Copyright © BEST PRACTICES, ® LLC 17
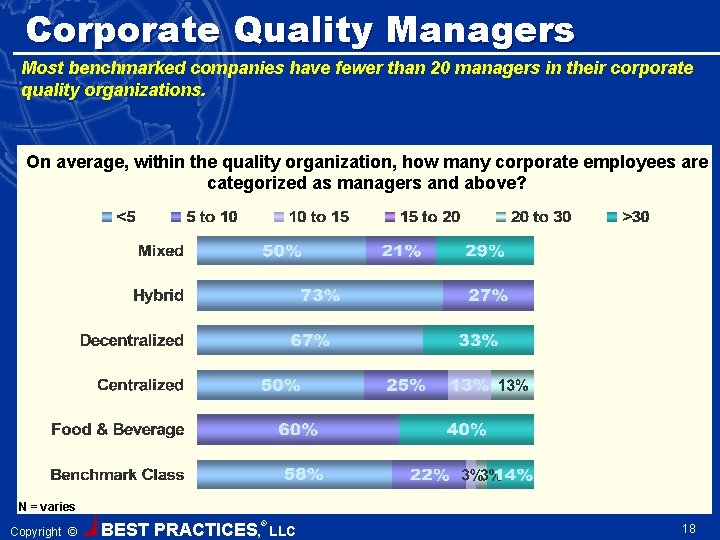
Corporate Quality Managers Most benchmarked companies have fewer than 20 managers in their corporate quality organizations. On average, within the quality organization, how many corporate employees are categorized as managers and above? N = varies Copyright © BEST PRACTICES, ® LLC 18
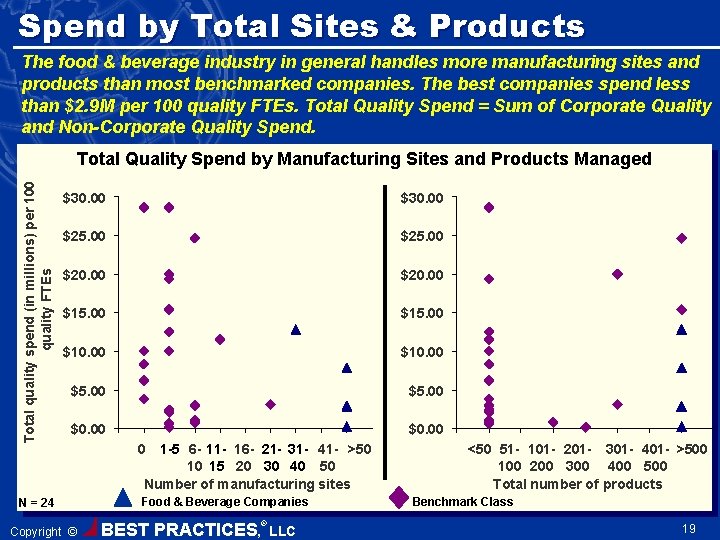
Spend by Total Sites & Products The food & beverage industry in general handles more manufacturing sites and products than most benchmarked companies. The best companies spend less than $2. 9 M per 100 quality FTEs. Total Quality Spend = Sum of Corporate Quality and Non-Corporate Quality Spend. Total quality spend (in millions) per 100 quality FTEs Total Quality Spend by Manufacturing Sites and Products Managed $30. 00 $25. 00 $20. 00 $15. 00 $10. 00 $5. 00 $0. 00 N = 24 Copyright © 0 1 -5 6 - 11 - 16 - 21 - 31 - 41 - >50 10 15 20 30 40 50 Number of manufacturing sites Food & Beverage Companies BEST PRACTICES, ® LLC <50 51 - 101 - 201 - 301 - 401 - >500 100 200 300 400 500 Total number of products Benchmark Class 19
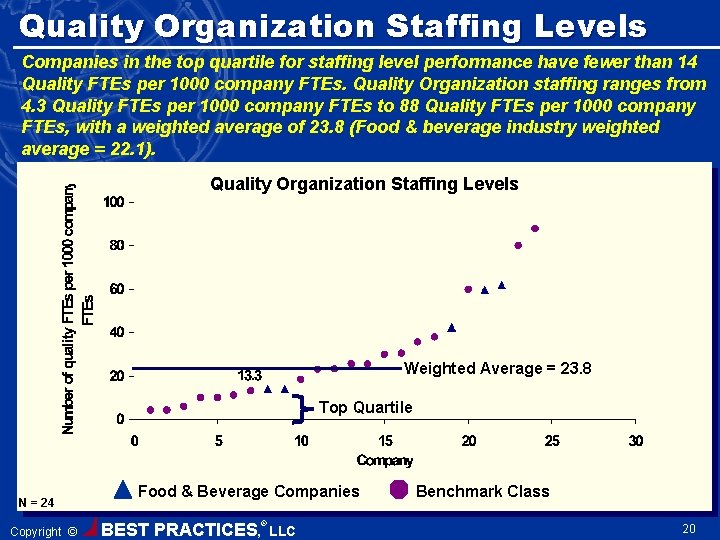
Quality Organization Staffing Levels Companies in the top quartile for staffing level performance have fewer than 14 Quality FTEs per 1000 company FTEs. Quality Organization staffing ranges from 4. 3 Quality FTEs per 1000 company FTEs to 88 Quality FTEs per 1000 company FTEs, with a weighted average of 23. 8 (Food & beverage industry weighted average = 22. 1). Quality Organization Staffing Levels Weighted Average = 23. 8 Top Quartile N = 24 Copyright © Food & Beverage Companies BEST PRACTICES, ® LLC Benchmark Class 20
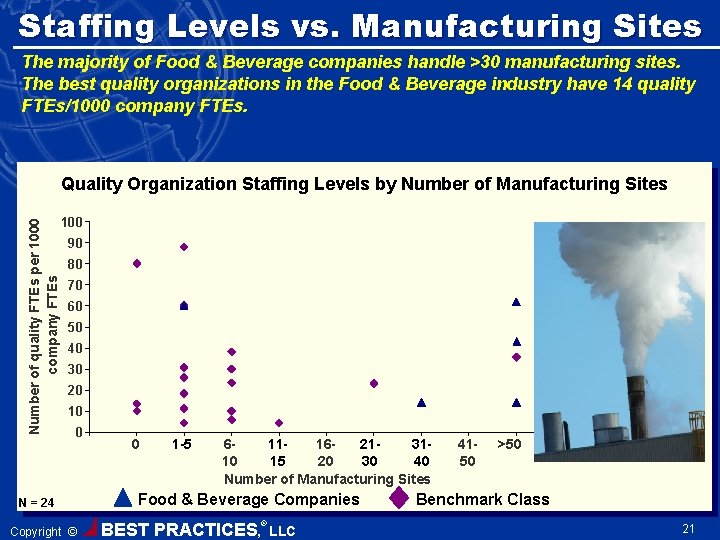
Staffing Levels vs. Manufacturing Sites The majority of Food & Beverage companies handle >30 manufacturing sites. The best quality organizations in the Food & Beverage industry have 14 quality FTEs/1000 company FTEs. Number of quality FTEs per 1000 company FTEs Quality Organization Staffing Levels by Number of Manufacturing Sites 100 90 80 70 60 50 40 30 20 10 0 N = 24 Copyright © 0 1 -5 61116213110 15 20 30 40 Number of Manufacturing Sites Food & Beverage Companies BEST PRACTICES, ® LLC 4150 >50 10 Benchmark Class 21
Staffing Levels vs. Total Products All Food & Beverage companies handle >500 products. The best quality organizations in the Food & Beverage industry have 14 quality FTEs/1000 company FTEs. Number of quality FTEs per 1000 company FTEs Quality Organization Staffing Levels by Number of Total Products N = 24 Copyright © 100 90 80 70 60 50 40 30 20 10 0 <50 51100 101201301200 300 400 Number of Total Products Food & Beverage Companies BEST PRACTICES, ® LLC 401500 >500 Benchmark Class 22
Productivity Benchmarks: Quality leaders use benchmarks to gauge their organizations health, progress and relative productivity. Copyright © BEST PRACTICES, ® LLC 23
Cultural Obstacles You should expect cultural obstacles. Some people find it unnatural to share, exchange & learn from others’ best practices and experiences. Homo Sapiens History & Lessons Neanderthals History & Lessons • • 400, 000 years of history Same approach Little innovation or change Failure when confronted by more agile competition. Copyright © BEST PRACTICES, ® LLC • 100, 000 years of history • Symbolic thought & language • Learning & best practice sharing • Success through innovation & continuous 24
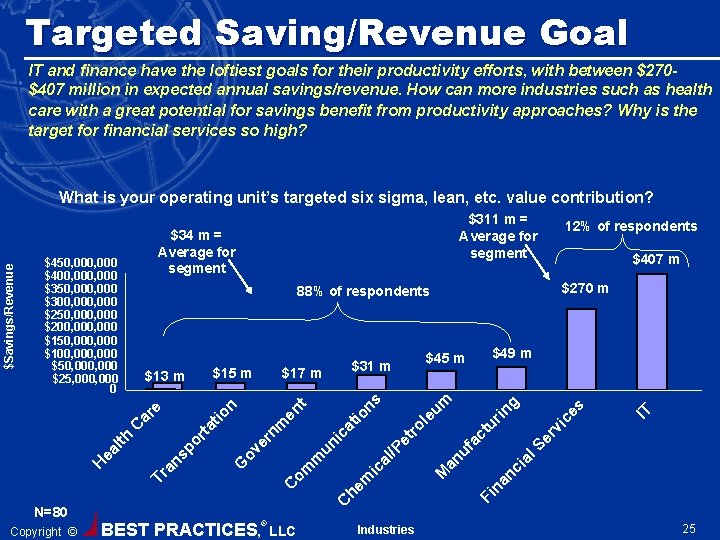
Targeted Saving/Revenue Goal IT and finance have the loftiest goals for their productivity efforts, with between $270$407 million in expected annual savings/revenue. How can more industries such as health care with a great potential for savings benefit from productivity approaches? Why is the target for financial services so high? $270 m ® LLC Industries vi c in ur er ct Fi na nc ia l. S fa an u M es g m C he m ic om C eu et r al /P un m ov G ol io ic at nm er or sp Tr an ns t en n ta tio ar C BEST PRACTICES, $49 m $45 m $31 m $17 m $15 m $13 m th Copyright © $407 m 88% of respondents ea l N=80 12% of respondents IT $450, 000 $400, 000 $350, 000 $300, 000 $250, 000 $200, 000 $150, 000 $100, 000 $50, 000 $25, 000 0 H $311 m = Average for segment $34 m = Average for segment e $Savings/Revenue What is your operating unit’s targeted six sigma, lean, etc. value contribution? 25
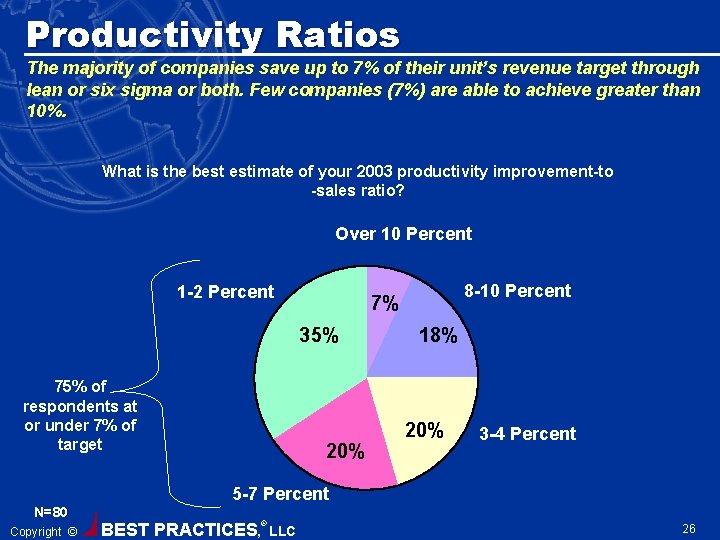
Productivity Ratios The majority of companies save up to 7% of their unit’s revenue target through lean or six sigma or both. Few companies (7%) are able to achieve greater than 10%. What is the best estimate of your 2003 productivity improvement-to -sales ratio? Over 10 Percent 1 -2 Percent 35% 75% of respondents at or under 7% of target 8 -10 Percent 7% 20% 18% 20% 3 -4 Percent 5 -7 Percent N=80 Copyright © BEST PRACTICES, ® LLC 26
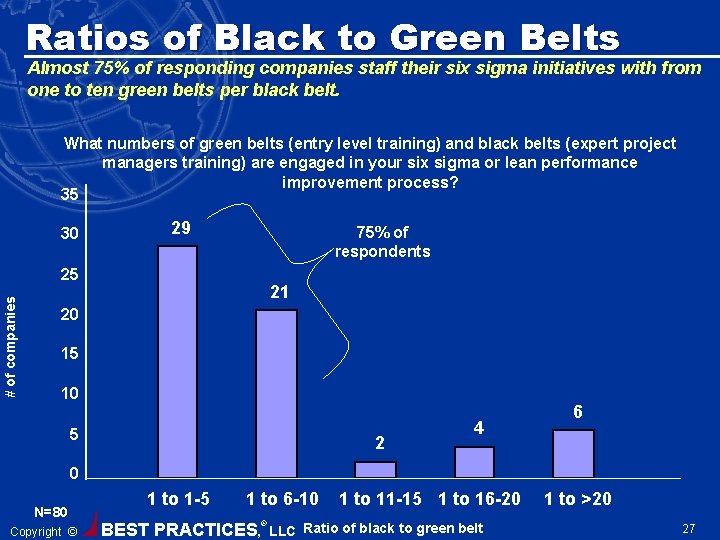
Ratios of Black to Green Belts Almost 75% of responding companies staff their six sigma initiatives with from one to ten green belts per black belt. What numbers of green belts (entry level training) and black belts (expert project managers training) are engaged in your six sigma or lean performance improvement process? 35 30 29 75% of respondents # of companies 25 21 20 15 10 5 2 4 6 0 N=80 Copyright © 1 to 1 -5 1 to 6 -10 BEST PRACTICES, ® 1 to 11 -15 1 to 16 -20 LLC Ratio of black to green belt 1 to >20 27
Savings Contributions Target One quarter of responding companies have specific targets against which their black belts must deliver contributions from their projects to meet performance targets. How do companies without annual contributions by black belts measuring their results? What might be the reason that more industries aren’t reporting annual contributions as a means of performance measurement? Do you have an annual aggregate financial value contribution target that your black belts must contribute from their projects to meet overall performance targets? 64% of companies with an annual contribution are in the manufacturing industry. Transportation is the second largest industry group with annual contributions. Yes 24% No 76% N=80 Copyright © BEST PRACTICES, ® LLC 28
Black Belt Contribution Of those companies that have a contribution target for their black belts (25%), 86% have targets less than $5 million annually. What do you feel is a reasonable contribution from black belts to reach objectives? What are the estimated values of the annual contributions that black belts must make to meet performance targets? 35% % of companies 30% 32% 27% 25% 27% 20% 15% 14% 10% 5% 0% N=80 Copyright © $100 K-500 K BEST PRACTICES, $>500 K-1 M ® >$1 M- 4. 99 M LLCRange of $ Contributions $5 M 29
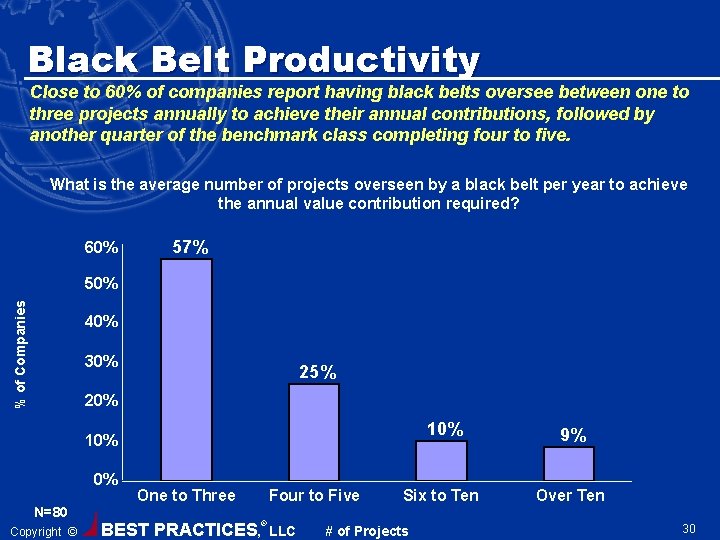
Black Belt Productivity Close to 60% of companies report having black belts oversee between one to three projects annually to achieve their annual contributions, followed by another quarter of the benchmark class completing four to five. What is the average number of projects overseen by a black belt per year to achieve the annual value contribution required? 60% 57% % of Companies 50% 40% 30% 25% 20% 10% 9% Six to Ten Over Ten 10% 0% N=80 Copyright © One to Three BEST PRACTICES, Four to Five ® LLC # of Projects 30
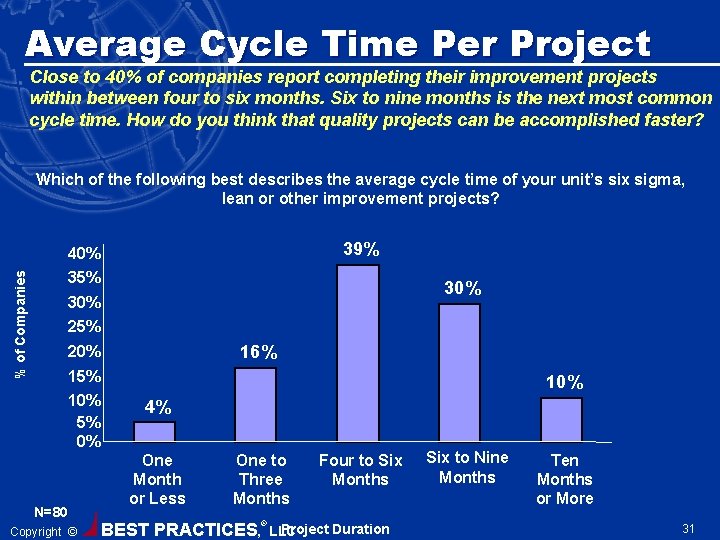
Average Cycle Time Per Project Close to 40% of companies report completing their improvement projects within between four to six months. Six to nine months is the next most common cycle time. How do you think that quality projects can be accomplished faster? Which of the following best describes the average cycle time of your unit’s six sigma, lean or other improvement projects? 39% % of Companies 40% 35% 30% 25% 16% 20% 15% 10% 5% 0% N=80 Copyright © 10% 4% One Month or Less One to Three Months BEST PRACTICES, ® Four to Six Months Project Duration LLC Six to Nine Months Ten Months or More 31
Percentage of Benefit Per Function Companies find that 88% of productivity efforts benefit operations, followed by manufacturing and “other, ” such as collections and administration. What are the implications for industries with a heavy emphasis on sales and marketing like the pharmaceutical industry? What percentage of your unit’s six sigma, lean or other improvement projects benefit the following functions? 88% Operations Manufacturing 49% 20% 16% 15% Other* Supply Chain Engineering Customer Service 15% 13% 12% 10% 8% 8% 7% 5% R&D/New Product Development IT Sales Financial Services Support Services Marketing HR N=80 * Legal, Collections, Administration, Health care Copyright © 0% BEST PRACTICES, 20% ® LLC 40% 60% % of Companies 80% 100% 32
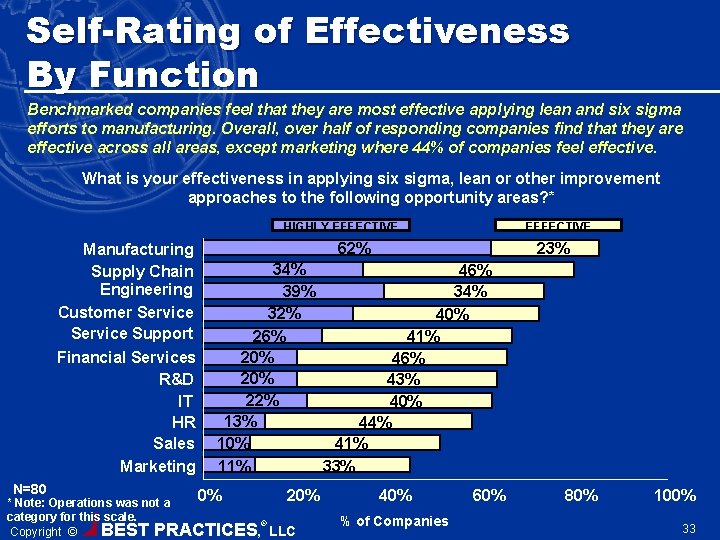
Self-Rating of Effectiveness By Function Benchmarked companies feel that they are most effective applying lean and six sigma efforts to manufacturing. Overall, over half of responding companies find that they are effective across all areas, except marketing where 44% of companies feel effective. What is your effectiveness in applying six sigma, lean or other improvement approaches to the following opportunity areas? * HIGHLY EFFECTIVE Manufacturing Supply Chain Engineering Customer Service Support Financial Services R&D IT HR Sales Marketing N=80 EFFECTIVE 62% 23% 34% 46% 39% 34% 32% 40% 26% 41% 20% 46% 20% 43% 22% 40% 13% 44% 41% 10% 33% 11% 0% 20% * Note: Operations was not a category for this scale. ® Copyright © BEST PRACTICES, LLC 40% % of Companies 60% 80% 100% 33
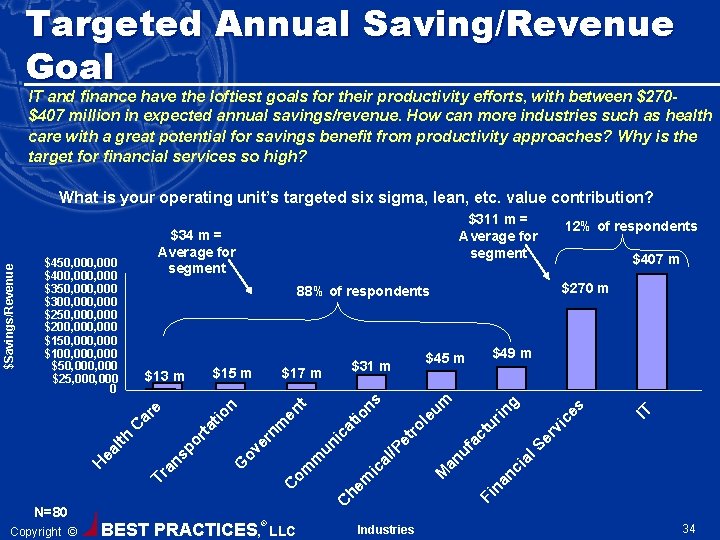
Targeted Annual Saving/Revenue Goal IT and finance have the loftiest goals for their productivity efforts, with between $270$407 million in expected annual savings/revenue. How can more industries such as health care with a great potential for savings benefit from productivity approaches? Why is the target for financial services so high? $270 m ® LLC Industries vi c in ur er ct Fi na nc ia l. S fa an u M es g m C he m ic om C eu et r al /P un m ov G ol io ic at nm er or sp Tr an ns t en n ta tio ar C BEST PRACTICES, $49 m $45 m $31 m $17 m $15 m $13 m th Copyright © $407 m 88% of respondents ea l N=80 12% of respondents IT $450, 000 $400, 000 $350, 000 $300, 000 $250, 000 $200, 000 $150, 000 $100, 000 $50, 000 $25, 000 0 H $311 m = Average for segment $34 m = Average for segment e $Savings/Revenue What is your operating unit’s targeted six sigma, lean, etc. value contribution? 34
There are many pathways up the mountain. You better have a map! Copyright © BEST PRACTICES, ® LLC 35
Pathways To Excellence Discussion: What is the agenda in your organization for productivity and competitive success during the next 12 months in your organization? Copyright © BEST PRACTICES, ® LLC 36
Capability Summary This presentation is the result of primary research. Executives at top companies turn to Best Practices, LLC for actionable and insightful solutions based on the world-class operations of other leading organizations. Let our researchers uncover the next great insights for your operation through our benchmarking research and Internet surveys. Best Practices, LLC 6350 Quadrangle Drive, Suite 200 Chapel Hill, NC 27517 919 -403 -0251 best@best-in-class. com www. best-in-class. com Copyright © BEST PRACTICES, ® LLC 37