Curling High Performance Plan CCA OTP Submission 2012

Curling High Performance Plan CCA OTP Submission 2012

Introduction • • • Our investment in partnership with OTP Partners in Performance = Partners in Planning Focused on and driven to excel Gap analysis – the ability to create an edge Top coaches engaged in the full LTAD spectrum – top to bottom • Developing best practices playground to podium • Legacy through assembling programs from coast to coast

Highlights of past season • Summer training at NTP – specific, integrated, prescriptive • Increased funding for team coaches to go to additional events • Sweep development module • New research project documenting and analyzing curling specific injuries leading to modified conditioning • NTP teams continued to dominate competitions and rankings • Deeper and more integrated support of the LTAD with improved leadership and programming

Focus/ New Strategies • • • Additional engagement in the training environment Specialized Draw Training Specialized Sweep Training New sweep research Integrated Training – (see diagram) Prescriptive Training Technology in Training Measuring & monitoring performance Increased focus and leadership toward 2018 podium potential • Team Dynamics research • Fitness standards & training protocols

Coach Development • • • Combination of formal and informal La Releve Workshop Summer Training Mentoring at events Specific prescriptions
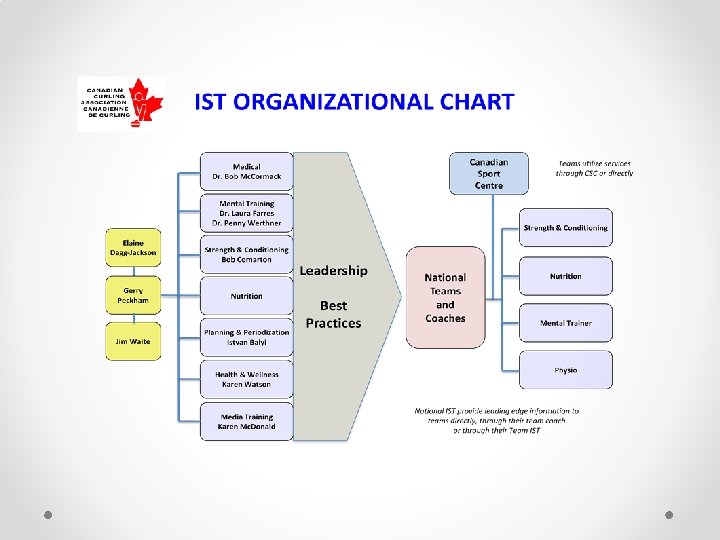

Technology input Physical Skills Speed traps, technical expert Bob Comartin/Team Trainer Kyle Paquette Athlete Draw Skill Integrated Training Model Mental/ Sensory Skills

National Team Program 2012 Statistics of Importance within our program

National Team Program Retention of Athletes -Women -9 of the 12 Skips at the Scotties Hearts in 2011 were former Canadian Junior Champions -7 skips and 13 athletes in 2012 were former Canadian Junior Champions

National Team Program • Retention of Athletes – Men • 6 men at the 2012 Brier were former Can. Jr. Champions (12 in 2011) • 6 men in 2012 were Runners up at the Canadian Juniors (9 in 2011) • 30 of the 48 men in 2012 had competed at Can. Jrs. ( 38 of the men in 2011 )

National Team Program • Competitive Ages –Scotties / Brier • In 2005 the average at both the women’s and men’s championships was between 35 -36. • In 2011 -Women –average was 30. 9 • In 2012 –Women –average was 31. 6 • In 2011 -Men –average was 31. 4 • In 2012 - Men – average was 33. 3

National Team Program • • • Why the lowering ages at the top level? ? LTADM La Releve Podium Project (new) High Performance Camps Summer Camps for Juniors Bantam / Junior competitions University Curling leagues / championships Coaching
 •")
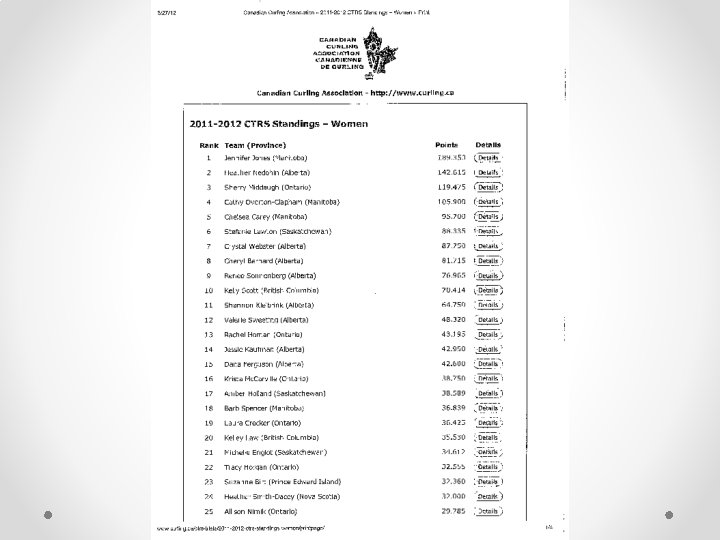
National Team Program - Women • Order of Merit– World Rankings (March 2012) • 1. Jones 406 points 7. Ott (Sui) 204 • 2. Holland 266 8. Middaugh 189 • 3. Carey 244 9. Overton-C. 163 • 4. Kleibrink 236 10. Homan 160 • 5. Lawton 235 11. Muirhead(Sco) 155 • 6. Holland 210 12. Sigfridsson(Swe) 145 14 of top 20 teams are Canadian (13 in 2011)
 1. Mc.")
National Team Program - Men Order of Merit- World Rankings (March 2011) 1. Mc. Ewen 469 points 7. Ulsrud (Nor) 220 2. Martin 446 8. Fowler 189 3. Howard 389 9. Epping 182 4. Stoughton 362 10. Gushue 179 5. Edin (Swe) 304 11. Jacobs 173 6. Koe 289 12. Laycock 172 18 of top 20 teams are Canadian (17 in 2011) • •

National Team Program Olympics 2010 –Percentages -Women • • • 1. Canada 2. Sweden 3. Russia 4. Switzer. 5. U. S. A. 6. China 7. Germany 8. Gr. Britain 9. Japan 10. Denmark 9 -2 81% Silver (includes P. O. ) 9 -2 79% Gold 6 -5 77% 6 -5 76% 3 -6 76% 4 -5 75% Bronze 3 -6 75% Vancouver, Canada 3 -6 74% 4 -5 73%

National Team Program 2011 Worlds – Statistics -Women 1. 2. 3. 4. 5. 6. 7. 8. 9. 10. 11. 12. Canada 10 -5 81% Silver (Team % inc. Playoffs) China 9 -5 81% Bronze Switz. 7 -4 80% Denmark 7 -6 80% Russia 6 -5 78% Sweden 11 -2 78% Gold Germany 5 -6 76% Norway 3 -8 75% Scotland 4 -7 73% Korea 2 -9 73% Denmark U. S. A. 6 -5 73% Czech Rep. 2 -9 70%

National Team Program 2012 Worlds – Statistics -Women 1. 2. 3. 4. 5. 6. 7. 8. 9. 10. 11. 12. Switz. 10 -4 82% Gold ( Team % inc. Playoffs) USA 7 -5 81% Sweden 9 -4 80% Silver Canada 9 -5 80% Bronze Korea 9 -5 78% Scotland 6 -5 78% Russia 4 -7 78% China 6 -5 78% Denmark 5 -6 77% Germany 5 -6 74% Czech Rep. 2 -9 74% Italy 3 -8 73% Lethbridge, Canada

National Team Program Olympics 2010 – Percentages -Men • • • 1. Martin 11 -0 2. Norway 8 -3 3. Switzerland 7 -4 4. Sweden 6 -6 5. Gr. Britain 5 -5 6. Denmark 2 -7 78% 7. China 2 -7 8. USA 2 -7 9. Germany 4 -5 74% 10. France 3 -6 85% Gold (inc. Play offs) 85% Silver 83% Bronze 81% 80% 77% 76% 73% Vancouver, Canada

National Team Program 2011 Worlds –Statistics -Men 1. 2. 3. 4. 5. 6. 7. 8. 9. 10. 11. 12. Canada 10 -1 88% Sweden 7 -4 87% Norway 7 -4 85% Switzer. 6 -5 83% Scotland 9 -2 82% France 7 -4 82% USA 3 -8 81% Germany 6 -5 81% Czech 5 -6 78% Korea 2 -9 78% China 4 -7 77% Denmark 0 -11 72% Gold (Team % include playoffs) Bronze Silver Regina, Canada

National Team Program 2012 Worlds –Statistics -Men • • • 1. Canada 88% Gold Team % - Round Robin 2. China 84% 3. Scotland 84% Silver 4. Norway 83% 5. Sweden 82% Bronze 6. Denmark 81% 7. France 79% 8. Switzerland 79% 9. New Zealand 79% 10. Czech Rep. 78% Basel, Switzerland 11. USA 77% 12. Germany 77%

Canada’s Position • Canada remains #1 in the world in Men’s play by any measure used. • Canada remains in the top three in the world in Women’s play. • Canada is number one in the world in Junior Men’s • Canada remains in the top 3 -4 in Junior Women’s play

Curling High Performance Plan CCA OTP Submission 2012

Curling Sochi 2014 Preparation

Towards Sochi

Our Plan • A very experienced team • Been to Sochi twice • Made connections with key people – RCF & Sport Manager • No concerns about our plan - well in hand European Curling Championship December 2011 – Moscow

CHALLENGES • Language • Foreign environment • Lack of familiarity for ath

Field of Play • • • Ice Technicians Rocks Venue Opportunity to see it WJCC 2013

Olympic Curling Centre INSERT CURLING DIAGRAM FROM PDF FILE


Athlete Accommodation • • Fully exploring and analyzing options Have made an initial decision and communicated to COC Some possibility of adjustments depending on team COC Performance Centre seems to be an ideal option for curling • Preparing for options for taking care of our athletes out-of -village

Elite Condo & Performance Centre

Accreditation • Plan in place • Will work within the allocation

Family Plan • Well in hand • Inspected many options • Working with Mike Murray

Curling - Women Sochi 2014 Preparation

This Plan • Premise: arrive in Sochi 100%/ A-1 condition mentally, physically, technically, spiritually and to attempt to have full environmental control • Optimal load and recovery, a carefully planned rest, recovery and regeneration plan fully integrated within the plan of Post-Trials to the Olympics • This is the third generation of this plan – Torino, Vancouver, Sochi • Partners: Olympic Excellence Series (OES); Canada Olympic Committee (COC); Own the Podium; Curling consultants & Sport Scientists including Istvan Balyi

Women’s Olympic Curling Team Sochi 2014 Preparation Plan Dec. 13 Dec. 14 – 23 Dec. 28 – 30 Jan. 8 - 10 Jan. 15 - 17 Jan 20 - 24 Jan. 28 - 30 Feb. 5 Feb. 8 or 9 Feb. 10 -11 Feb. 12 Feb. 13 Feb. 14, 15 Feb. 14 Feb. 16 - 26 Team Declared/ Meeting on site in Winnipdg Recovery/ Training at home/ Meeting Training Camp, Location TBD Competition - Berne, Switzerland Competition - Glasgow, Scotland (tentative) Training Camp in Winnipeg at BDO Men's event Sochi 2014 Orientation & Training Camp Appearance at Scottie/ Practice on Scottie ice Arrive at Athletes' Village Training in Europe Opening Ceremony Practice at another facility Official Practice at Olympic Venue Move to ‘out of village’ accommodation Olympic Competition

Trials to Jan. 1 Declaration of Olympic Team to Jan 1, 2014

Europe and Olympics January 1 through Olympics ‘Alternative Two” One Competition - Switzerland CH Camp Venue Olympics

Curling High Performance Plan CCA OTP Submission 2012

Curling High Performance Plan CCA OTP Submission 2012

National Team Training Program Sweep Development Training

Gerry Peckham • “We need to evaluate and invest in all aspects of sweeping performance with an eye to enhancing shot execution percentages and team performance standards. ”

ALLAN MAKI | Columnist profile | E-mail CALGARY— From Saturday's Globe and Mail Published Friday, Feb. 17, 2012 8: 51 PM Something had to change. “When you don’t make the playoffs at a provincial, when you’re not coming close, that’s the deflation. That’s when you wonder, ‘What am I doing this for? ’ ” Nedohin said. “But when I come runner-up I think, ‘We’re so close. How do we fine-time those dynamics? ’ ” Nedohin is convinced her bounce-back showing can be traced to a subtle shift. She figured she and her teammates needed to work on endurance and sweeping in an effort to make the tough shots in the late ends. So they spent more time in the gym and they made a subtle change, having sweepers Laine Peters and Jessica Mair switch sides so they could be better positioned to do their job. “There was a recent study about how male sweepers are sweeping and comparing that to what women are doing, ” Nedohin explained. “You see women’s events and we’re not having anywhere near the same results on the rocks. … Yes, we’re not as big and strong as the men, but what can we do with positioning [to get the rocks to curl more]? In July, we focused on our sweeping. There was a lot of fine-tuning to our game. ” Nedohin struggled early in the season with the “sweeping” changes and experimented with different broom heads for optimum results. The team wasn’t highly rated on the Canadian Team Ranking System, which uses points from various events to determine which rink is hot and which is stone cold. But when it counted, Nedohin outduelled Jessie Kaufman

SWEEP MODULE #1 – Technical & Physical • Presentation of Sweep Study findings • Description of objectives & key points • Physical information intake – weight, current physical fitness data • Testing – scale, stroke speed, ice temperature • Training • Re-testing

• SWEEP ANALYSIS - Date: July 23 -24, 2011 GOAL Athlete B Athlete C Athlete D A Push ups current Push ups target Sit ups/ or? – current Sit ups target 25 10 15 15 35 35 30 30 Brush type Brush brand PSI Stroke Speed 15 seconds Body position syn syn Syn 55 48 48 50 closed Open/close Closed d **new Closed **new 90 90 +. 75 56 36% 60 38% 60 37% 57 36% 62 40% 60 38% 79 49% 70 44% 92 60% 94 60% 97 60% 95 60% 100 65% 96 62% 108 67% 105 66% Angle of Attack -leg angle: target 45 INDICATORS Ice Temperature Body weight Weight on scale/ ratio 1. Initial test 1. After training 1. Target 2011 -2012 Load up/ Ratio

SWEEP MODULE 2 – Technical/ Physical • • • Video analysis Athlete observation with coach Adjustments Video Goal setting for development

SWEEP MODULE 3 – Technical/ Physical • • • Review Team data Identify Gaps Review/ identify Target Practice/ training Video

SWEEP MODULE #4 – Weight Judgement • • • Throw the same rock, same path, same target Test judgment skill at: Release Half way point 10’ before hog line Measure and record tendency

Module #5 – Shot Management • Manage the shot o Breakpoint o Energy systems o Impact of cleaning

Training

Next Steps What we know: • Physical demands/ requirements • Technological studies What we need to know: • Scientific data on relative effectiveness: speed/ pressure/ biomechanics • Technology o What we need to measure & how


Curling High Performance Plan CCA OTP Submission 2012

Canadian Curling Association Psychological Skills Training and LTAD Presented by: Kyle Paquette at the 2012 Scotties Tournament of Hearts, Red Deer, AB

Part 1 – Thinking and Focusing

Thinking vs. Focusing Having a conversation with others…

Thinking vs. Focusing Cont’d. • Thinking is the production of thought o Not necessarily present o Minimal sensory experience o Left brain o Great for development • Focusing is the reduction of thought o Fully present o Sensory experience o Right brain o Great for performance

Implications – Preshot Routine The “Think Box” • Thinking is required prior to executing a shot to help prepare athletes tactically, technically, physically and/or psychologically • Athletes’ think boxes will vary according to their individual needs • What are the critical thoughts for each athlete?

Implications – Preshot Routine The “Play Box” • Involves a sensory experience (e. g. , touch, sight, hearing) • Which sense allows you to most effectively and thoughtlessly experience presence (performance) – preferred sense? • Which sensory experience(s) allow you to most effectively execute, and stay engaged throughout, your performance – preferred sensory experience?
 • Focus is a skill that requires")
Thinking and Focusing Deliver strategies (some considerations) • Focus is a skill that requires constant training o Yogi research • “When the sender contradicts verbal messages with nonverbal ones, the receiver believes the nonverbal ones. ” o Attention matching intention • Content must be discovered and jointly created between the coach and athlete (i. e. , tour guide) o Creation of the content, evaluation and assessment
- Slides: 61