Cumulative Frequency Ogive Graphs Notes 13 a Recap


 Graph; A")


 IQ Score")


- Slides: 14
Cumulative Frequency & Ogive Graphs Notes #13 a
Recap on Cumulative Frequency ANS: running total of the frequencies from the previous class to the next. Ex. Fill-in the Cumulative Frequency IQ Score Frequency 50 -69 2 70 -89 33 90 -109 35 110 -129 7 130 -149 1 Cumulative Frequency
Recap on Cumulative Frequency ANS: running total of the frequencies from the previous class to the next. IQ Score Frequency Cumulative Frequency 50 -69 2 2 70 -89 33 35 90 -109 35 70 110 -129 7 77 130 -149 1 78
How to Graphically Display Cumulative Frequency Data ANS: Use an Ogive (‘o-jive’) Graph; A line graph that depicts cumulative frequencies (a. k. a: Cumulative Frequency Polygon)
How to Draw an Ogive ANS: Plotting the Upper Class Boundaries on the x-axis and Cumulative Frequency on the y-axis IQ Score Upper Class Boundaries (x) Cumulative Frequency (y) 30 -49 49. 5 0 50 -69 69. 5 2 70 -89 89. 5 35 90 -109 109. 5 70 110 -129 129. 5 77 130 -149 149. 5 78
3 Steps to Creating an Ogive 1. Modify the original Frequency Distribution by adding NEW starting Group. (See the “Before” & “After” sample) - Fill in the Upper Boundaries for each Group/Class
Fill in the Upper Boundaries for each CLASS Provided Frequency Distribution (BEFORE) IQ Score Upper Boundaries (x) “Modified” Frequency Distribution (AFTER) Cumulative Frequency (y) IQ Score Upper Boundaries (x) Cumulative Frequency (y) 50 -69 2 30 -49 49. 5 0 70 -89 35 50 -69 2 90 -109 70 70 -89 35 110 -129 77 90 -109 70 130 -149 78 110 -129 77 130 -149 78
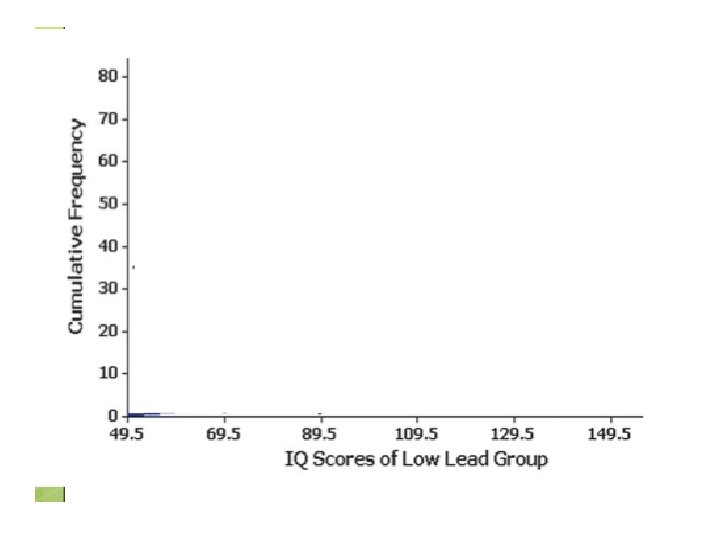
2. Plot the Upper Boundaries on the x-axis & the Cumulative Frequency on the y-axis Ex. X-axis labeled “IQ Scores of Lower Lead Group” y-axis “Cumulative Frequency”
3. Plot the data points and connect the points
Purpose of an Ogive/Cumulative Frequency Polygon • ANS: Used to visually represent how many values are below a certain Upper Class Boundary.
Ex. How many individuals have an IQ Score less than 89. 5? 1. Draw a vertical line up from 89. 5 till it intersects with the graph.
2. From the point of intersection, draw a horizontal line to the y-axis; where the line meets the number, is your answer. How many individuals have an IQ Score less than 89. 5? ANS: 40 out of 78 individuals tested have an IQ Score less than 89. 5.
Example 2. How many people have an IQ score HIGHER than 89. 5 1. Indicate the Total # of people tested ANS (A): 78 2. Indicate the Total # of people with IQ Score less than 89. 5. ANS (B): 40 3. Subtract ANS (B) from ANS (A) 78 - 40 = 38 FINAL ANS: There are 38 people with an IQ score HIGHER than 89. 5.