Cumulative Frequency Graphs Worksheet B There are 3

Cumulative Frequency Graphs – Worksheet B There are 3 forms of this worksheet: 1 – Matching (graphs could be cut out) 2 – Describing 3 - Sketching Worksheets are in 2 sizes.

Printing To print handouts from slides Select the slide from the left. Then click: File > Print > ‘Print Current Slide’ To print multiple slides Click on a section title to highlight all those slides, or press ‘Ctrl’ at the same time as selecting slides to highlight more than one. Then click: File > Print > ‘Print Selection’ To print double-sided handouts Highlight both slides before using ‘Print Selection’. Choose ‘Print on Both Sides’ and ‘Flip on Short Edge’.

How could we describe the distribution of scores for each graph? What’s the same, what’s different?

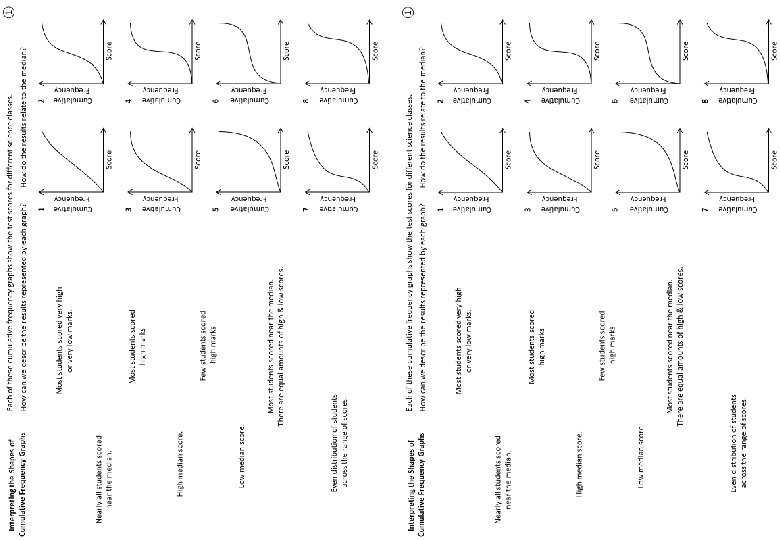
Each of these cumulative frequency graphs show the test scores for different science classes. How can we describe the results represented by each graph? How do the results relate to the median? Even distribution of students across the range of scores. 2 Cumulative Frequency 1 Most students scored near the median. There are equal amounts of high & low scores. Cumulative Frequency Interpreting the Shapes of Cumulative Frequency Graphs Score Nearly all students scored near the median. Cumulative Frequency Few students scored high marks 4 Cumulative Frequency 3 Score Most students scored very high or very low marks. Cumulative Frequency Most students scored high marks 6 Cumulative Frequency 5 Score High median score. Score Cumulative Frequency Low median score. 8 Cumulative Frequency 7 Score ① ②

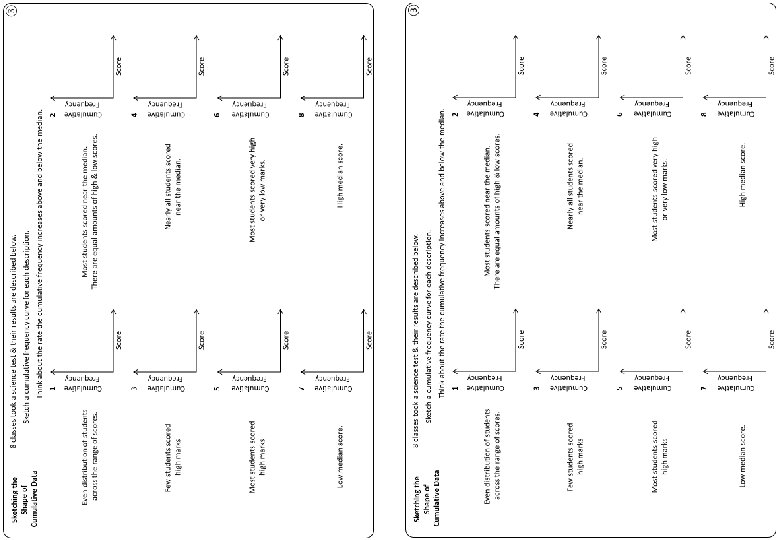
③ 8 classes took a science test & their results are described below. Sketch a cumulative frequency curve for each description. Think about the rate the cumulative frequency increases above and below the median. Even distribution of students across the range of scores. 2 Cumulative Frequency 1 Most students scored near the median. There are equal amounts of high & low scores. Cumulative Frequency Sketching the Shape of Cumulative Data Score Nearly all students scored near the median. Cumulative Frequency Few students scored high marks 4 Cumulative Frequency 3 Score Most students scored very high or very low marks. Cumulative Frequency Most students scored high marks 6 Cumulative Frequency 5 Score High median score. Score Cumulative Frequency Low median score. 8 Cumulative Frequency 7 Score

① Each of these cumulative frequency graphs show the test scores for different science classes. Interpreting the Shapes of Cumulative Frequency Graphs How can we describe the results represented by each graph? How do the results relate to the median? Cumulative Frequency Most students scored very high or very low marks. 2 Cumulative Frequency 1 Nearly all students scored near the median. Score Low median score. Most students scored near the median. There are equal amounts of high & low scores. Cumulative Frequency Score 5 6 Score Cumulative Frequency 8 Cumulative Frequency 7 Even distribution of students across the range of scores. Score Cumulative Frequency Few students scored high marks 4 Cumulative Frequency High median score. 3 Cumulative Frequency Most students scored high marks Score

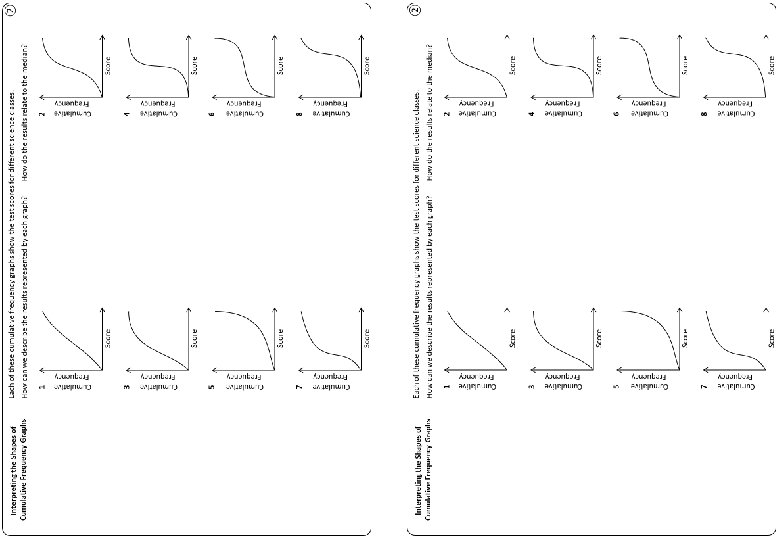
② Each of these cumulative frequency graphs show the test scores for different science classes. How can we describe the results represented by each graph? How do the results relate to the median? 2 Cumulative Frequency 1 Score 4 Cumulative Frequency 3 Score 6 Cumulative Frequency 5 Score 8 Cumulative Frequency 7 Cumulative Frequency Interpreting the Shapes of Cumulative Frequency Graphs Score

③ 8 classes took a science test & their results are described below. Sketch a cumulative frequency curve for each description. Think about the rate the cumulative frequency increases above and below the median. Even distribution of students across the range of scores. 2 Cumulative Frequency 1 Most students scored near the median. There are equal amounts of high & low scores. Cumulative Frequency Sketching the Shape of Cumulative Data Score Nearly all students scored near the median. Cumulative Frequency Few students scored high marks 4 Cumulative Frequency 3 Score Most students scored very high or very low marks. Cumulative Frequency Most students scored high marks 6 Cumulative Frequency 5 Score High median score. Score Cumulative Frequency Low median score. 8 Cumulative Frequency 7 Score

Questions? Comments? Suggestions? …or have you found a mistake!? Any feedback would be appreciated . Please feel free to email: tom@goteachmaths. co. uk
- Slides: 12