Cumulative Frequency Graphs Higher GCSE Questions These questions


- Slides: 11
Cumulative Frequency Graphs – Higher – GCSE Questions These questions are the same format as previous GCSE exams. COPY means they use the exact same numbers as the original GCSE question. Otherwise, they are clone questions using different numbers. The worksheets are provided in a variety of sizes.
Printing To print handouts from slides Select the slide from the left. Then click: File > Print > ‘Print Current Slide’ To print multiple slides Click on a section title to highlight all those slides, or press ‘Ctrl’ at the same time as selecting slides to highlight more than one. Then click: File > Print > ‘Print Selection’ To print double-sided handouts Highlight both slides before using ‘Print Selection’. Choose ‘Print on Both Sides’ and ‘Flip on Short Edge’.
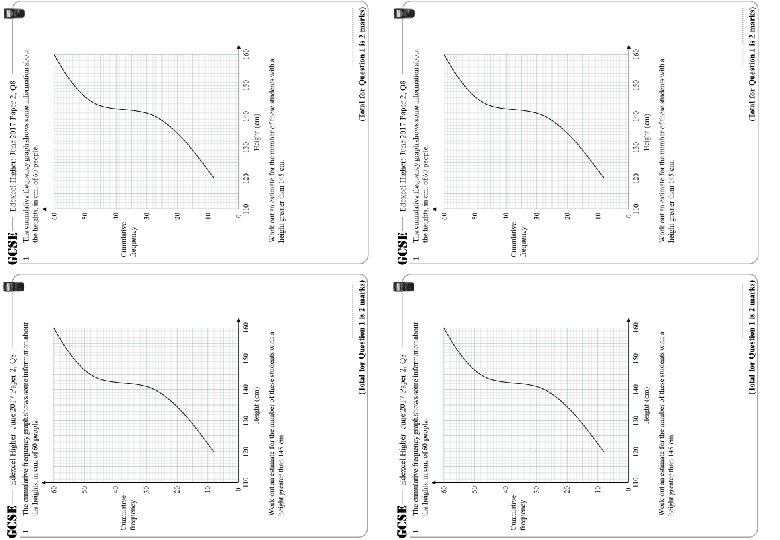
GCSE 1 GCSE Edexcel Higher: June 2017 Paper 2, Q 8 The cumulative frequency graph shows some information about the heights, in cm, of 60 people. Cumulative frequency 1 Edexcel Higher: June 2017 Paper 2, Q 8 The cumulative frequency graph shows some information about the heights, in cm, of 60 people. 60 60 50 50 40 Cumulative frequency 40 30 30 20 20 10 10 0 110 120 130 140 Height (cm) 150 160 Work out an estimate for the number of these students with a height greater than 145 cm. (Total for Question 1 is 2 marks)
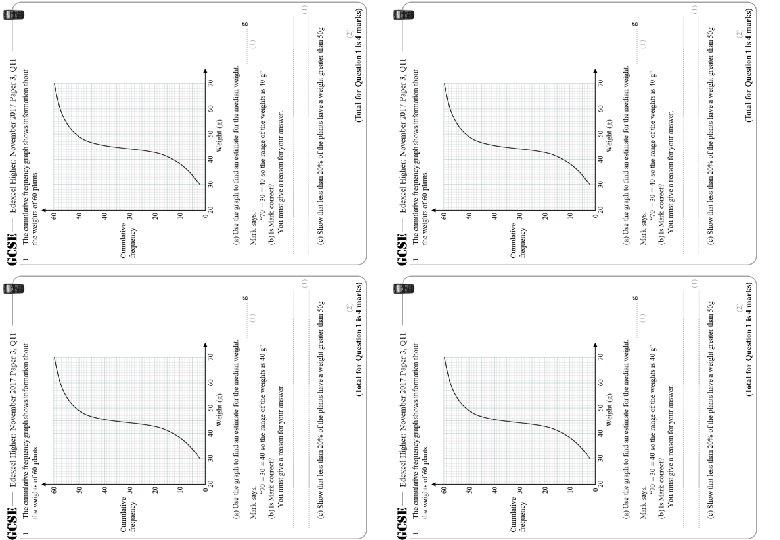
GCSE 1 GCSE Edexcel Higher: November 2017 Paper 3, Q 11 The cumulative frequency graph shows information about the weights of 60 plants. 1 Edexcel Higher: November 2017 Paper 3, Q 11 The cumulative frequency graph shows information about the weights of 60 plants. 60 60 50 50 40 40 Cumulative frequency 30 20 20 10 10 0 20 30 40 50 60 Weight (g) 0 70 (a) Use the graph to find an estimate for the median weight. Mark says, “ 70 – 30 = 40 so the range of the weights is 40 g” (b) Is Mark correct? You must give a reason for your answer. 30 40 50 60 Weight (g) 70 (a) Use the graph to find an estimate for the median weight. (1) 20 Mark says, “ 70 – 30 = 40 so the range of the weights is 40 g” (b) Is Mark correct? You must give a reason for your answer. (1) (c) Show that less than 20% of the plants have a weight greater than 50 g (2) (Total for Question 1 is 4 marks)
GCSE 1 Edexcel Higher: June 2017 Paper 2, Q 8 The cumulative frequency graph shows some information about the heights, in cm, of 60 people. 60 50 Cumulative frequency 40 30 20 10 0 110 120 130 140 Height (cm) 150 160 Work out an estimate for the number of these students with a height greater than 145 cm. (Total for Question 1 is 2 marks)
GCSE 1 Edexcel Higher: November 2017 Paper 3, Q 11 The cumulative frequency graph shows information about the weights of 60 plants. 60 50 40 Cumulative frequency 30 20 10 0 20 30 40 50 60 Weight (g) 70 (a) Use the graph to find an estimate for the median weight. Mark says, “ 70 – 30 = 40 so the range of the weights is 40 g” (b) Is Mark correct? You must give a reason for your answer. (1) (c) Show that less than 20% of the plants have a weight greater than 50 g (2) (Total for Question 1 is 4 marks)
GCSE 1 Edexcel Higher: June 2017 Paper 2, Q 8 The cumulative frequency graph shows some information about the heights, in cm, of 60 people. 60 48 50 Cumulative frequency 40 30 20 10 0 110 120 130 140 Height (cm) 150 160 Work out an estimate for the number of these students with a height greater than 145 cm. 48 students are at or below 145 cm 60 – 48 = 12 12 (Total for Question 1 is 2 marks)
GCSE 1 Edexcel Higher: November 2017 Paper 3, Q 11 The cumulative frequency graph shows information about the weights of 60 plants. 60 51 50 40 Cumulative frequency 30 Median 20 10 0 20 30 44 40 50 g 50 60 Weight (g) 70 (a) Use the graph to find an estimate for the median weight. 44 Mark says, “ 70 – 30 = 40 so the range of the weights is 40 g” (b) Is Mark correct? You must give a reason for your answer. (1) If the data was grouped the minimum could be below 30 (1) (c) Show that less than 20% of the plants have a weight greater than 50 g 9 plants have a weight greater than 50 g 15% is less than 20% (2) (Total for Question 1 is 4 marks)
Questions? Comments? Suggestions? …or have you found a mistake!? Any feedback would be appreciated . Please feel free to email: tom@goteachmaths. co. uk