Cumulative Frequency DECILES AND PERCENTILES Calculating a range


 Calculate the median time. Draw a line from the 50% mark on")
 Calculate the interdecile range between the 1 D 1 is calculated using 120/10")
 Later in the year, the club record the times of the 120 runners")
- Slides: 10
Cumulative Frequency DECILES AND PERCENTILES
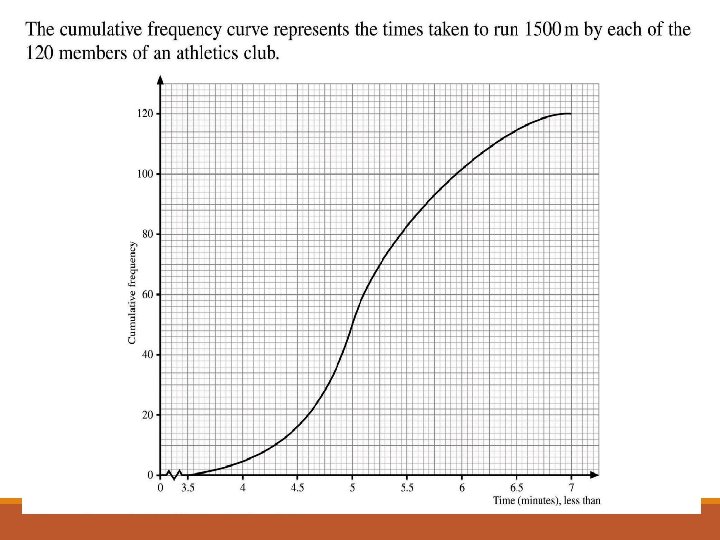
Calculating a range In Statistics there are times when using the interdecile range or interpercentile range will be a better measure of the spread of the data than using the interquartile range.
What is the interdecile range? If a quartile divides the data into 4 equal groups then a decile will divide the data into 10 equal groups. The interquartile range will always be Upper Quartile – Lower Quartile (Q 3 – Q 1 ). However with the interdecile range there will be a choice of deciles you can use. The most common would be the range between the 1 st deciles (D nd 9 – D 1 ) or between the 2 and 9 th and 8 th
What is the interpercentile range? Percentiles divide the data into 100 equal groups. The most commonly used interpercentile range would be between the 5 and the 95 th such as the 2 (P 98 – P 2 ). (P 95 – P 5 ) but others can be used nd and 98 th th
What are the benefits? The range uses all of the data but can be affected by outliers. The interquartile range uses only the middle 50% of the data so also leaves out 50% of the data. The interdecile/percentile range can give a range which includes the majority of the data but excludes outliers. For example the interdecile range D 9 – D 1 uses 80% of the data and should exclude outliers at either extreme.
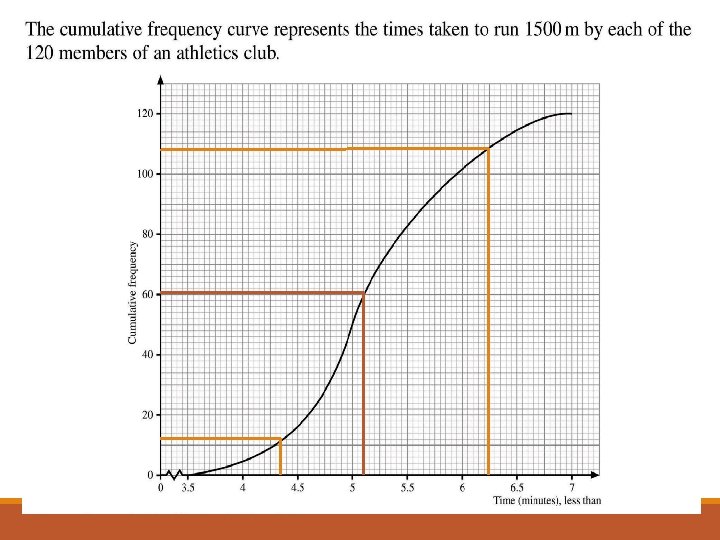
a ) Calculate the median time. Draw a line from the 50% mark on the y-axis which corresponds to 60. This gives a median of 5. 1 minutes
b) Calculate the interdecile range between the 1 D 1 is calculated using 120/10 = 12 on the y-axis D 9 is calculated using 12 x 9 = 108 on the y-axis Drawing lines from 12 and 108 gives: D 1 = 4. 35 D 9 = 6. 25 The D 9 – D 1 decile range = 6. 25 – 4. 35 = 1. 9 minutes See next slide for graph st and 9 th deciles.
c) Later in the year, the club record the times of the 120 runners again. The median is recorded as 4. 9 minutes and the range between the 1 st and 9 th deciles is 2. 2 minutes. Compare the runner’s times from the two different times during the year. As the median has decreased the average times of the runners has improved. The increase in the interdecile range tells us that the middle 90% of the runner’s time are more spread out. This would suggest that many of the runners times have improved but some have stayed the same or become slower.