Cultural Consensus Analysis Bill Dressler Kathy Oths Society

Cultural Consensus Analysis Bill Dressler & Kathy Oths Society for Psychological Anthropology 2017
 Workshop Review basics of the model n Quick overview")
Basic Outline of (very brief) Workshop Review basics of the model n Quick overview of techniques n Studying variation n Cultural consonance n

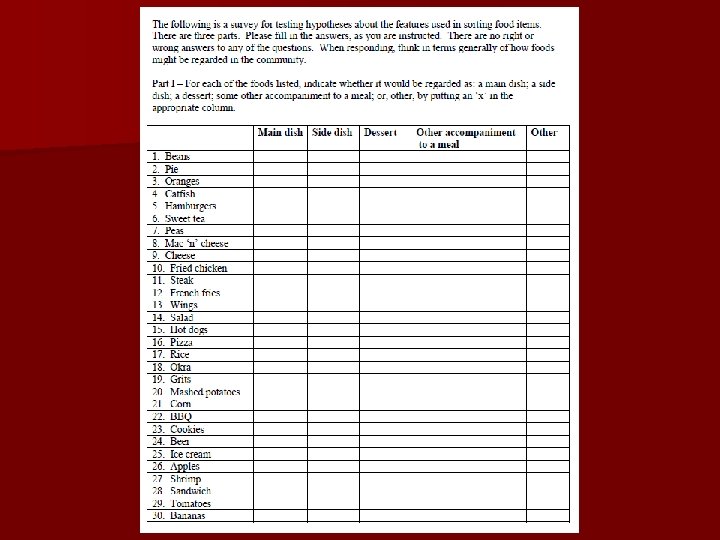
Steps in Studying Cultural Models Determine cultural domain to be studied Identify salient elements of the domain Free lists Open-ended interviews Explore the structure of the domain Pile sorts, ratings, rankings Narrative analysis Test for Cultural Consensus Explore distribution of cultural knowledge and content of shared understanding

Point to remember…. Cultural consensus analysis is not the beginning n Rather, it is the culmination of ethnographic work, usually supplemented by various forms of structured ethnographic techniques n CCA then enables you to: n – Verify that knowledge is shared within a domain – Explore and better understand the configuration of the cultural model(s)

Review of the Basics of the Model
 Responses of Individuals R 1")
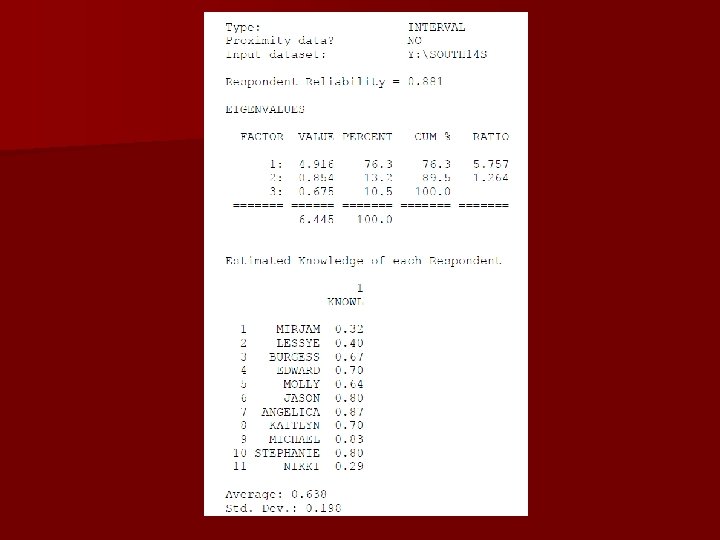
The Cultural Consensus Model (Romney, Weller and Batchelder 1986) Responses of Individuals R 1 R 2 R 3 R 4 R 5 R 6. . Rn Determine R’s relative degree of shared knowledge Degree of sharing of knowledge Calculate a consensus set of responses, weighted by pattern of knowledge sharing

2 -dimensional array of food similarities/differences: 2010 - 2014

Meals

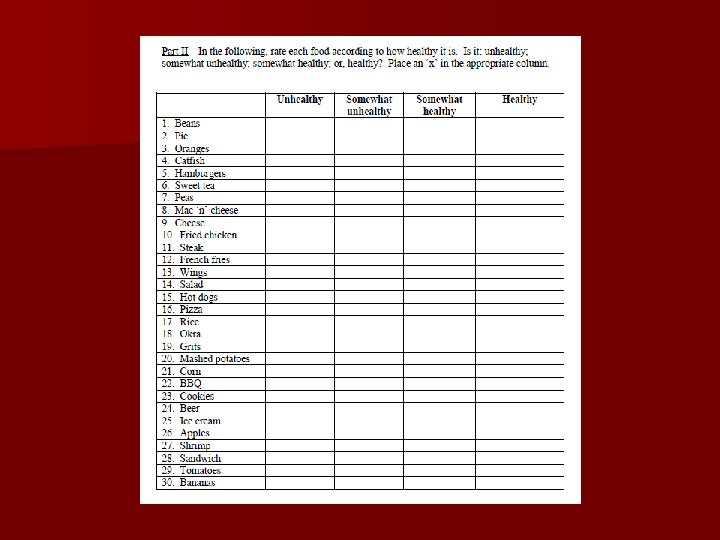
Health
![Individual representation = [cultural model] + [personal model] What are the features that distinguish](http://slidetodoc.com/presentation_image_h/96449e6b60bc92c5d960ef32bec3ea95/image-13.jpg "Individual representation = [cultural model] + [personal model] What are the features that distinguish")
Individual representation = [cultural model] + [personal model] What are the features that distinguish among the elements of the model? Is there a shared understanding of these features?

Pure personal biography: Adriane – individual experiences with food . 83 Adriane. 83 Greg Greg – individual experiences with food Why? Shared cultural model: Adriane knowledge 1 Cultural Model of Food . 83 Greg knowledge 2 Individual correlation = knowledge 1 x knowledge 2

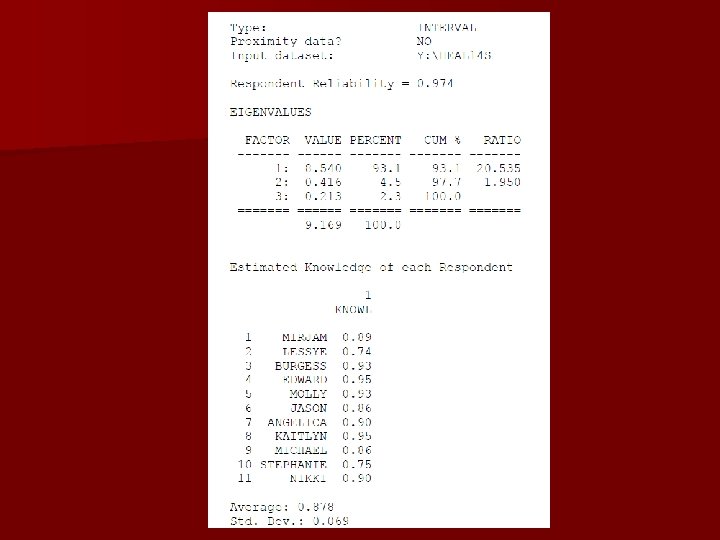
Patterns of agreement: Meals Ratio indicates overall consensus, if > 3. 0 Cultural competence coefficients indicate how well your answers reflect group-level answers Average cultural competence indicates the strength of the cultural consensus

Kim. 95 Robin. 98. 93 Adriane . 98 Cultural model of how to construct a meal . 93 . 92. 90 Bryanna Kelso Diedre Alec . 76. 78. 89 Heidi Joshua Greg

Consensus ratings of foods

Consensus ratings = a ‘cultural best estimate’ How would a reasonably culturally competent member of this social group rate or classify these foods?

Fitting attributes to the array How do we know if people are using features to define semantic structures? n Correlate the features with the distance between the points in the map of the pile sort n If the correlation is high (>. 75), then probably people were using those features to sort the terms n

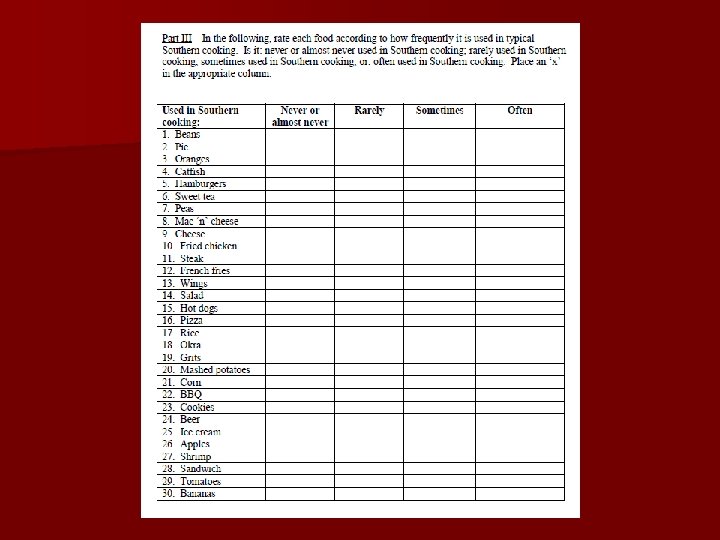
? Food TEA MASHP STEAK BURGERS SANWICH HOTDOG CORN CATFISH CHEESE APPLE FF COOKIE FCHICK RICE WING BEER ICREAM ORANGE SALAD PIE SHRIMP GRITS MNCHEES BEANS PEAS BBQ PIZZA BANANA OKRA TOMATO Meal 4. 00 2. 00 1. 00 4. 00 5. 00 2. 00 3. 00 1. 00 2. 00 1. 00 4. 00 3. 00 5. 00 2. 00 3. 00 1. 00 2. 00 1. 00 5. 00 2. 00 4. 00 Health 1. 76 2. 64 2. 71 1. 77 2. 76 1. 49 3. 48 3. 06 2. 71 3. 93 1. 21 1. 06 1. 31 3. 16 1. 49 1. 51 1. 17 4. 00 3. 76 1. 27 3. 58 2. 64 1. 85 3. 68 3. 79 1. 87 1. 65 3. 82 3. 78 3. 82 Southern 4. 00 3. 86 3. 47 3. 31 2. 66 2. 38 3. 84 3. 76 3. 56 2. 58 2. 94 2. 69 3. 97 3. 08 2. 78 3. 25 2. 85 1. 80 2. 63 3. 88 3. 23 4. 00 3. 67 3. 63 3. 32 3. 90 2. 06 2. 03 3. 87 3. 46

Fitting the attributes § Meal correlation =. 91 § Health correlation =. 91 § Southern correlation =. 20

2 -dimensional array of food similarities/differences: 2010 + 2011 Where does it go on my plate? Is it healthy?

Quick Overview of Techniques

Doing Cultural Consensus Analysis n In Anthropac – The formal process model – The informal data model n In a standard statistical package: SPSS – Formal process model (MTTIW) – Informal data model

Studying Variation
 Macarão (pasta)")
Classic Brazilian Food n n n n Feijão/Feijoada Rice Churrasco Cerveja (beer) Macarão (pasta) Hearts of palm Pintado (catfish) Doces (sweets) n n n n Sucos/vitaminas Almoço (lunch) Launches Salgadinhos/picados Comida mineiro Comida baiano Comida carioca Comida gaúcho
")
The Prestige Value of Food in Urban Brazil (Oths, Carolo, & dos Santos 2003) Sample Eigenvalue ratio Mean (± sd) Total sample 1. 8: 1 . 40 (±. 35) Upper-middle class 10: 1 . 69 (±. 06) Middle class Single factor . 54 (±. 04) Lower middle class Single factor . 81 (±. 03) Lower class 1. 8: 1 . 50 (±. 28)
")
Testing variation with separate model estimates within groups (Oths, Carolo, & dos Santos 2003)

Cultural Modeling - The Domain of Family Life “Violence/addiction” “Lack of education” Importance for having a family “Family organization” “Affective climate”

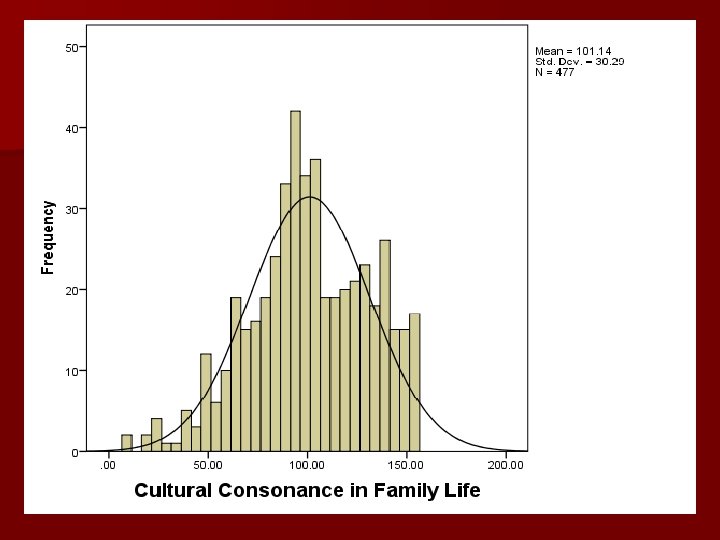
Distribution of Cultural Competence in Family Life – urban Brazil Eigenvalue ratio = 8. 49
")
Recommended cut-off points for the S. D. of cultural competence (Hruschka and Maupin 2013)

Relationship of years in Nairobi and cultural competence in the cultural model of HIV+ management (Copeland 2011) 0. 9 Cultural OMPETENCE 0. 85 0. 8 0. 75 0. 7 0. 65 0. 6 0. 55 0. 45 0. 4 < 5 yrs 5 -9 yrs Years in Nairobi 10 -19 yrs > 19 yrs
")
Cultural competence in family life and psychological distress in urban Brazil (n = 52) Age Sex Socioeconomic status Cultural competence in family life Cultural consonance in family life Multiple R Step 1 -. 073 -. 163 -. 343* Step 2 -. 033 -. 161 -. 288* Step 3 . 035 -. 056 -. 252* - -. 282* -. 197* - - -. 461* . 378* . 467* . 635*

Residual Agreement Concept introduced by Boster in 1986 n Refers to agreement among respondents beyond an overall cultural consensus n “Multicentric domain” n – Defined by Caulkins and Hyatt – Multicentric domains have multiple centers of agreement: § Subcultural domains, in which there are two or more centers of agreement that are different but not oppositional § Contested domains, in which some individuals take a perspective opposite to that expressed by others in the same population
 original approach n n n Works from the agreement matrix Run consensus")
Boster’s (1986) original approach n n n Works from the agreement matrix Run consensus analysis and then generate the predicted agreement Subtract the predicted agreement matrix from the observed agreement matrix to generate a residual agreement matrix Use QAP (quadratic assignment procedure) to test for correlation of the observed and residual agreement matrices If matrices are correlated, then there is residual agreement not exhausted by the consensus
 n n This can be thought of as an")
Boster’s original approach (cont. ) n n This can be thought of as an “omnibus” test of residual agreement Just tells you it’s there Not what it is Utility of this test may not be great, especially if there is always going to be some kind of residual agreement—a reasonable assumption

Norbert Ross & Doug Medin n In essence, they use the same approach as Boster to test for residual agreement – They calculate residual matrices within groups and compare them Then, they identify which items from the consensus analysis differ between groups n This actually confounds overall cultural consensus with whatever differences exist n
 n n First, they confirm that there is an overall")
Hruschka, et al. (2008) n n First, they confirm that there is an overall cultural consensus Second, using three different techniques, they demonstrate that there are different patterns of response within groups Third, they compare cultural answer keys calculated within groups Does not account for overall cultural consensus
 Use the second factor n This captures agreement left over")
Boster and Johnson (1989) Use the second factor n This captures agreement left over after the overall consensus has been accounted for n Plotting respondents by cultural competence coefficients and second factor loadings—or “residual agreement coefficients”—shows the shape of divergence from the overall consensus n
 Eigenvalue ratio =")
Distribution of cases by cultural competence and residual agreement (Second Factor) Eigenvalue ratio = 6. 7 Mean competence = 0. 70 s. d. = 0. 11 (First Factor)

Distribution of cases by cultural competence and residual agreement Blue = 2001 Red = 2011 p <. 001 for residual agreement
 OVERALL CULTURAL CONSENSUS Shared deviation from consensus within")
Residual agreement (Dressler et al. 2015) OVERALL CULTURAL CONSENSUS Shared deviation from consensus within subgroup 1 “Residual agreement” Shared deviation from consensus within subgroup 2

Calculating deviation from the overall cultural consensus Dev 1 = individual rating of item 1 – consensus rating of item 1 Dev 2 = individual rating of item 2 – consensus rating of item 2 …. . Dev. N = individual rating of item N – consensus rating of item N Deviations averaged over individuals in subgroup 1 Deviations averaged over individuals in subgroup 2

compute d 1 = ls 1 - 3. 07. compute d 2 = ls 2 - 3. 23. compute d 3 = ls 3 - 1. 64. compute d 4 = ls 4 - 3. 02. compute d 5 = ls 5 - 3. 9. compute d 6 = ls 6 - 2. 6. compute d 7 = ls 7 - 3. 30. compute d 8 = ls 8 - 3. 92. compute d 9 = ls 9 - 2. 06. compute d 10 = ls 10 - 3. 11. compute d 11 = ls 11 - 3. 84. compute d 12 = ls 12 - 3. 6. compute d 13 = ls 13 - 2. 96. compute d 14 = ls 14 - 2. 57. compute d 15 = ls 15 - 3. 3. compute d 16 = ls 16 - 3. 82. compute d 17 = ls 17 - 2. 38. compute d 18 = ls 18 - 2. 78. compute d 19 = ls 19 - 2. 04. compute d 20 = ls 20 - 3. 34. compute d 21 = ls 21 - 1. 91. compute d 22 = ls 22 - 3. 88. compute d 23 = ls 23 - 2. 14. compute d 24 = ls 24 - 3. 77. compute d 25 = ls 25 - 2. 84. compute d 26 = ls 26 - 3. 65. compute d 27 = ls 27 - 2. 6. compute d 28 = ls 28 - 2. 56. compute d 29 = ls 29 - 2. 45. compute d 30 = ls 30 - 3. 65. compute d 31 = ls 31 - 3. 66. compute d 32 = ls 32 - 2. 73.

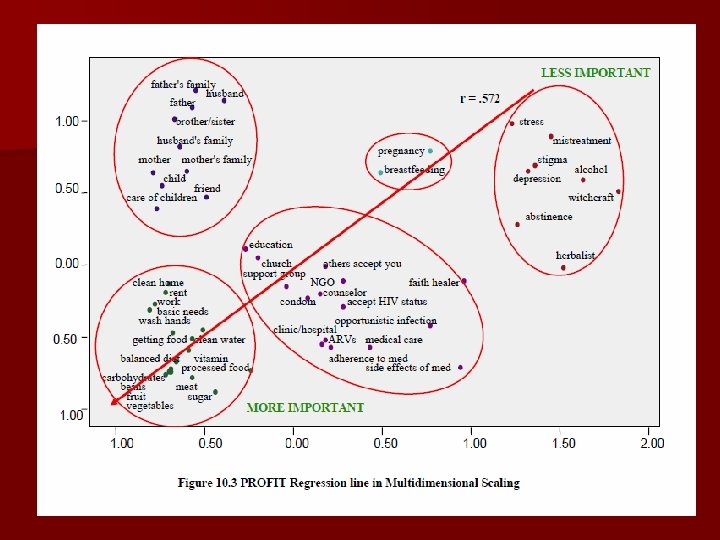
Results of the analysis of residual agreement < Items rated more > important in 2001 Items rated more important in 2011

Items rated more important in 2011 Items rated more important in 2001 Respondents in 2011 rated as more important than the overall consensus items associated with information technologies, especially cell phones and internet access Respondents in 2001 rated as more important than the overall consensus items associated with traditional Brazilian sociality, especially spending time in venues associated with social interaction

Cultural Consonance

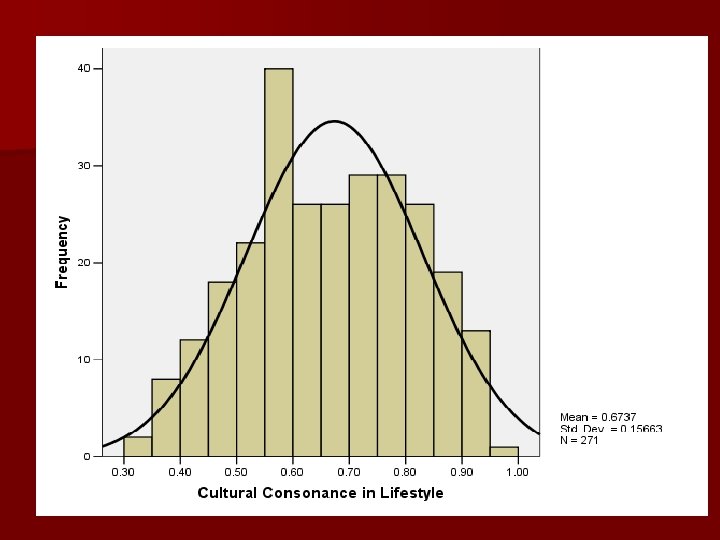
Cultural models Cultural consonance is the degree to which individuals approximate, Cultural consonance in their own beliefs and behaviors, the prototypes for belief and behavior encoded in shared cultural models Health outcomes

Less important More important

Calculating Cultural Consonance in Lifestyle Responses of Respondent 10042 1. No 0 2. Yes 1 3. No 0 4. No 0 5. Yes 1 6. No 0 7. No 0 8. Yes 1 9. Yes 1 10. Yes 1 11. Yes 1 12. Yes 1 13. Yes 1 14. No 0 15. No 0 16. No 0 17. Yes 1 18. No 0 Total = 9 9/18=. 50

‘Violence’ ‘Education’ ‘A good family’ ‘’Organization’ Pile sort - 2001 ‘Affect’ ‘Violence’ ‘Education’ ‘A good family’ Pile sort - 2011 ’Organization’ ‘Affect’
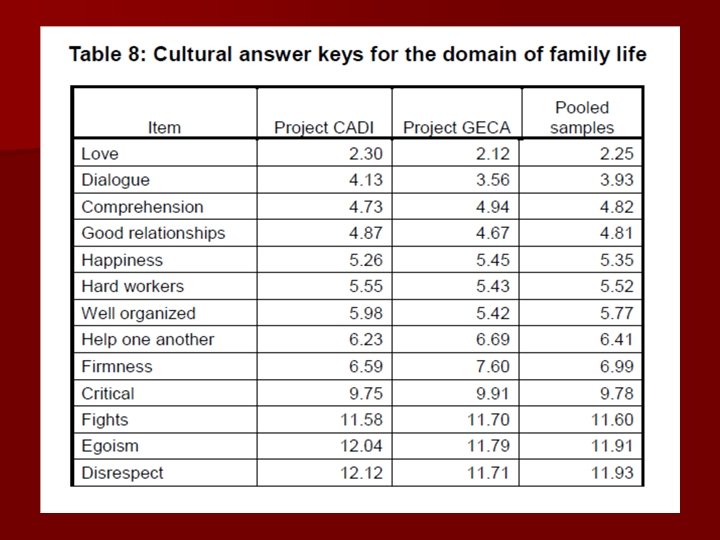

Constructing and scaling survey items to measure cultural consonance in family life Each of core concepts from cultural domain 18 Likert-response items gauging the respondent’s appraisal of her own family Group discussion of possible survey research items within research staff Scale scores = sum of responses weighted by the importance of the concept from cultural consensus analysis

Cronbach’s alpha =. 87

Description of Brazilian families using free listing and focus groups Exploration of dimensions of meaning using pile sorts and focus groups Confirmation of consensus around principal dimension of value A straight line from natural speech acts to measurement = emic validity Development of scale of cultural consonance based on consensus meaning of terms

r = -. 65 Cultural consonance in life goals

The End
- Slides: 64