
CTE Outcomes Survey Rock Pfotenhauer CompleterLeaver Survey What
- Slides: 25
CTE Outcomes Survey Rock Pfotenhauer
Completer/Leaver Survey • What – Survey – How we administer it – Results • So what – How we use it – Would it be of value to you? • Now what – Can we use our scale to do this more effectively, efficiently and achieve greater impact?
Survey How we administer it Results WHAT
COMPLETER/LEAVER SURVEY
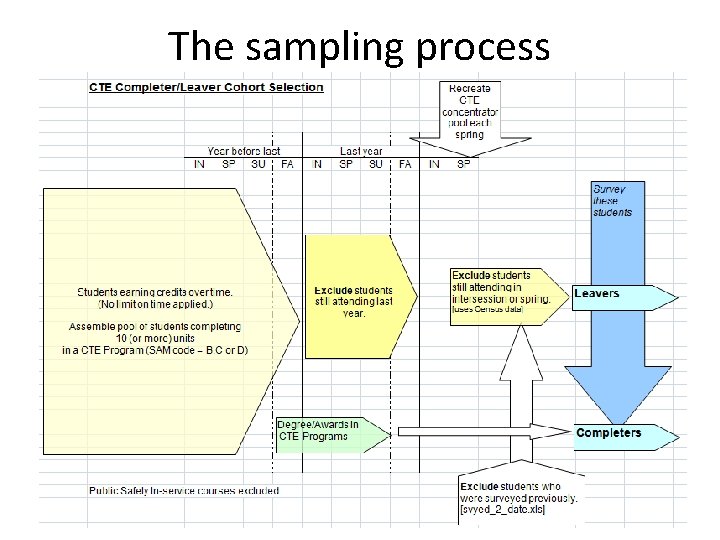
The sampling process
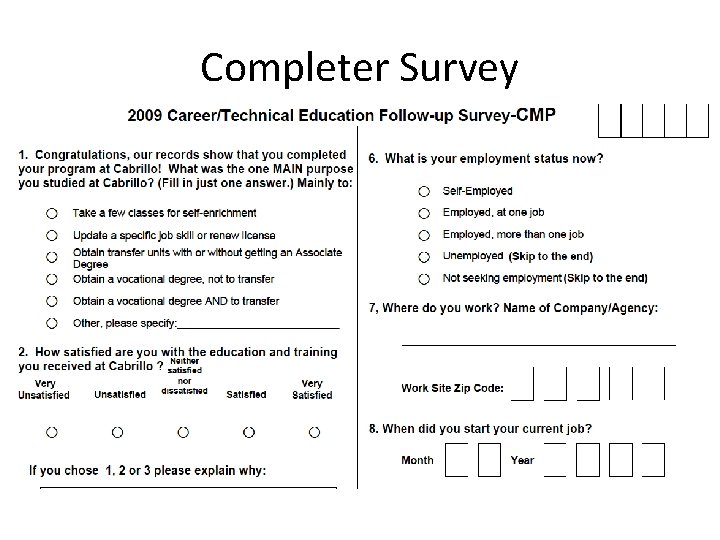
Completer Survey
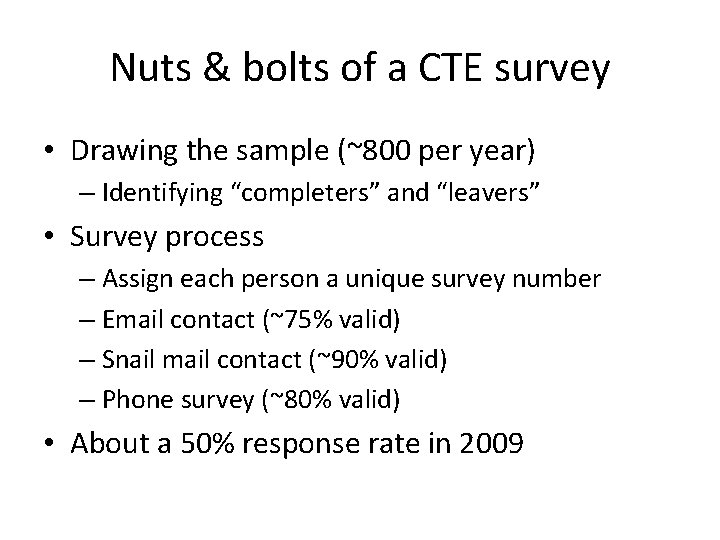
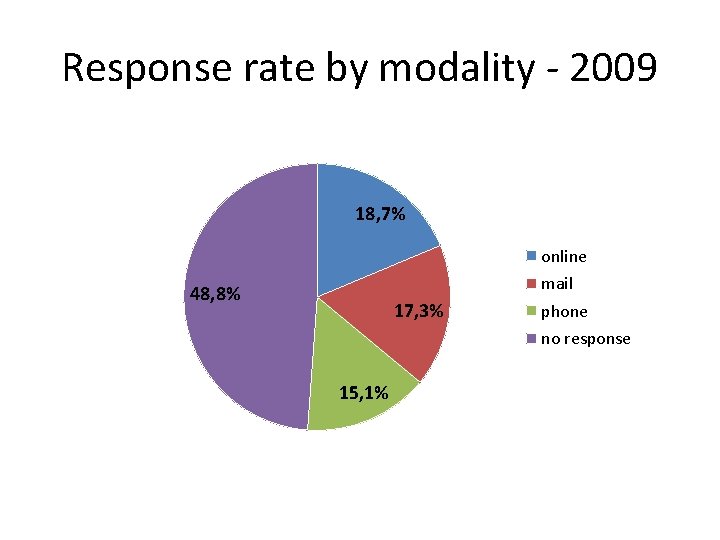
Nuts & bolts of a CTE survey • Drawing the sample (~800 per year) – Identifying “completers” and “leavers” • Survey process – Assign each person a unique survey number – Email contact (~75% valid) – Snail mail contact (~90% valid) – Phone survey (~80% valid) • About a 50% response rate in 2009
Response rate by modality - 2009 18, 7% online mail 48, 8% 17, 3% phone no response 15, 1%
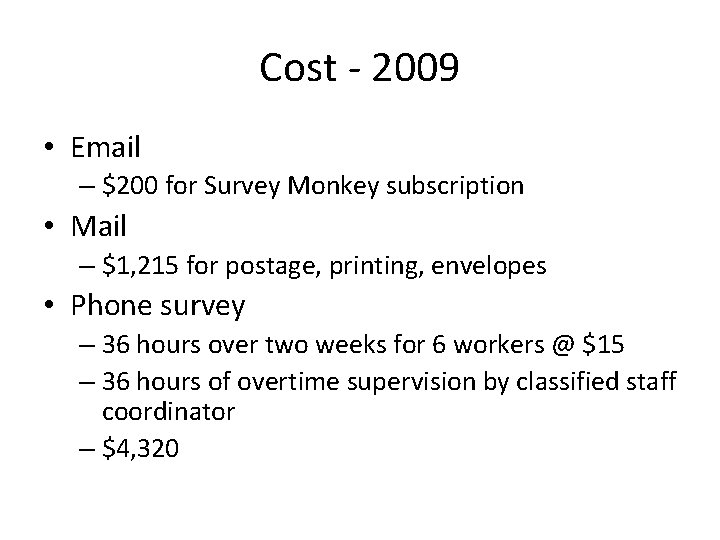
Cost - 2009 • Email – $200 for Survey Monkey subscription • Mail – $1, 215 for postage, printing, envelopes • Phone survey – 36 hours over two weeks for 6 workers @ $15 – 36 hours of overtime supervision by classified staff coordinator – $4, 320
Program improvement Pathway improvement Program right sizing, reduction SO WHAT
Reports distributed to CTE programs
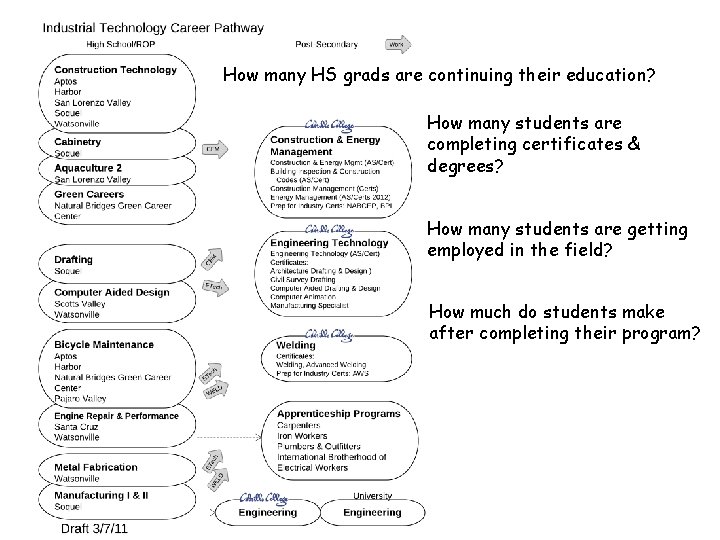
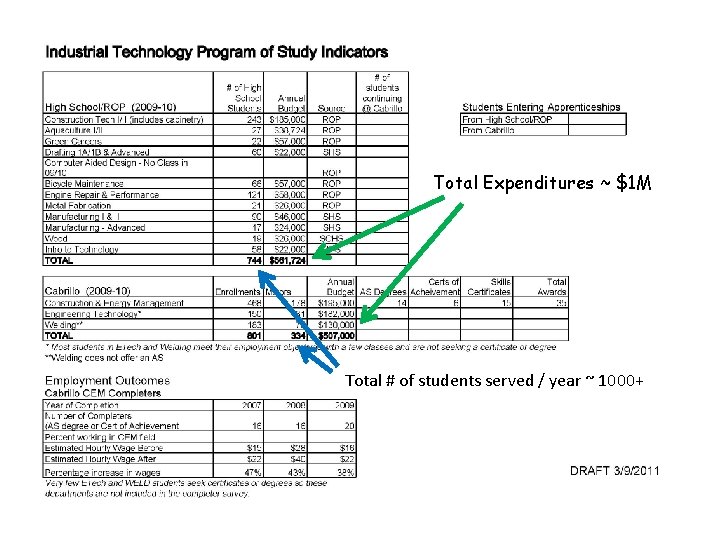
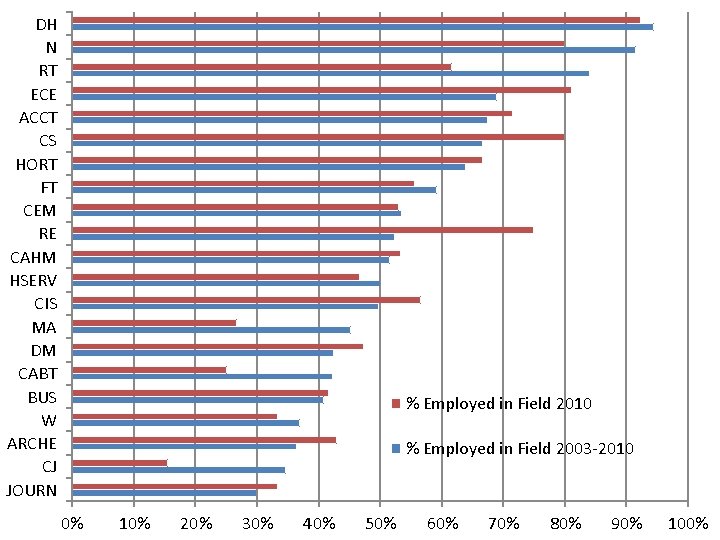
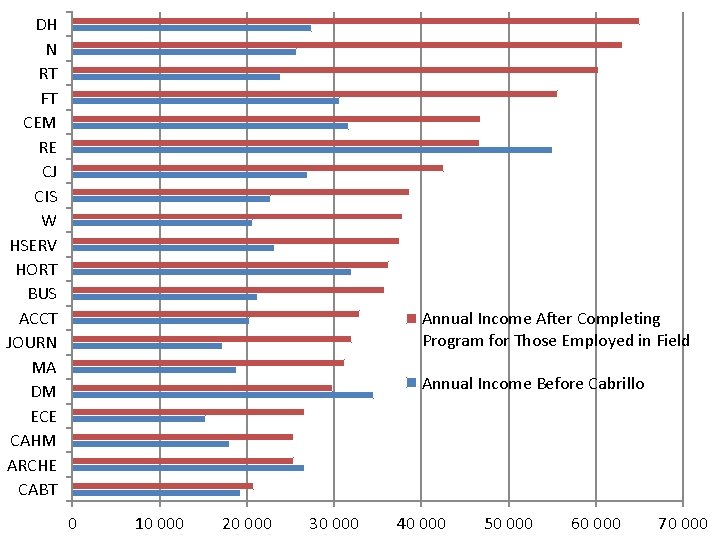
How many HS grads are continuing their education? How many students are completing certificates & degrees? How many students are getting employed in the field? How much do students make after completing their program?
Total Expenditures ~ $1 M Total # of students served / year ~ 1000+
DH N RT ECE ACCT CS HORT FT CEM RE CAHM HSERV CIS MA DM CABT BUS W ARCHE CJ JOURN % Employed in Field 2010 % Employed in Field 2003 -2010 0% 10% 20% 30% 40% 50% 60% 70% 80% 90% 100%
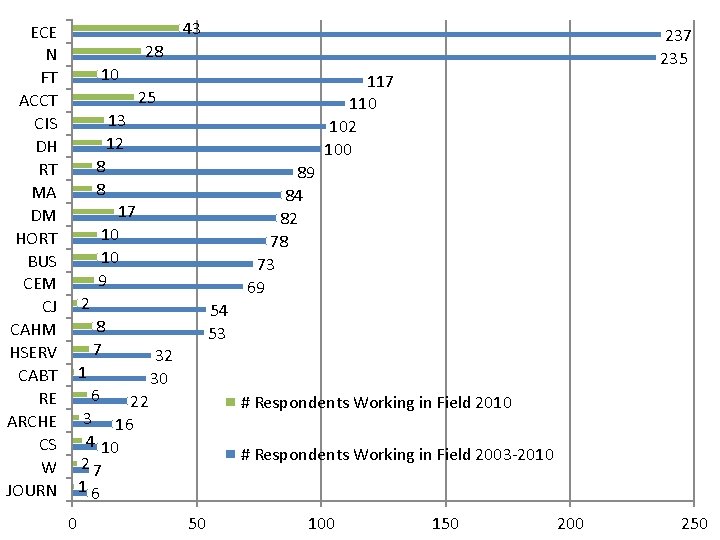
43 ECE N FT ACCT CIS DH RT MA DM HORT BUS CEM CJ CAHM HSERV CABT RE ARCHE CS W JOURN 237 235 28 10 117 110 102 100 25 13 12 8 8 89 84 82 78 73 69 17 10 10 9 2 8 7 1 6 22 3 16 4 10 27 16 0 54 53 32 30 # Respondents Working in Field 2010 # Respondents Working in Field 2003 -2010 50 100 150 200 250
DH N RT FT CEM RE CJ CIS W HSERV HORT BUS ACCT JOURN MA DM ECE CAHM ARCHE CABT Annual Income After Completing Program for Those Employed in Field Annual Income Before Cabrillo 0 10 000 20 000 30 000 40 000 50 000 60 000 70 000
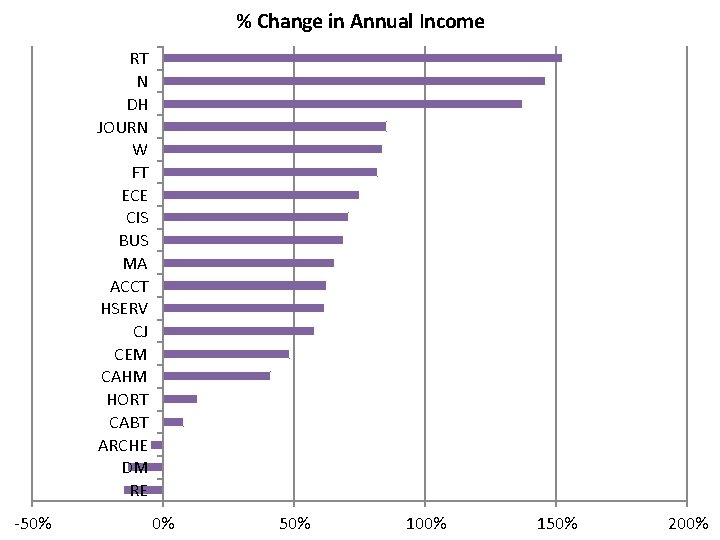
% Change in Annual Income RT N DH JOURN W FT ECE CIS BUS MA ACCT HSERV CJ CEM CAHM HORT CABT ARCHE DM RE -50% 0% 50% 100% 150% 200%
Areas for Improvement CTE Employment Outcomes Project CCC-EDD-WIB LMI Conversation NOW WHAT?
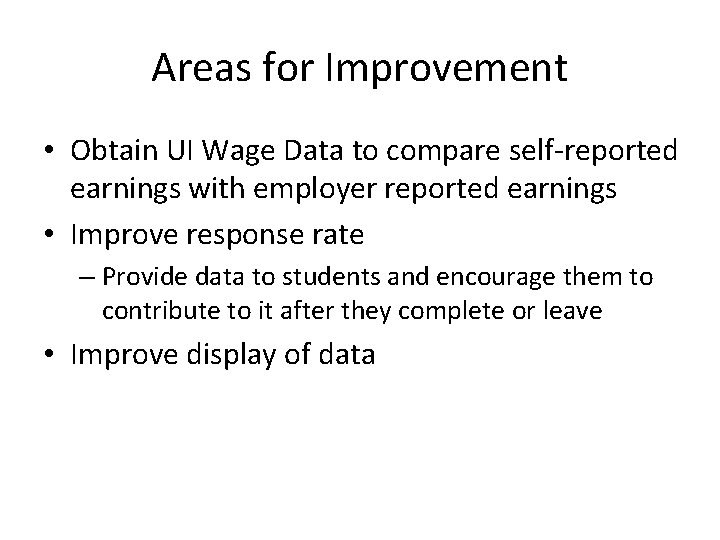
Areas for Improvement • Obtain UI Wage Data to compare self-reported earnings with employer reported earnings • Improve response rate – Provide data to students and encourage them to contribute to it after they complete or leave • Improve display of data
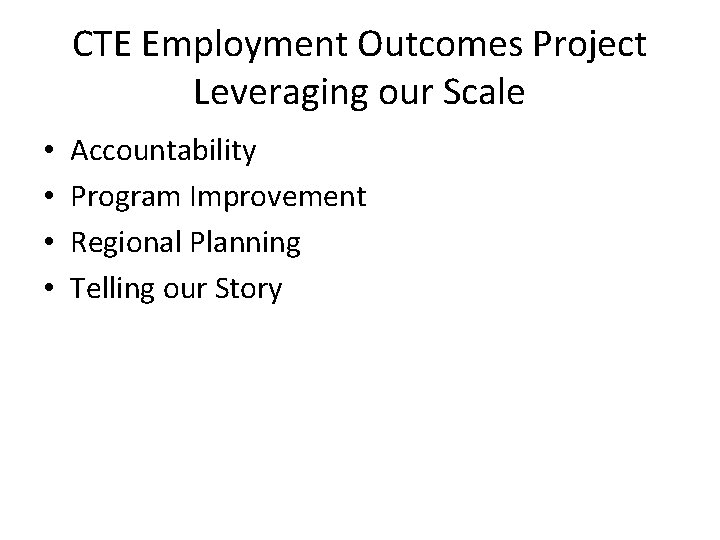
CTE Employment Outcomes Project Leveraging our Scale • • Accountability Program Improvement Regional Planning Telling our Story
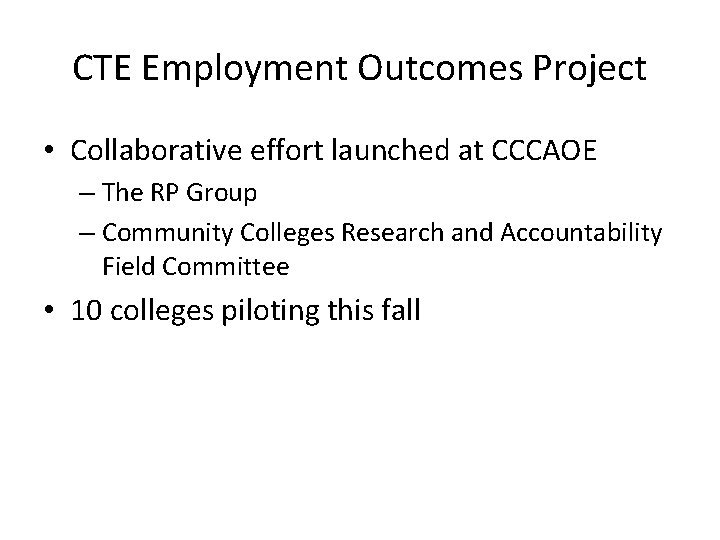
CTE Employment Outcomes Project • Collaborative effort launched at CCCAOE – The RP Group – Community Colleges Research and Accountability Field Committee • 10 colleges piloting this fall
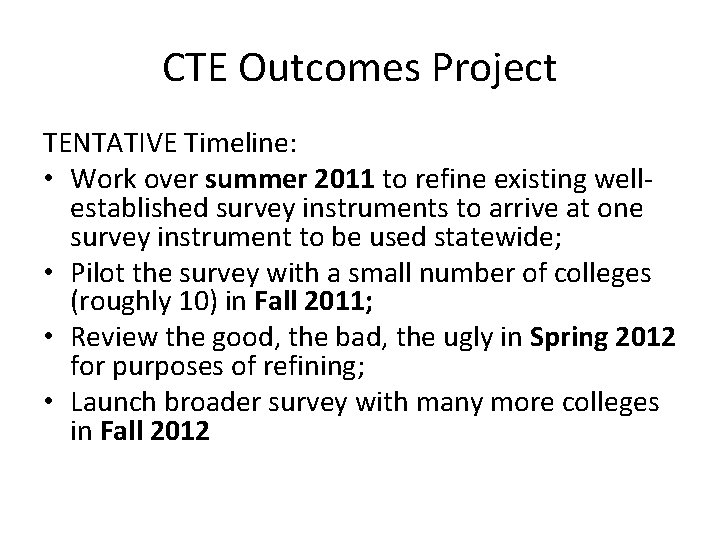
CTE Outcomes Project TENTATIVE Timeline: • Work over summer 2011 to refine existing wellestablished survey instruments to arrive at one survey instrument to be used statewide; • Pilot the survey with a small number of colleges (roughly 10) in Fall 2011; • Review the good, the bad, the ugly in Spring 2012 for purposes of refining; • Launch broader survey with many more colleges in Fall 2012
REGIONAL & STATEWIDE COLLABORATION ON LMI
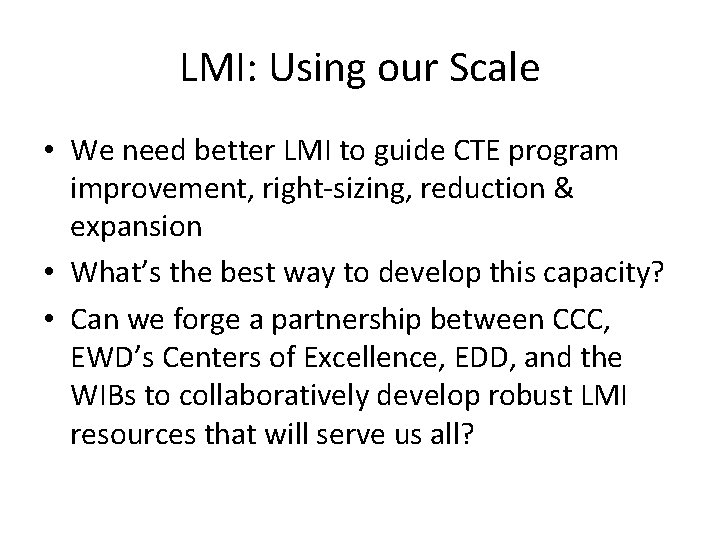
LMI: Using our Scale • We need better LMI to guide CTE program improvement, right-sizing, reduction & expansion • What’s the best way to develop this capacity? • Can we forge a partnership between CCC, EWD’s Centers of Excellence, EDD, and the WIBs to collaboratively develop robust LMI resources that will serve us all?
go. cabrillo. edu/ctecls