CT CT Image Quality Quality Control Spatial Resolution


 Resolution Phantom rows of equally spaced high contrast objects holes")


 slice thickness patient size")
 Take standard")
 = k. T/(td 3 R) Where")


 = k. T/(td 3 R) To hold noise")


 CT #")
 Standard")


 Accreditation Program for CT CT Accreditation Program involves acquisition")


- Slides: 48
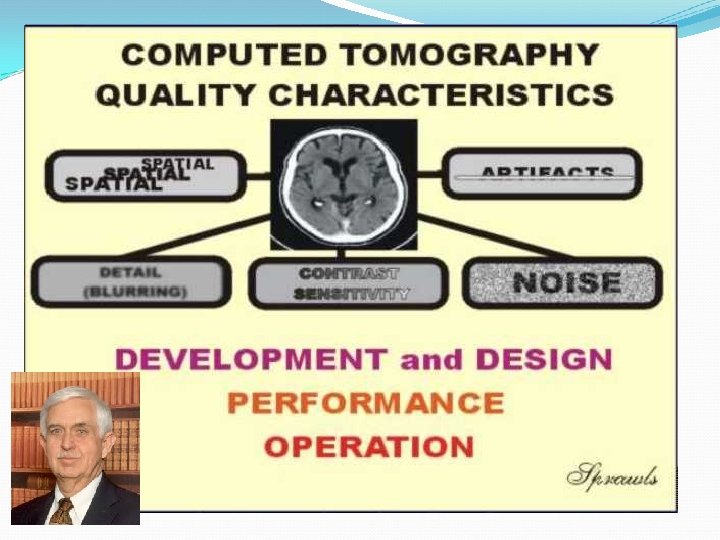
CT CT Image Quality & Quality Control
Spatial Resolution Quantifies image blurring “Ability to discriminate objects of varying density a small distance apart against a uniform background” Minimum separation required between two high contrast objects for them to be resolved as two objects
Spatial Resolution
Geometric Factors affecting Spatial Resolution focal spot - isocenter distance Finite focal spot size focal spot detector distance
Focal Spot Size & Resolution The larger the focal spot the more it will blur a tiny place on the patient.
Detector Size & Resolution The shadow of both objects falls on the same detector. Detector
Focal Spot Size & Resolution Combination of finite focal spot and object position blurs object across multiple detectors. Detectors
Resolvable Object Size & Limiting Resolution Smallest resolvable high contrast object Often expressed as line pairs / cm “Pair” is one object + one space One Pair
Resolvable Object Size: Limiting Resolution Smallest resolvable high contrast object is half the reciprocal of spatial frequency Example: Limited resolution = 15 line pairs per cm Pair is 1/15 th cm Object is half of pair 1/15 th / 2 1/30 th cm . 033 cm 0. 33 mm 1/30 th cm
Geometric Factors affecting Spatial Resolution In-slice Focal spot size detector aperture width Z-axis slice thickness or collimation Less variation likely for thinner slices attenuation variations within a voxel are averaged partial volume effect
High Contrast (or Limiting) Resolution Phantom rows of equally spaced high contrast objects holes get smaller from row to row Bars of decreasing size & separation Determine smallest row of holes where all holes can be clearly seen smaller holes = better resolution Visual scoring
Contrast Resolution Ability of an imaging system to demonstrate small changes in tissue contrast The difference in contrast necessary to resolve 2 large areas in image as separate structures
CT Contrast Resolution Significantly better than radiography CT can demonstrate very small differences in density and atomic # This’ll be on your test. I guarantee it. Radiography 10% CT <1%
CT Contrast Resolution Depends Upon Dose reconstruction algorithm low spatial frequency algorithm smooths image Loss of spatial resolution Reduces noise enhances perceptibility of low contrast lesions image display
CT Contrast Resolution Depends on Noise
CT Contrast Resolution Contrast depends on noise Noise depends on # photons detected depends on …
# of Photons Detected Depends Upon photon flux (x-ray technique) slice thickness patient size Detector efficiency Note: Good contrast resolution requires that detector sensitivity be capable of discriminating small differences in intensity
Noise Measurement in CT Scan water phantom Select regions of interest (ROI) Take standard deviation in each region Standard deviation measures noise in ROI
CT Image Quality in Equation Form s 2(m) = k. T/(td 3 R) Where s is variance resulting from noise k is a conversion factor (constant) T is transmissivity (inverse of attenuation) t is slice thickness d is pixel size R is dose
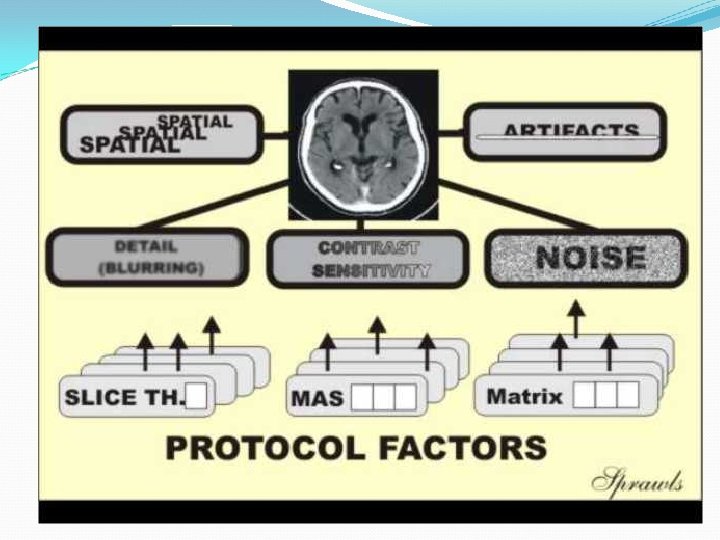
Slice Thickness Thinner slices mean less active detector area less photons detected More noise To achieve equivalent noise with thinner slices, dose (technique factors) must be increased
Noise Levels in CT: Increasing slice width = less noise BUT Increasing slice width degrades spatial resolution less uniformity inside a larger pixel partial volume effect
CT Artifacts: Partial Volume Effect CT #’s based on linear attenuation coefficient for tissue voxels If voxel non-uniform (contains several materials), detection process will average
Partial Volume Effect ¨ Can appear as ¨ incorrect densities ¨ streaks ¨ bands ¨ Minimizing ¨ Use thinner slices
Noise Levels in CT: When dose increases, noise decreases dose increases # detected photons Doubling spatial resolution (2 X lp/mm) requires an 8 X increase in dose for equivalent noise Smaller voxels mean less radiation per voxel
CT Image Quality Trade-off s 2(m) = k. T/(td 3 R) To hold noise constant u If slice thickness goes down by 2 u. Dose must go up by 2
Contrast Response Function CTF or CRF Blurring causes loss of contrast darks get lighter lights get darker Lower Frequency Higher Contrast Lower Contrast
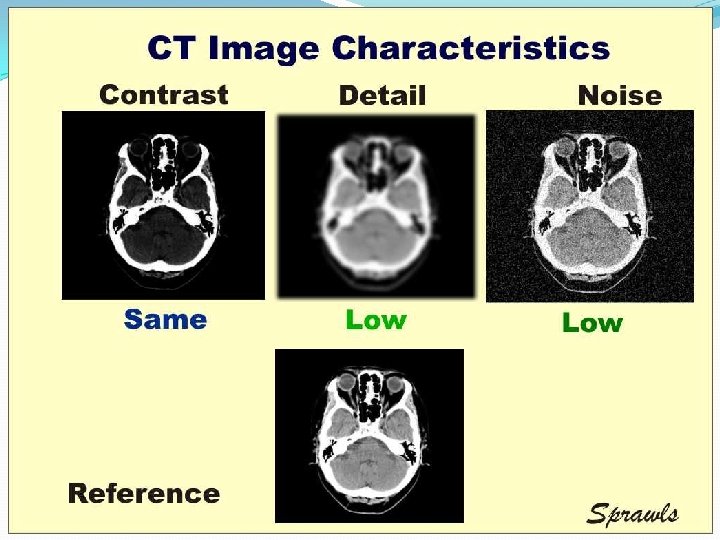
CT Spatial vs. Contrast Resolution Spatial & contrast resolution interact High contrast objects are easier to resolve Improve one at the expense of the other Can only improve both by increasing dose Increasing object size Increasing contrast
Contrast & Detail Larger objects easy to see even at low contrast Increasing object size Increasing contrast
Contrast & Detail Small objects only visible at high contrast Increasing object size Increasing contrast
CT Number Calculated from reconstructed pixel attenuation coefficient (mt - m. W) CT # = 1000 X ------m. W Where: ut = linear attenuation coefficient for tissue in pixel u. W = linear attenuation coefficient for water
CT # of Water What do we check? Average (ideally 0 by definition) Standard Deviation (ideally 0) Flatness ROI’s at various locations in phantom Results depend upon protocol k. Vp, m. A, scan time slice width phantom size ROI position Problem causes Mis-calibration Noise / drift in detector system
Linearity Relationship of CT #’s to object attenuation coefficients Checked with phantom of several known materials average CT # of each material obtained from ROI analysis Compare CT #’s with known coefficients -100 77 325 50 -44
Preview! CT Artifacts: Causes motion metal & high-contrast sharp edges beam hardening partial volume averaging detectors
Image Artifacts: Ring Artifact in 3 rd Generation Causes 1 or more bad detectors small offset or gain difference of 1 detector compared to neighbors detector calibration required Reason: rays measured by a given detector are all tangent to same circle
Monitor Performance / Hard Copy Output Standard gray scale image needed computer generated (SMPTE pattern) Check monitor & hard copy 5% patches Contrast patches Resolution bars Hard copy Measure optical density of steps with densitometer
Table Backlash Does table return to same position from both directions? Test Apply masking tape to table Load table with weight Note numerical position Mark tape at starting position using laser position Move table away from starting position & then back to same numerical location Check laser vs. mark on tape
Laser Accuracy Align phantom on table matching outer laser to external marks on phantom “Zero” table Scan phantom “ 0” z-location should show correct phantom position on image Repeat for internal laser
American College of Radiology (ACR) Accreditation Program for CT CT Accreditation Program involves acquisition of clinical images phantom images dose measurements submission of scanning protocols. Providers billing under part B of Medicare Physician Fee Schedule must be accredited to receive technical component reimbursement from Medicare.
ACR Phantom Positioning accuracy CT # accuracy Image thickness Low contrast resolution High contrast (spatial) resolution CT number uniformity Image noise
Phantom Section #1 Alignment CT # Linearity Slice Width
ACR Phantom Section #2 Low Contrast Resolution
ACR Phantom Section #3 Uniformity & Noise Distance Accuracy 100 mm
ACR Phantom Secion #4 High Contrast Resolution
ACR Phantom Criteria Phantom imaged with clinical protocols Measurements CTDTvol Low contrast performance Contrast Ratio to Noise Scan Protocol Pass/Fail Criteria CTDIvol (m. Gy) Reference Value CTDIvol (m. Gy) Contrast to Noise Ratio Adult Head 80 75 1. 0 Pediatric Head 40 35 0. 7 Adult 30 Abdomen 25 1. 0 Pediatric 20 Abdomen 15 0. 4