CSE 291 Personal genomics for bioinformaticians Class meetings

CSE 291: Personal genomics for bioinformaticians Class meetings: TR 3: 30 -4: 50 MCGIL 2315 Office hours: M 3: 00 -5: 00, W 4: 00 -5: 00 CSE 4216 Contact: mgymrek@ucsd. edu Today’s schedule: • 3: 30 -4: 10 Risk prediction • 4: 10 -4: 15 Break • 4: 15 -4: 50 Time to work on PS 3 Announcements: • On Tuesday discussing final project + evaluations

Risk prediction CSE 291: Personal Genomics for Bioinformaticians 02/02/17

Outline • Basic risk prediction • Example: eye color • Risk prediction in DTCs • Paper I: Martin, et al. • Paper II: Kong, et al. (briefly)

Basic risk prediction

The goal GWAS Prediction Height Genotype 10 AG 10 GG 11 AG 12 GG 13 AG 14 AA 15 AG 16 AG Height Genotype 16 AA ? ? AG

Polygenic risk score: weighted sum of genotypes Polygenic risk score = Σ w. X i i i=1. . n • n = number of SNPs considered • Xi = genotype at SNP i (0, 1, 2) • wi = weight of SNP i (based on GWAS) • Effect size (β) for quantitative trait • Log(Odds ratio) for case/control • Assumes additive contribution of each SNP

Some issues to consider • Which SNPs to use? • Only genome-wide significant SNPs • All SNPs below some nominal pvalue threshold • All SNPs? • Linkage disequilibrium: prune SNPs (based on “clumping”) to get a set of mostly independent SNPs • Technical detail: check the strand! Might be switched between panels

Some issues to consider

Risk scores for quantitative traits Y = β 1 X 1 + ε 1 Y = β 2 X 2 + ε 2 PRS = Y = β 3 X 3 + ε 3 … Y = β n. X n + ε n Σ βX i i i=1. . n Interpretation: PRS gives number of standard deviations away from the mean phenotype, if Y was standardized to N(0, 1) before performing regressions n = number of SNPs we’re using in our score

Risk scores for case/control – liability threshold model • Assume underlying quantitative risk • Top x% of risk scores get the disease, where x is the prevalence of the disease in the population. • Useful for simulating case/control traits
~β 1 X 1+ ε 1 Logit(p)~β 2 X 2+")
Risk scores for case/control Logit(p)~β 1 X 1+ ε 1 Logit(p)~β 2 X 2+ ε 2 Logit(p)~β 3 X 3+ ε 3 … Logit(p)~βn. Xn+ εn Recall, the logit function gives the log odds: Logit(p) = p/(1 -p) PRS = Σ βX i i i=1. . n Where βi approximates the log odds ratio for SNP i (You can also use the log odds ratio calculated directly from the case/control allele contingency table)

Recall: frequency vs. effect size Effect size severe mild rare e. g. Tay-Sachs Nonexistent Severe Mendelian disorders (removed by selection) (well actually… AD APO e 4. why? ) Likely many examples, but low power to detect these e. g. high cholesterol, Crohn’s Disease, Type II Diabetes (many common alleles with small effect sizes) common Allele Frequency

GWAS best powered for modest effect common variants Power: what is the probability that we can detect an association at the desired significance level, given there is actually an association GWAS power depends on: minor allele frequency, sample size, effect size (odds ratio)

Evaluating polygenic risk scores • For quantitative trait: Pearson correlation • For case-control trait: AUC curve • Note, performance upper-bounded by trait heritability!

Example: eye color

Irisplex Walsh et al. 2011
 control most of eye color")
Six SNPs (!) control most of eye color
 is 0 (control) or 1")
Extending the case/control framework • Standard case/control, phenotype (Y) is 0 (control) or 1 (case). • For eye color classification, we have instead 3 classes: blue, brown, other • Blue eyes, brown eyes, other colored eyes • Multinomial logistic regression: extends logistic regression to multiclassification, with K possible outcomes. Solving for probabilities gives: https: //en. wikipedia. org/wiki/Multinomial_logistic_regression

Computing eye color “risk scores” Model 1: blue vs. brown Model 2: other vs. brown Compute probability of blue, brown, or other eyes. Parameters trained on known data.
 https: //docs. google. com/spreadsheets/d/1 a. P 4 OQd. Ns. Bj 7")
Example (my data) https: //docs. google. com/spreadsheets/d/1 a. P 4 OQd. Ns. Bj 7 g. N 5 v_Hb 40 VFV 3 zg. To. DPMv. GTFQYD 6 y. Hwg/edit? usp=sharing

Worldwide distribution of eye colors

Eye color distribution in Europe

Risk prediction in DTCs
 …")
Example (23 and. Me) …
 …")
Example (DNA. land) …

Should DTC companies report complex trait risk? http: //www. fda. gov/ICECI/Enforcement. Actions/Warning. Letters/2013/ucm 376296. htm …

Paper I: Martin, et al.

Figure 1

Figure 1

Figure 1

Figure S 1

Figure S 8

Figure 2

Figure 3

Figure S 11

Figure 4

Figure 5

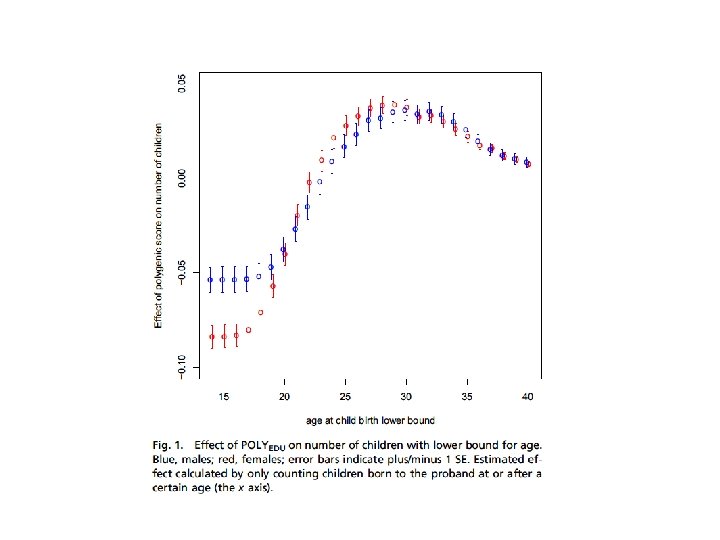
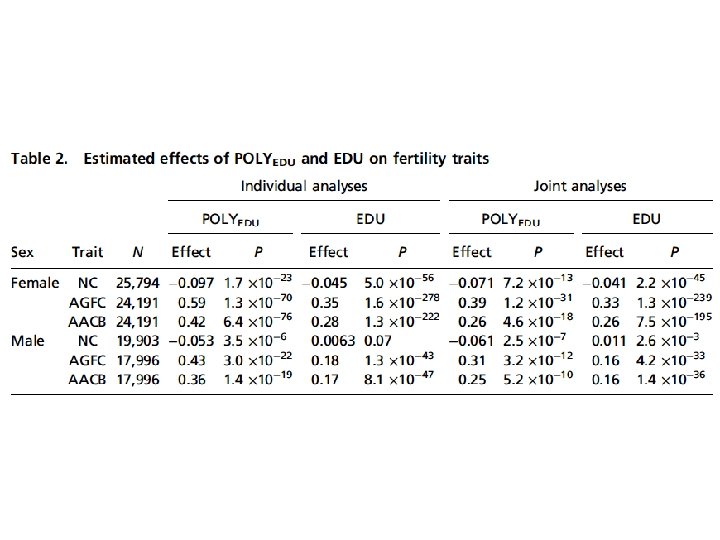
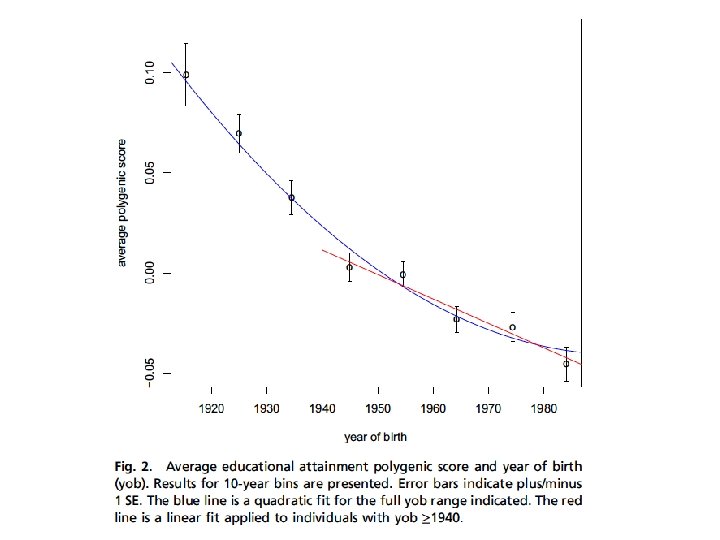
Paper II: Kong, et al.
- Slides: 41