CSC 589 Introduction to Computer Vision Lecture 7


. . . the manner in which the author arrives")

 Number of")

 = sin(2πf t) + (1/3)sin(2π(3 f) t) =")

")


 Inverse Fourier transform Frequency f(w) What is")


")
 M pixels (0, N/2) Fourier N pixels Transform")
 M pixels (0, N/2)")
 Spatial domain Frequency Domain")


")


- Slides: 47
CSC 589 Introduction to Computer Vision Lecture 7 Thinking in Frequency Bei Xiao
Last lecture • • • More on Image derivatives Quiz Image De-noising Median Filter Introduction to Frequency analysis • Homework submitted after tomorrow will receive ZERO points. This informationis in the syllabus!
Today’s lecture • Fourier transform and frequency domain – Fourier transformation in 1 d signal – Fourier transform of images – Fourier transform in Python • Reminder: Read your text book. Today’s lecture covers materials in 3. 4
Hybrid Image
Hybrid Image
Why do we get different, distance-dependent interpretations of hybrid images? ?
Why does the Gaussian give a nice smooth image, but the square filter give edgy artifacts? Gaussian Box filter
How is that a 4 MP image can be compressed to a few hundred KB without a noticeable change?
Jean Baptiste Joseph Fourier (17681830). . . the manner in which the author arrives at these had crazy idea (1807): equations is not exempt of difficulties and. . . his Any univariate function can beanalysis to integrate them still leaves something to be rewritten as a weighted sum of desired on the score of generality and even rigour. sines and cosines of different frequencies. • Don’t believe it? – Neither did Lagrange, Laplace, Poisson and other big wigs – Not translated into English until 1878! Laplace • But it’s (mostly) true! – called Fourier Series – there are some subtle restrictions Lagrange Legendre
Overview of Fourier Transform http: //www. csce. uark. edu/~jgauch/5683/notes/ch 04 a. pdf
Sine Wave T A ϕ A: Amplitude f: angular frequency, ω/2π (HZ) Number of oscillations that occur each second of time ϕ: phase
A sum of sines Our building block: Add enough of them to get any signal g(x) you want!
Frequency Spectra • example : g(t) = sin(2πf t) + (1/3)sin(2π(3 f) t) = + amplitude Slides: Efros
Why decompose signals into sine waves? • Why don’t we represent the system with some other periodic signals? • Sine wave is the only waveform that doesn’t change shape when subject to a linear-timeinvariant (LTI) system. Input sinusoids, output will be sinusoids. • Convolution, image domain filtering, is LTI.
Frequency Spectra • Consider a square wave f(x)
Frequency Spectra = = +
Frequency Spectra = = +
Frequency Spectra = = +
Frequency Spectra = = +
Frequency Spectra = = +
Frequency Spectra =
Fourier Transform • Fourier Transform Time f(t) Inverse Fourier transform Frequency f(w) What is transformation? It is a mapping between two domains
Fourier Transform Real part Imaginary part
Example: Music • We think of music in terms of frequencies at different magnitudes Slide: Hoiem
Other signals • We can also think of all kinds of other signals the same way xkcd. com
Fourier Analysis of Images • Let’s watch a funny video: • https: //www. youtube. com/watch? v=m. EN 7 DT d. Hb. AU
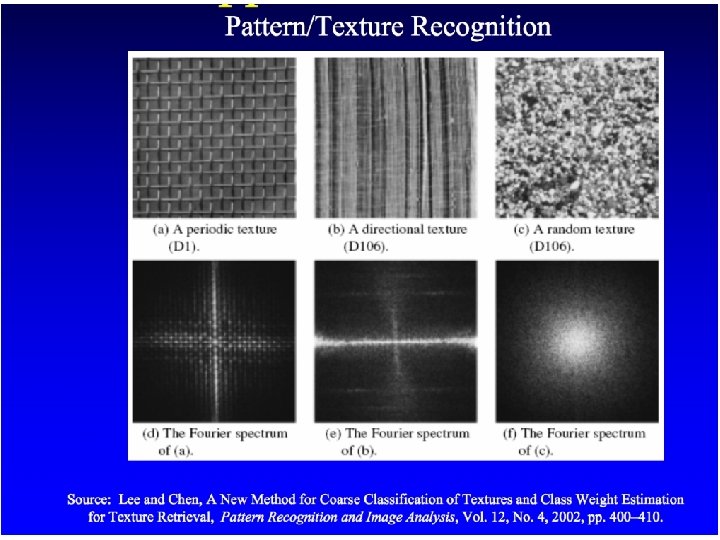
Spatial Frequency in Image • Any structure periodic in images
Fourier Transform
Fourier Transform
2 D Fourier Transform Basis http: //www. csce. uark. edu/~jgauch/5683/notes/ch 04 a. pdf
2 D discrete Fourier transform
2 D discrete Fourier transform Spatial domain Fourier domain
2 D discrete Fourier transform Spatial domain Fourier domain (symmetric around zero)
Fourier Transform of Images (0, 0) M pixels (0, N/2) Fourier N pixels Transform (-M/2, 0) (M/2, 0) F[u, v] I[m, n] Spatial domain (0, 0) (0, -N/2) (M, N) Frequency Domain 2 D FFT can be composed as two discrete Fourier Transforms in 1 dimension
Fourier Transform of Images Edge represents highest frequency (0, 0) M pixels (0, N/2) Fourier N pixels Transform (-M/2, 0) (M/2, 0) F[u, v] I[m, n] Spatial domain (0, 0) (0, -N/2) (M, N) Frequency Domain Center represents lowest frequency, Which represents an average pixel
Fourier Transform of Images (0, 0) Spatial domain Frequency Domain
FT of natural images
Fourier analysis in images http: //www. csce. uark. edu/~jgauch/5683/notes/ch 04 a. pdf
Signals can be composed + = http: //sharp. bu. edu/~slehar/fourier. html#filtering More: http: //www. cs. unm. edu/~brayer/vision/fourier. html
Fourier transform in Numpy • Numpy has a FFT package. • Np. fft 2() provides us the frequency transform which will be a complex array. • np. fftshift() shift the DC component in the center. • We need to compute the magnitude from the output by taking the log. Np. log(np. abs(fft_shift_image))
Exercise • • Open an image Add both Salt and Pepper, Gaussian noise. Display FFT images of original and noisy images. img = misc. imread('peppers 256. png', flatten=1) f = np. fft 2(img) fshift = np. fftshift(f) magnitude_spectrum = 20*np. log(np. abs(fshift))
Exercise 2 • Apply the box filter to an image and compare the image with the Fourier transformed image.
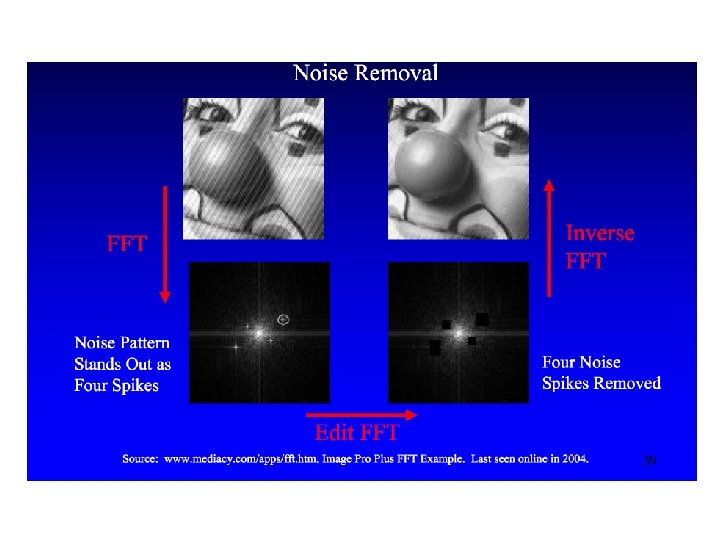
Next Lecture • • Discrete Fourier Transform with Python Filtering in Frequency domain Inverse Fourier Applications of FT
Fourier Transform • Fourier transform stores the magnitude and phase at each frequency – Magnitude encodes how much signal there is at a particular frequency – Phase encodes spatial information (indirectly) – For mathematical convenience, this is often notated in terms of real and complex numbers Amplitude: Phase:
The Convolution Theorem • The Fourier transform of the convolution of two functions is the product of their Fourier transforms • Convolution in spatial domain is equivalent to multiplication in frequency domain!