CS 61 C Great Ideas in Computer Architecture
- Slides: 43

CS 61 C: Great Ideas in Computer Architecture Performance Instructor: David A. Patterson http: //inst. eecs. Berkeley. edu/~cs 61 c/sp 12 9/15/2020 Spring 2012 -- Lecture #10 1

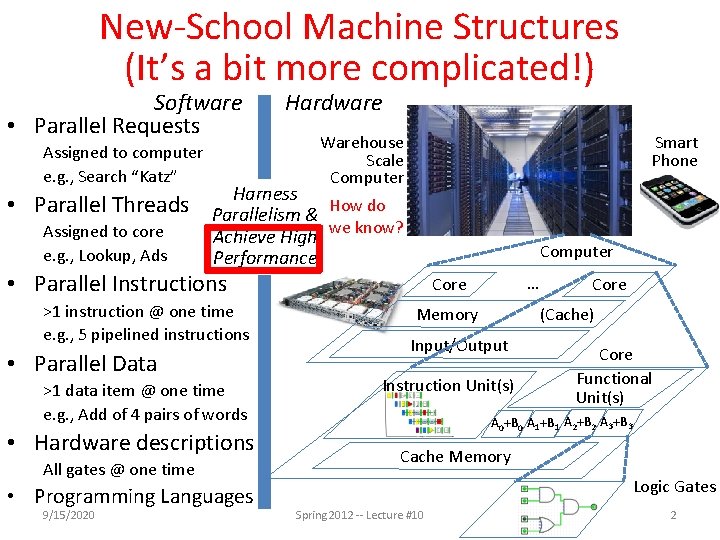
New-School Machine Structures (It’s a bit more complicated!) Software • Parallel Requests Assigned to computer e. g. , Search “Katz” • Parallel Threads Assigned to core e. g. , Lookup, Ads Hardware Smart Phone Warehouse Scale Computer Harness Parallelism & How do Achieve High we know? Performance Computer • Parallel Instructions >1 instruction @ one time e. g. , 5 pipelined instructions • Parallel Data >1 data item @ one time e. g. , Add of 4 pairs of words • Hardware descriptions All gates @ one time • Programming Languages 9/15/2020 … Core Memory (Cache) Input/Output Instruction Unit(s) Core Functional Unit(s) A 0+B 0 A 1+B 1 A 2+B 2 A 3+B 3 Cache Memory Logic Gates Spring 2012 -- Lecture #10 2

Review • Everything is a (binary) number in a computer – Instructions and data; stored program concept • Assemblers can enhance machine instruction set to help assembly-language programmer • Translate from text that easy for programmers to understand into code that machine executes efficiently: Compilers, Assemblers • Linkers allow separate translation of modules • Interpreters for debugging, but slow execution • Hybrid (Java): Compiler + Interpreter to try to get best of both • Compiler Optimization to relieve programmer 9/15/2020 Spring 2012 -- Lecture #10 3

Agenda • • • Defining Performance Administrivia Workloads and Benchmarks Technology Break Measuring Performance Summary 9/15/2020 Spring 2012 -- Lecture #10 4

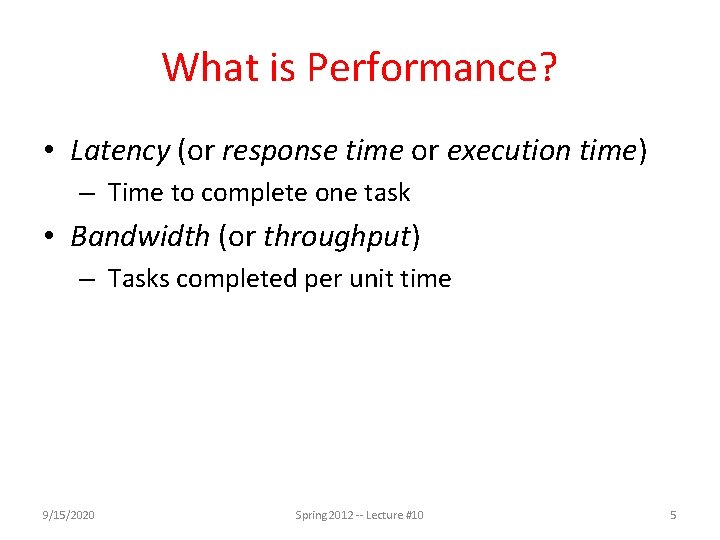
What is Performance? • Latency (or response time or execution time) – Time to complete one task • Bandwidth (or throughput) – Tasks completed per unit time 9/15/2020 Spring 2012 -- Lecture #10 5

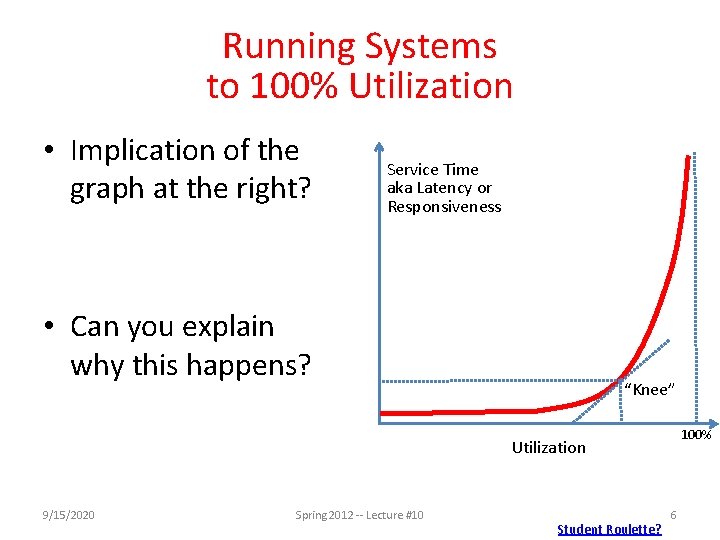
Running Systems to 100% Utilization • Implication of the graph at the right? Service Time aka Latency or Responsiveness • Can you explain why this happens? “Knee” 100% Utilization 9/15/2020 Spring 2012 -- Lecture #10 Student Roulette? 6

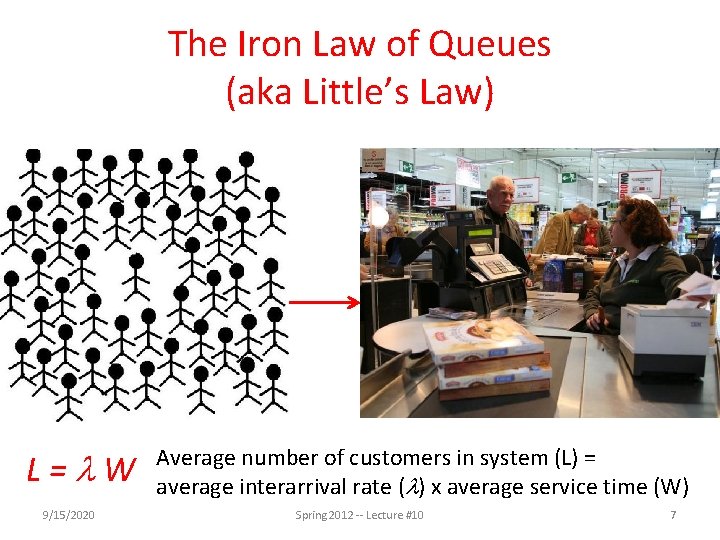
The Iron Law of Queues (aka Little’s Law) L=l. W 9/15/2020 Average number of customers in system (L) = average interarrival rate (l) x average service time (W) Spring 2012 -- Lecture #10 7

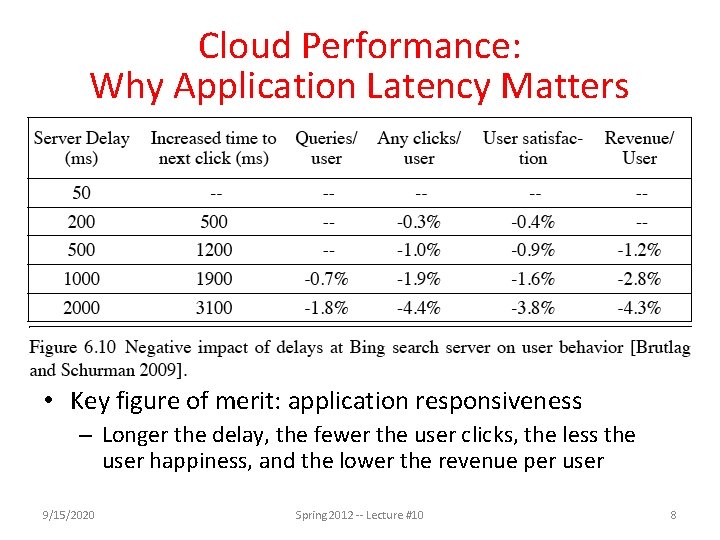
Cloud Performance: Why Application Latency Matters • Key figure of merit: application responsiveness – Longer the delay, the fewer the user clicks, the less the user happiness, and the lower the revenue per user 9/15/2020 Spring 2012 -- Lecture #10 8

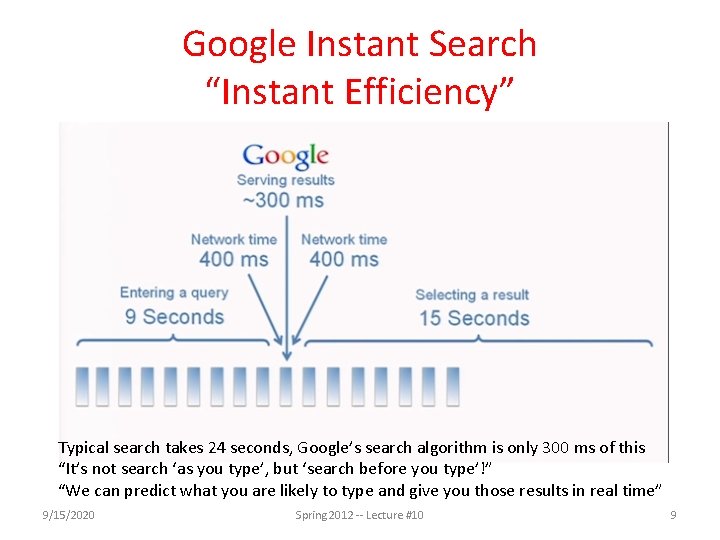
Google Instant Search “Instant Efficiency” Typical search takes 24 seconds, Google’s search algorithm is only 300 ms of this “It’s not search ‘as you type’, but ‘search before you type’!” “We can predict what you are likely to type and give you those results in real time” 9/15/2020 Spring 2012 -- Lecture #10 9

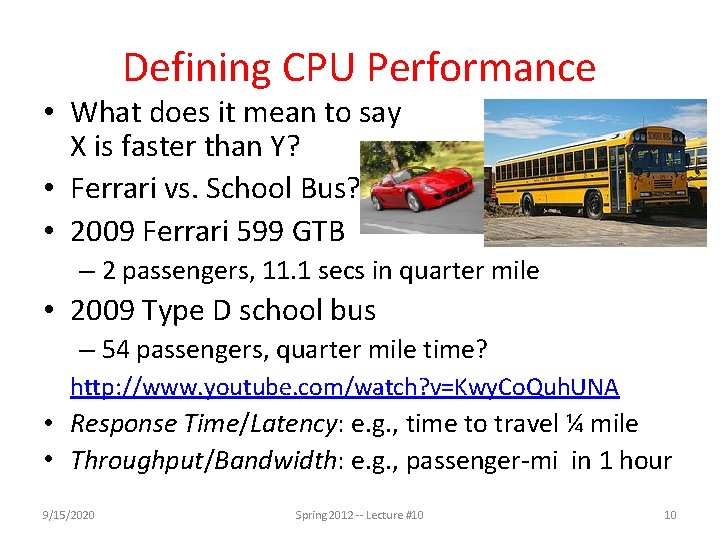
Defining CPU Performance • What does it mean to say X is faster than Y? • Ferrari vs. School Bus? • 2009 Ferrari 599 GTB – 2 passengers, 11. 1 secs in quarter mile • 2009 Type D school bus – 54 passengers, quarter mile time? http: //www. youtube. com/watch? v=Kwy. Co. Quh. UNA • Response Time/Latency: e. g. , time to travel ¼ mile • Throughput/Bandwidth: e. g. , passenger-mi in 1 hour 9/15/2020 Spring 2012 -- Lecture #10 10

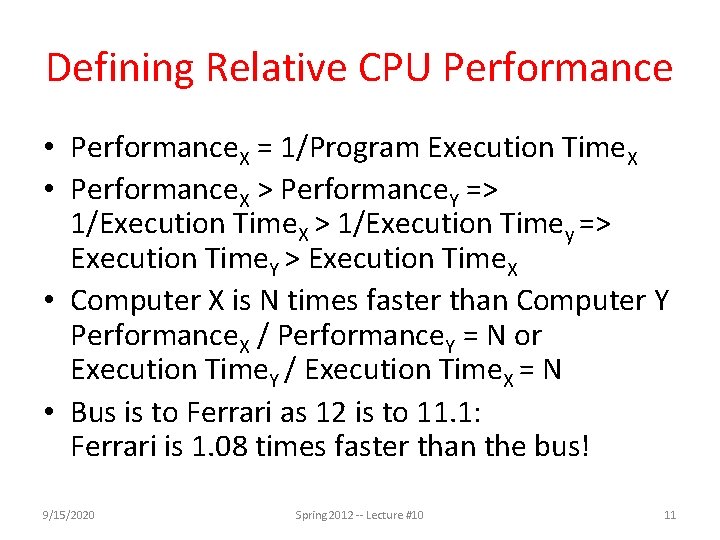
Defining Relative CPU Performance • Performance. X = 1/Program Execution Time. X • Performance. X > Performance. Y => 1/Execution Time. X > 1/Execution Timey => Execution Time. Y > Execution Time. X • Computer X is N times faster than Computer Y Performance. X / Performance. Y = N or Execution Time. Y / Execution Time. X = N • Bus is to Ferrari as 12 is to 11. 1: Ferrari is 1. 08 times faster than the bus! 9/15/2020 Spring 2012 -- Lecture #10 11

Measuring CPU Performance • Computers use a clock to determine when events takes place within hardware • Clock cycles: discrete time intervals – aka clocks, cycles, clock periods, clock ticks • Clock rate or clock frequency: clock cycles per second (inverse of clock cycle time) • 3 Giga. Hertz clock rate => clock cycle time = 1/(3 x 109) seconds clock cycle time = 333 picoseconds (ps) 9/15/2020 Spring 2012 -- Lecture #10 12

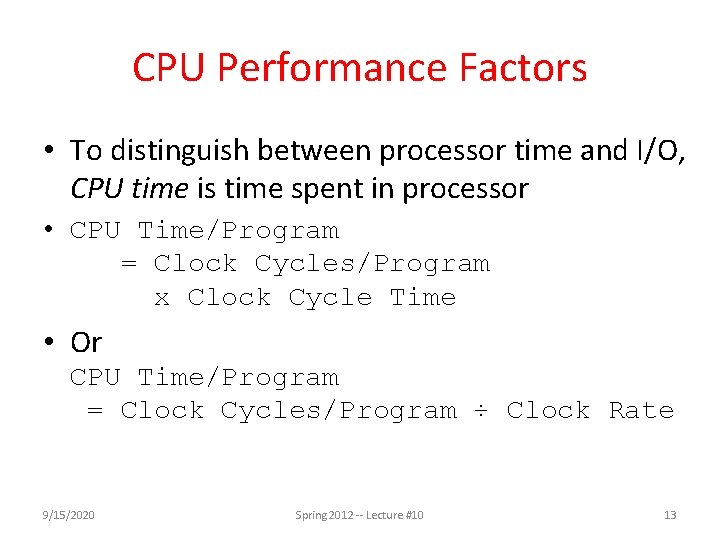
CPU Performance Factors • To distinguish between processor time and I/O, CPU time is time spent in processor • CPU Time/Program = Clock Cycles/Program x Clock Cycle Time • Or CPU Time/Program = Clock Cycles/Program ÷ Clock Rate 9/15/2020 Spring 2012 -- Lecture #10 13

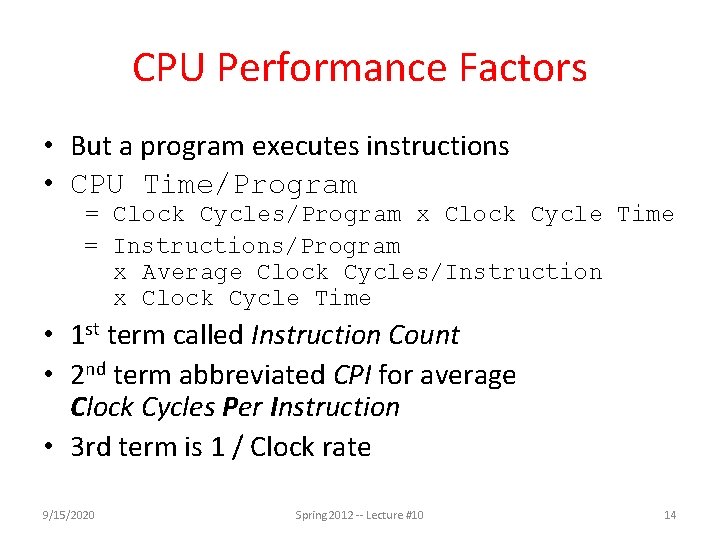
CPU Performance Factors • But a program executes instructions • CPU Time/Program = Clock Cycles/Program x Clock Cycle Time = Instructions/Program x Average Clock Cycles/Instruction x Clock Cycle Time • 1 st term called Instruction Count • 2 nd term abbreviated CPI for average Clock Cycles Per Instruction • 3 rd term is 1 / Clock rate 9/15/2020 Spring 2012 -- Lecture #10 14

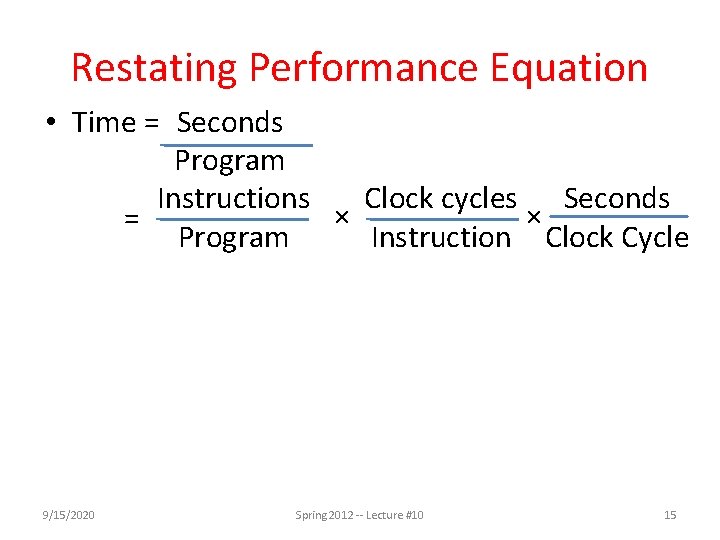
Restating Performance Equation • Time = Seconds Program Instructions Clock cycles Seconds × × = Program Instruction Clock Cycle 9/15/2020 Spring 2012 -- Lecture #10 15

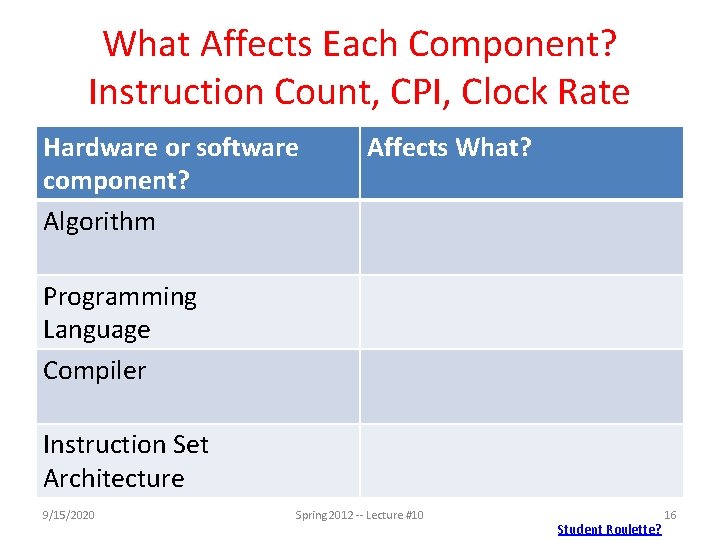
What Affects Each Component? Instruction Count, CPI, Clock Rate Hardware or software component? Algorithm Affects What? Programming Language Compiler Instruction Set Architecture 9/15/2020 Spring 2012 -- Lecture #10 Student Roulette? 16

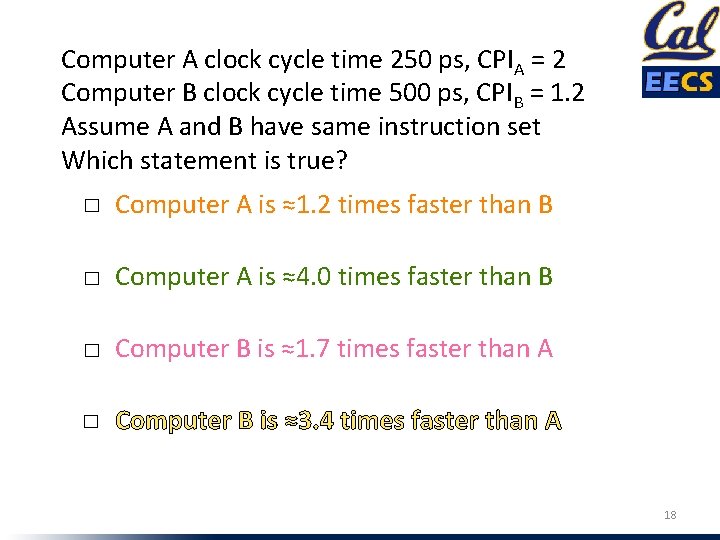
Computer A clock cycle time 250 ps, CPIA = 2 Computer B clock cycle time 500 ps, CPIB = 1. 2 Assume A and B have same instruction set Which statement is true? ☐ Computer A is ≈1. 2 times faster than B ☐ Computer A is ≈4. 0 times faster than B ☐ Computer B is ≈1. 7 times faster than A ☐ Computer B is ≈3. 4 times faster than A 18

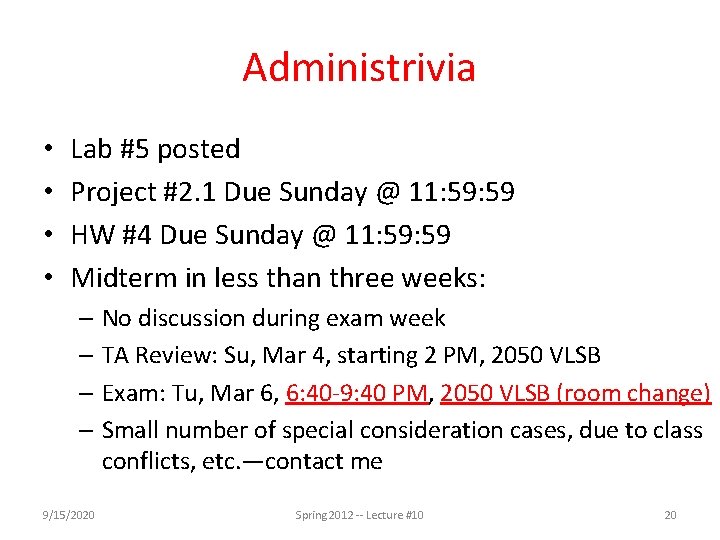
Administrivia • • Lab #5 posted Project #2. 1 Due Sunday @ 11: 59 HW #4 Due Sunday @ 11: 59 Midterm in less than three weeks: – No discussion during exam week – TA Review: Su, Mar 4, starting 2 PM, 2050 VLSB – Exam: Tu, Mar 6, 6: 40 -9: 40 PM, 2050 VLSB (room change) – Small number of special consideration cases, due to class conflicts, etc. —contact me 9/15/2020 Spring 2012 -- Lecture #10 20

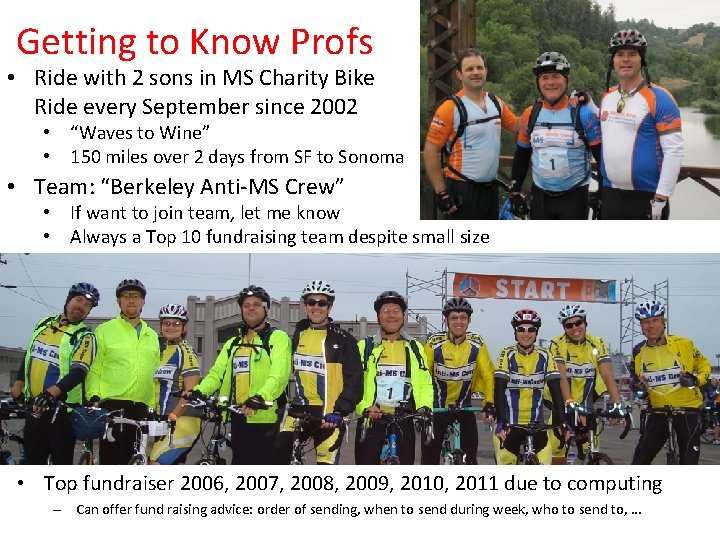
Getting to Know Profs • Ride with 2 sons in MS Charity Bike Ride every September since 2002 • “Waves to Wine” • 150 miles over 2 days from SF to Sonoma • Team: “Berkeley Anti-MS Crew” • If want to join team, let me know • Always a Top 10 fundraising team despite small size • Top fundraiser 2006, 2007, 2008, 2009, 2010, 2011 due to computing – Can offer fund raising advice: order of sending, when to send during week, who to send to, …

Agenda • • • Defining Performance Administrivia Workloads and Benchmarks Technology Break Measuring Performance Summary 9/15/2020 Spring 2012 -- Lecture #10 22

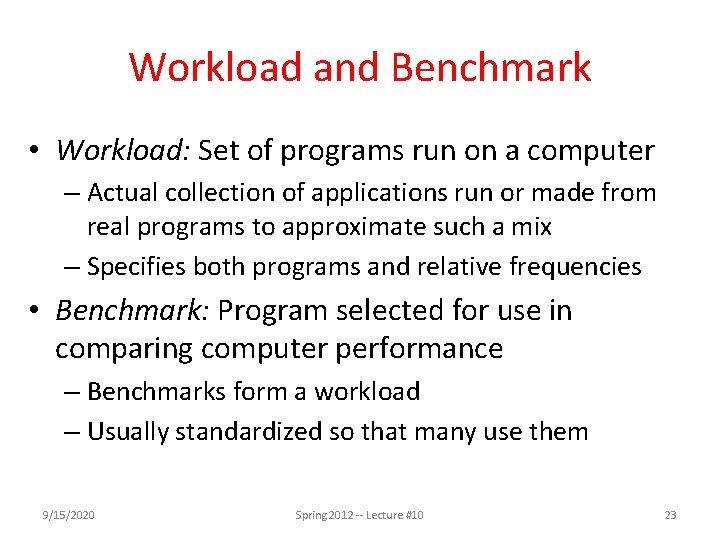
Workload and Benchmark • Workload: Set of programs run on a computer – Actual collection of applications run or made from real programs to approximate such a mix – Specifies both programs and relative frequencies • Benchmark: Program selected for use in comparing computer performance – Benchmarks form a workload – Usually standardized so that many use them 9/15/2020 Spring 2012 -- Lecture #10 23

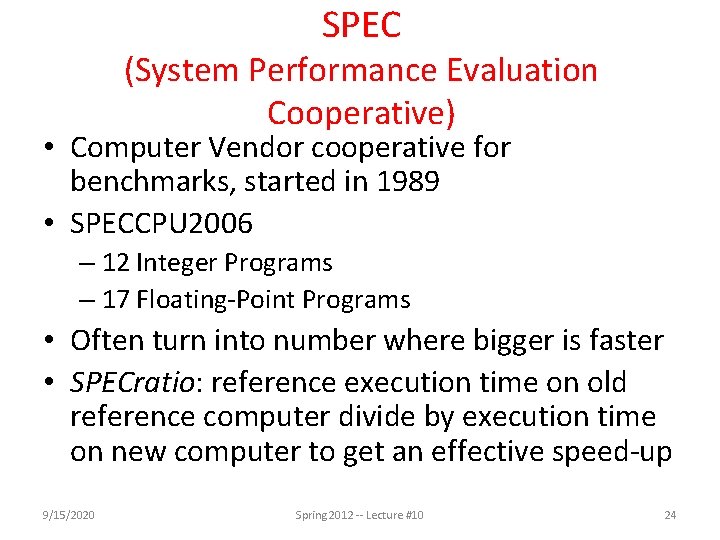
SPEC (System Performance Evaluation Cooperative) • Computer Vendor cooperative for benchmarks, started in 1989 • SPECCPU 2006 – 12 Integer Programs – 17 Floating-Point Programs • Often turn into number where bigger is faster • SPECratio: reference execution time on old reference computer divide by execution time on new computer to get an effective speed-up 9/15/2020 Spring 2012 -- Lecture #10 24

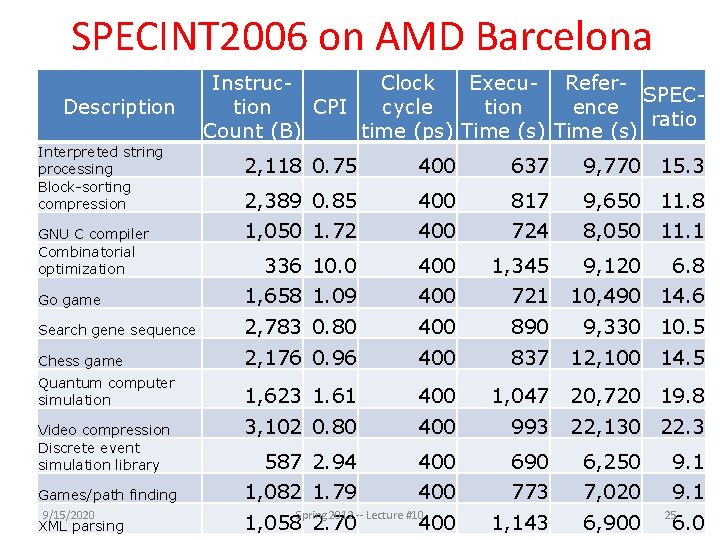
SPECINT 2006 on AMD Barcelona Description Interpreted string processing Block-sorting compression Instruc. Clock Execu- Refer. SPECtion CPI cycle tion ence ratio Count (B) time (ps) Time (s) 2, 118 0. 75 400 637 9, 770 15. 3 2, 389 0. 85 400 817 9, 650 11. 8 1, 050 1. 72 400 724 8, 050 11. 1 336 10. 0 400 1, 345 Go game 1, 658 1. 09 400 721 10, 490 14. 6 Search gene sequence 2, 783 0. 80 400 890 9, 330 10. 5 Chess game 2, 176 0. 96 400 837 12, 100 14. 5 Quantum computer simulation 1, 623 1. 61 400 1, 047 20, 720 19. 8 3, 102 0. 80 400 993 22, 130 22. 3 587 2. 94 400 690 6, 250 9. 1 1, 082 1. 79 400 773 7, 020 9. 1 1, 143 6, 900 GNU C compiler Combinatorial optimization Video compression Discrete event simulation library Games/path finding 9/15/2020 XML parsing Spring 2012 -- Lecture #10 1, 058 2. 70 400 9, 120 6. 8 25 6. 0

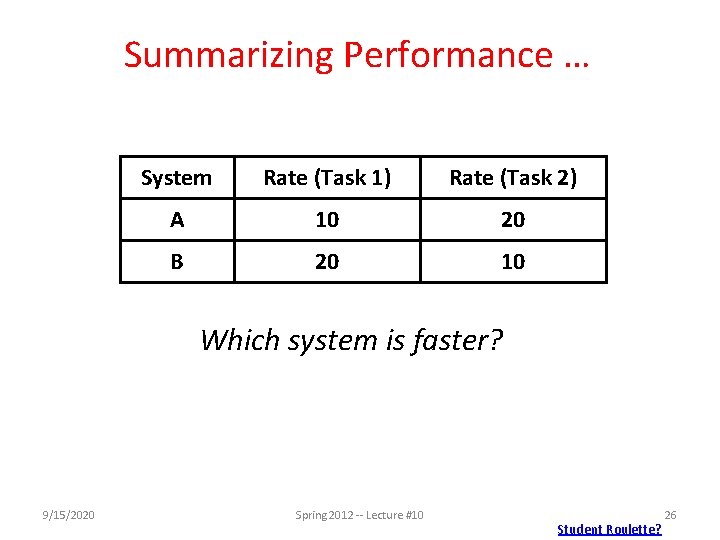
Summarizing Performance … System Rate (Task 1) Rate (Task 2) A 10 20 B 20 10 Which system is faster? 9/15/2020 Spring 2012 -- Lecture #10 Student Roulette? 26

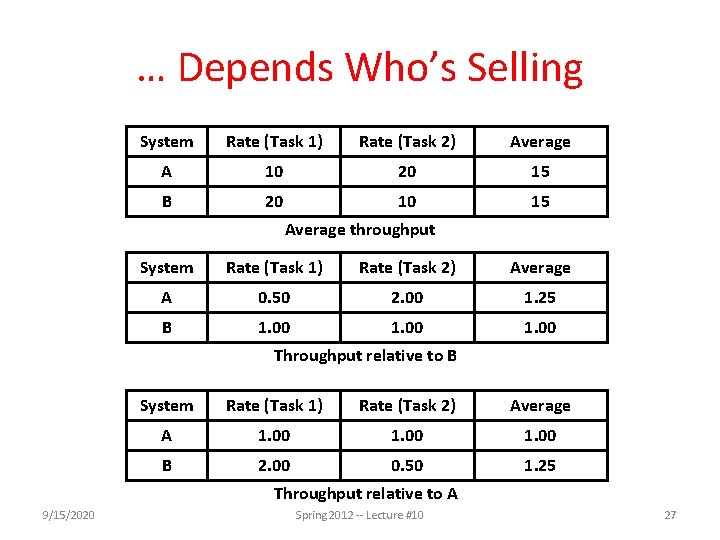
… Depends Who’s Selling System Rate (Task 1) Rate (Task 2) Average A 10 20 15 B 20 10 15 Average throughput System Rate (Task 1) Rate (Task 2) Average A 0. 50 2. 00 1. 25 B 1. 00 Throughput relative to B System Rate (Task 1) Rate (Task 2) Average A 1. 00 B 2. 00 0. 50 1. 25 Throughput relative to A 9/15/2020 Spring 2012 -- Lecture #10 27

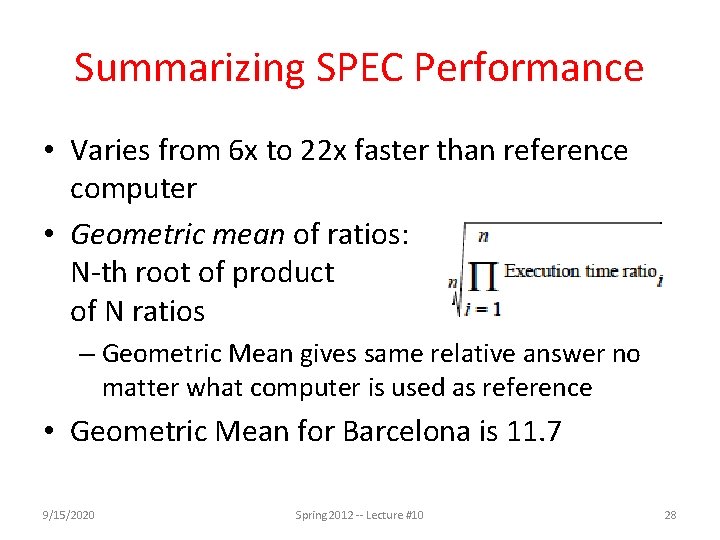
Summarizing SPEC Performance • Varies from 6 x to 22 x faster than reference computer • Geometric mean of ratios: N-th root of product of N ratios – Geometric Mean gives same relative answer no matter what computer is used as reference • Geometric Mean for Barcelona is 11. 7 9/15/2020 Spring 2012 -- Lecture #10 28

Energy and Power (Energy = Power x Time) • Energy to complete operation (Joules) – Corresponds approximately to battery life • Peak power dissipation (Watts = Joules/s) – Affects heat (and cooling demands) – IT equipment’s power is in the denominator of the Power Utilization Efficiency (PUE) equation, a WSC figure of merit 9/15/2020 Spring 2012 -- Lecture #10 29

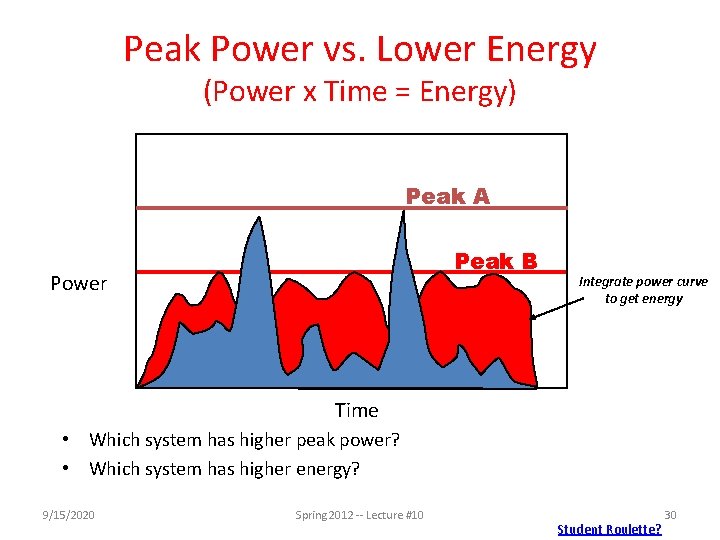
Peak Power vs. Lower Energy (Power x Time = Energy) Peak A Peak B Power Integrate power curve to get energy Time • Which system has higher peak power? • Which system has higher energy? 9/15/2020 Spring 2012 -- Lecture #10 Student Roulette? 30

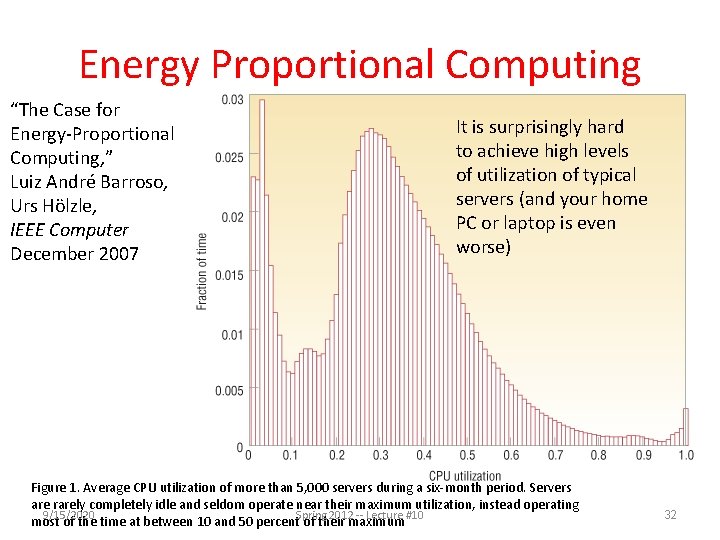
Energy Proportional Computing “The Case for Energy-Proportional Computing, ” Luiz André Barroso, Urs Hölzle, IEEE Computer December 2007 It is surprisingly hard to achieve high levels of utilization of typical servers (and your home PC or laptop is even worse) Figure 1. Average CPU utilization of more than 5, 000 servers during a six-month period. Servers are rarely completely idle and seldom operate near their maximum utilization, instead operating 9/15/2020 Spring 2012 -- Lecture #10 most of the time at between 10 and 50 percent of their maximum 32

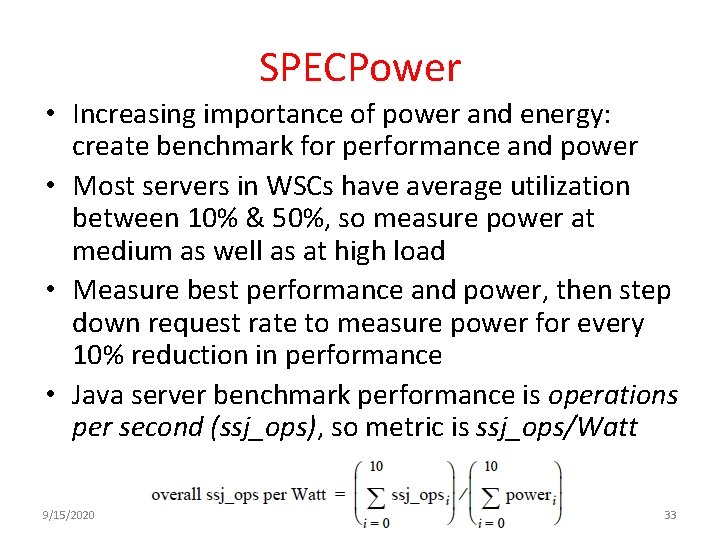
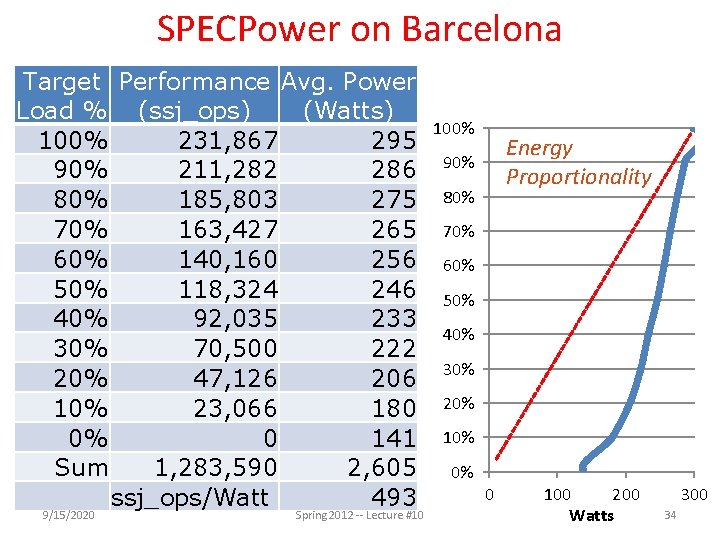
SPECPower • Increasing importance of power and energy: create benchmark for performance and power • Most servers in WSCs have average utilization between 10% & 50%, so measure power at medium as well as at high load • Measure best performance and power, then step down request rate to measure power for every 10% reduction in performance • Java server benchmark performance is operations per second (ssj_ops), so metric is ssj_ops/Watt 9/15/2020 Spring 2012 -- Lecture #10 33

SPECPower on Barcelona Target Performance Avg. Power Load % (ssj_ops) (Watts) 100% 231, 867 295 90% 211, 282 286 80% 185, 803 275 70% 163, 427 265 60% 140, 160 256 50% 118, 324 246 40% 92, 035 233 30% 70, 500 222 20% 47, 126 206 10% 23, 066 180 0% 0 141 Sum 1, 283, 590 2, 605 ssj_ops/Watt 493 9/15/2020 Spring 2012 -- Lecture #10 100% Energy Proportionality 90% 80% 70% 60% 50% 40% 30% 20% 10% 0% 0 100 200 Watts 300 34

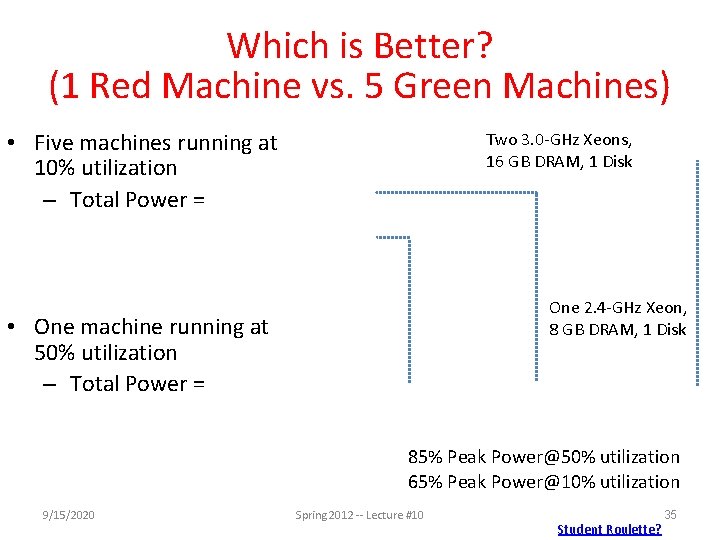
Which is Better? (1 Red Machine vs. 5 Green Machines) • Five machines running at 10% utilization ‒ Total Power = Two 3. 0 -GHz Xeons, 16 GB DRAM, 1 Disk One 2. 4 -GHz Xeon, 8 GB DRAM, 1 Disk • One machine running at 50% utilization ‒ Total Power = 85% Peak Power@50% utilization 65% Peak Power@10% utilization 9/15/2020 Spring 2012 -- Lecture #10 Student Roulette? 35

Other Benchmark Attempts • Rather than run a collection of real programs and take their average (geometric mean), create a single program that matches the average behavior of a set of programs • Called a synthetic benchmark • First example called Whetstone in 1972 for floating point intensive programs in Fortran • Second example called Dhrystone in 1985 for integer programs in Ada and C – Pun on Wet vs. Dry (“Whet” vs. “Dhry”) 9/15/2020 Spring 2012 -- Lecture #10 37

Dhystone Shortcomings • Dhrystone features unusual code that is not usually representative of real-life programs • Dhrystone susceptible to compiler optimizations • Dhrystone’s small code size means always fits in caches, so not representative • Yet still used in hand held, embedded CPUs! 9/15/2020 Spring 2012 -- Lecture #10 38

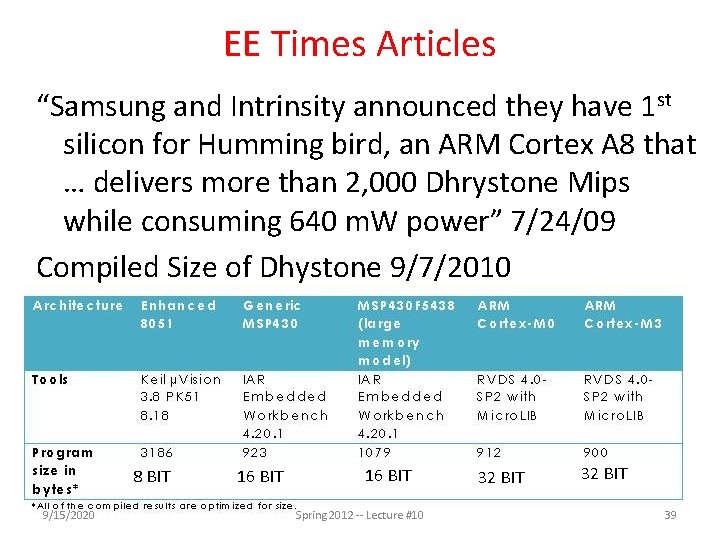
EE Times Articles “Samsung and Intrinsity announced they have 1 st silicon for Humming bird, an ARM Cortex A 8 that … delivers more than 2, 000 Dhrystone Mips while consuming 640 m. W power” 7/24/09 Compiled Size of Dhystone 9/7/2010 8 BIT 9/15/2020 16 BIT Spring 2012 -- Lecture #10 32 BIT 39

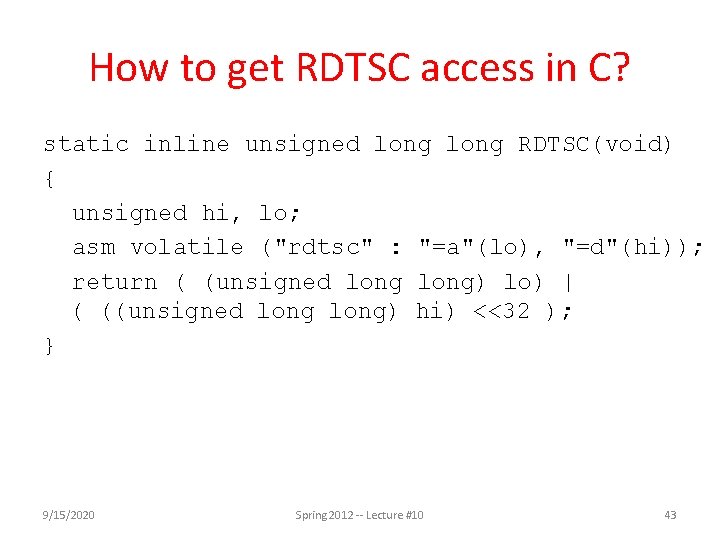
Measuring Time • UNIX time command measures in seconds • Time Stamp Counter – 64 -bit counter of clock cycles on Intel 80 x 86 instruction set computers – 80 x 86 instruction RDTSC (Read TSC) returns TSC in regs EDX (upper 32 bits) and EAX (lower 32 bits) – Can read, but can’t set – How long can measure? – Measures overall time, not just time for 1 program 9/15/2020 Spring 2012 -- Lecture #10 42

How to get RDTSC access in C? static inline unsigned long RDTSC(void) { unsigned hi, lo; asm volatile ("rdtsc" : "=a"(lo), "=d"(hi)); return ( (unsigned long) lo) | ( ((unsigned long) hi) <<32 ); } 9/15/2020 Spring 2012 -- Lecture #10 43

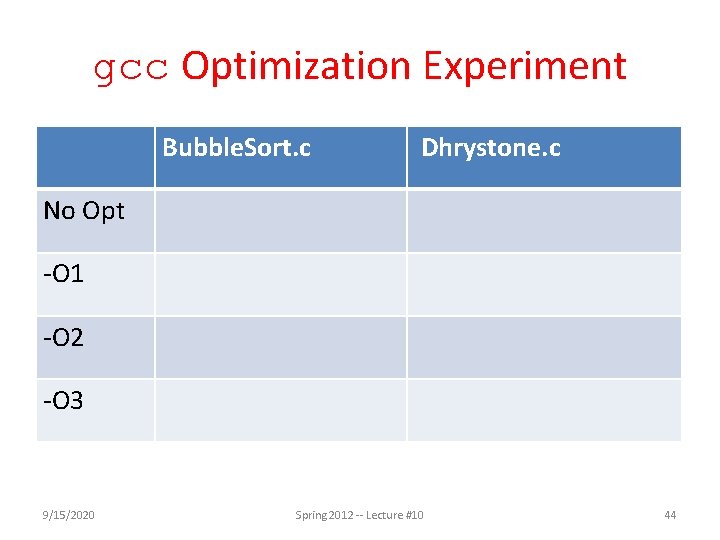
gcc Optimization Experiment Bubble. Sort. c Dhrystone. c No Opt -O 1 -O 2 -O 3 9/15/2020 Spring 2012 -- Lecture #10 44

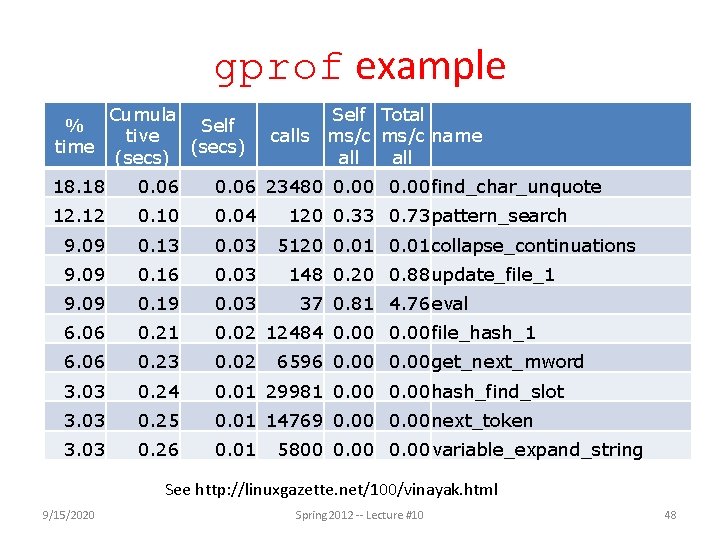
Where Do You Spend the Time in Your Program? • Profiling a program (e. g. , using, gprof) shows where it spends its time by function, so you can determine which code consumes most of the execution time • Usually a 90/10 rule: 10% of code is responsible for 90% of execution time – Or 80/20 rule, where 20% of code responsible for 80% of time 9/15/2020 Spring 2012 -- Lecture #10 46

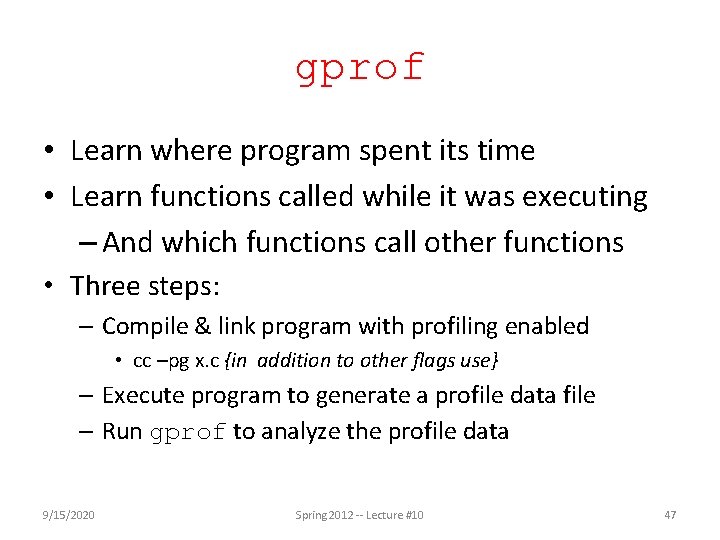
gprof • Learn where program spent its time • Learn functions called while it was executing – And which functions call other functions • Three steps: – Compile & link program with profiling enabled • cc –pg x. c {in addition to other flags use} – Execute program to generate a profile data file – Run gprof to analyze the profile data 9/15/2020 Spring 2012 -- Lecture #10 47

gprof example % time Cumula Self tive (secs) Self Total calls ms/c name all 18. 18 0. 06 23480 0. 00 find_char_unquote 12. 12 0. 10 0. 04 9. 09 0. 13 0. 03 9. 09 0. 16 0. 03 9. 09 0. 19 0. 03 6. 06 0. 21 0. 02 12484 0. 00 file_hash_1 6. 06 0. 23 0. 02 3. 03 0. 24 0. 01 29981 0. 00 hash_find_slot 3. 03 0. 25 0. 01 14769 0. 00 next_token 3. 03 0. 26 0. 01 120 0. 33 0. 73 pattern_search 5120 0. 01 collapse_continuations 148 0. 20 0. 88 update_file_1 37 0. 81 4. 76 eval 6596 0. 00 get_next_mword 5800 0. 00 variable_expand_string See http: //linuxgazette. net/100/vinayak. html 9/15/2020 Spring 2012 -- Lecture #10 48

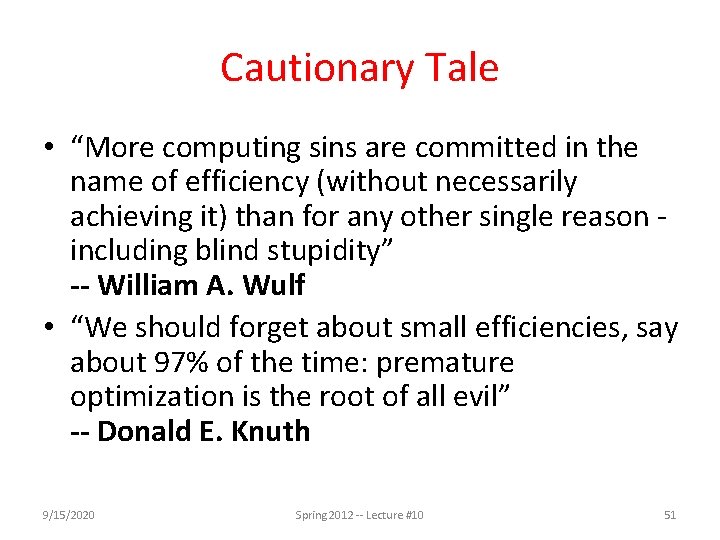
Cautionary Tale • “More computing sins are committed in the name of efficiency (without necessarily achieving it) than for any other single reason - including blind stupidity” -- William A. Wulf • “We should forget about small efficiencies, say about 97% of the time: premature optimization is the root of all evil” -- Donald E. Knuth 9/15/2020 Spring 2012 -- Lecture #10 51

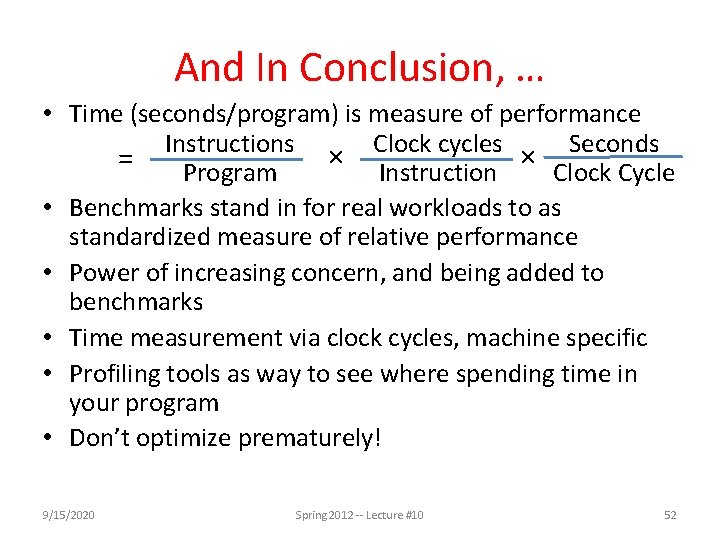
And In Conclusion, … • Time (seconds/program) is measure of performance Instructions Clock cycles Seconds × Instruction × Clock Cycle = Program • Benchmarks stand in for real workloads to as standardized measure of relative performance • Power of increasing concern, and being added to benchmarks • Time measurement via clock cycles, machine specific • Profiling tools as way to see where spending time in your program • Don’t optimize prematurely! 9/15/2020 Spring 2012 -- Lecture #10 52