CS 252 Graduate Computer Architecture Lecture 7 IO

- Slides: 49

CS 252 Graduate Computer Architecture Lecture 7: I/O 3: a little Queueing Theory and I/O benchmarks February 7, 2001 Prof. David A. Patterson Computer Science 252 Spring 2001 2/2/01 CS 252/Patterson Lec 6. 1

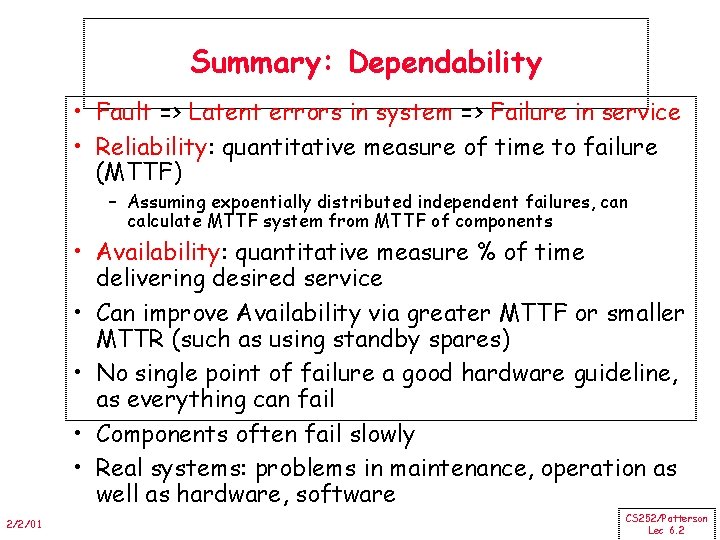
Summary: Dependability • Fault => Latent errors in system => Failure in service • Reliability: quantitative measure of time to failure (MTTF) – Assuming expoentially distributed independent failures, can calculate MTTF system from MTTF of components • Availability: quantitative measure % of time delivering desired service • Can improve Availability via greater MTTF or smaller MTTR (such as using standby spares) • No single point of failure a good hardware guideline, as everything can fail • Components often fail slowly • Real systems: problems in maintenance, operation as well as hardware, software 2/2/01 CS 252/Patterson Lec 6. 2

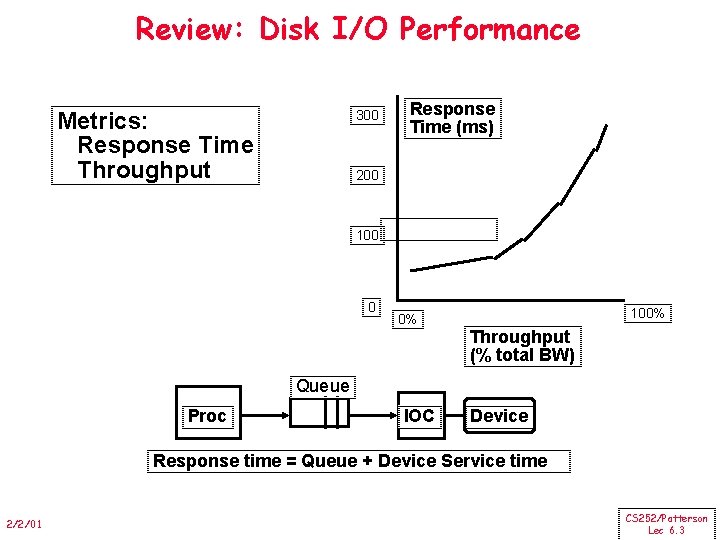
Review: Disk I/O Performance Metrics: Response Time Throughput 300 Response Time (ms) 200 100 0 0% 100% Throughput (% total BW) Queue Proc IOC Device Response time = Queue + Device Service time 2/2/01 CS 252/Patterson Lec 6. 3

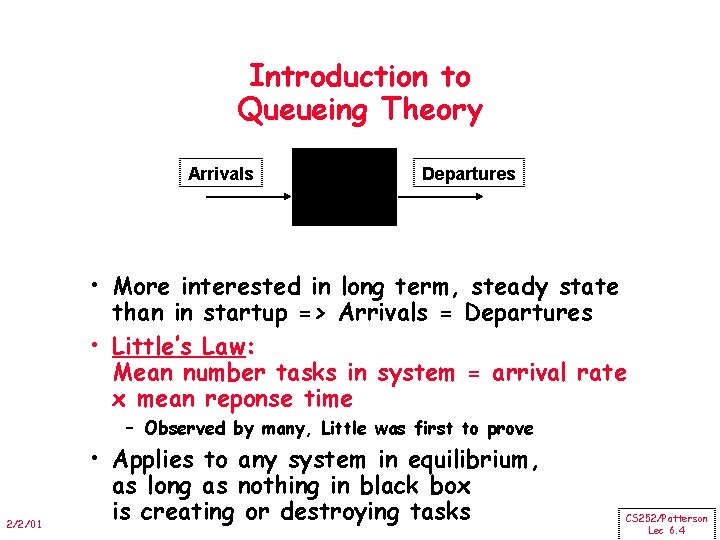
Introduction to Queueing Theory Arrivals Departures • More interested in long term, steady state than in startup => Arrivals = Departures • Little’s Law: Mean number tasks in system = arrival rate x mean reponse time – Observed by many, Little was first to prove 2/2/01 • Applies to any system in equilibrium, as long as nothing in black box is creating or destroying tasks CS 252/Patterson Lec 6. 4

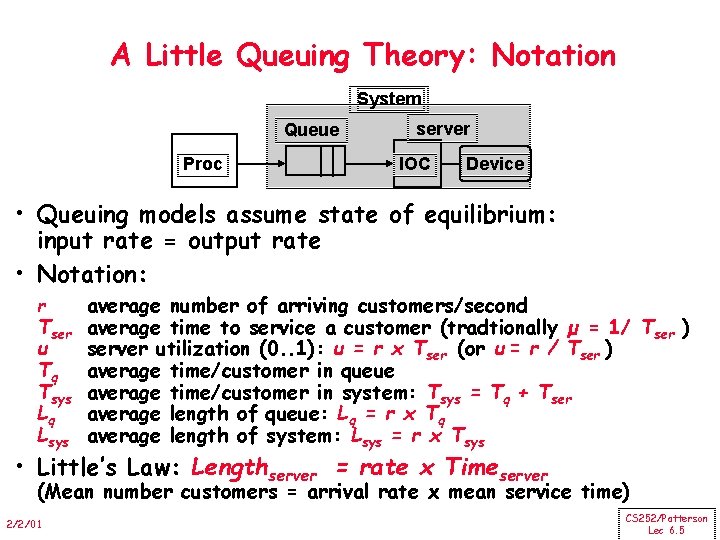
A Little Queuing Theory: Notation System Queue Proc server IOC Device • Queuing models assume state of equilibrium: input rate = output rate • Notation: r Tser u Tq Tsys Lq Lsys average number of arriving customers/second average time to service a customer (tradtionally µ = 1/ Tser ) server utilization (0. . 1): u = r x Tser (or u = r / Tser ) average time/customer in queue average time/customer in system: Tsys = Tq + Tser average length of queue: Lq = r x Tq average length of system: Lsys = r x Tsys • Little’s Law: Lengthserver = rate x Timeserver (Mean number customers = arrival rate x mean service time) 2/2/01 CS 252/Patterson Lec 6. 5

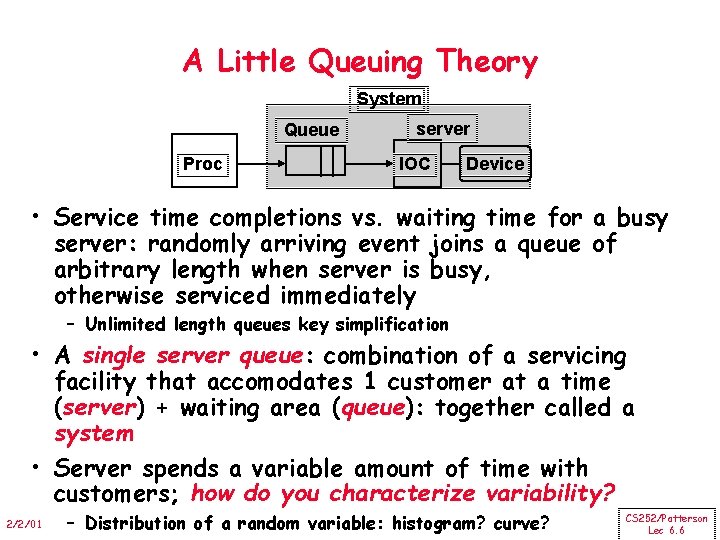
A Little Queuing Theory System Queue Proc server IOC Device • Service time completions vs. waiting time for a busy server: randomly arriving event joins a queue of arbitrary length when server is busy, otherwise serviced immediately – Unlimited length queues key simplification • A single server queue: combination of a servicing facility that accomodates 1 customer at a time (server) + waiting area (queue): together called a system • Server spends a variable amount of time with customers; how do you characterize variability? 2/2/01 – Distribution of a random variable: histogram? curve? CS 252/Patterson Lec 6. 6

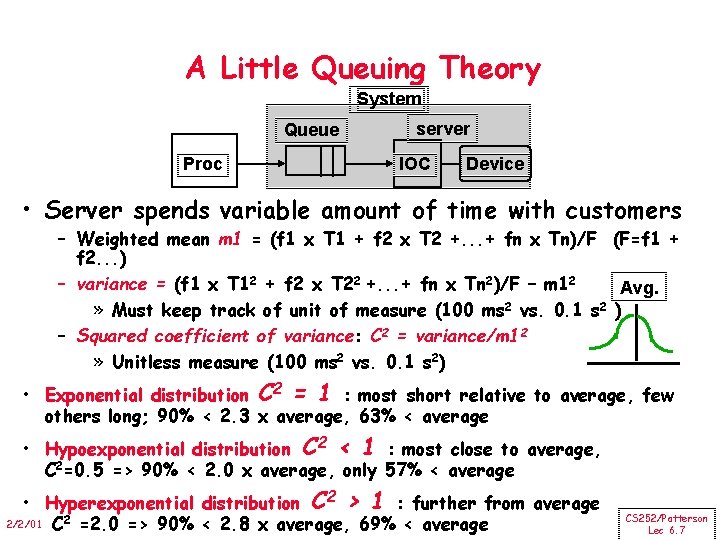
A Little Queuing Theory System Queue Proc server IOC Device • Server spends variable amount of time with customers – Weighted mean m 1 = (f 1 x T 1 + f 2 x T 2 +. . . + fn x Tn)/F (F=f 1 + f 2. . . ) – variance = (f 1 x T 12 + f 2 x T 22 +. . . + fn x Tn 2)/F – m 12 Avg. » Must keep track of unit of measure (100 ms 2 vs. 0. 1 s 2 ) – Squared coefficient of variance: C 2 = variance/m 12 » Unitless measure (100 ms 2 vs. 0. 1 s 2) • Exponential distribution C 2 = 1 : most short relative to average, few others long; 90% < 2. 3 x average, 63% < average • Hypoexponential distribution C 2 < 1 : most close to average, C 2=0. 5 => 90% < 2. 0 x average, only 57% < average • Hyperexponential distribution C 2 > 1 : further from average 2/2/01 C 2 =2. 0 => 90% < 2. 8 x average, 69% < average CS 252/Patterson Lec 6. 7

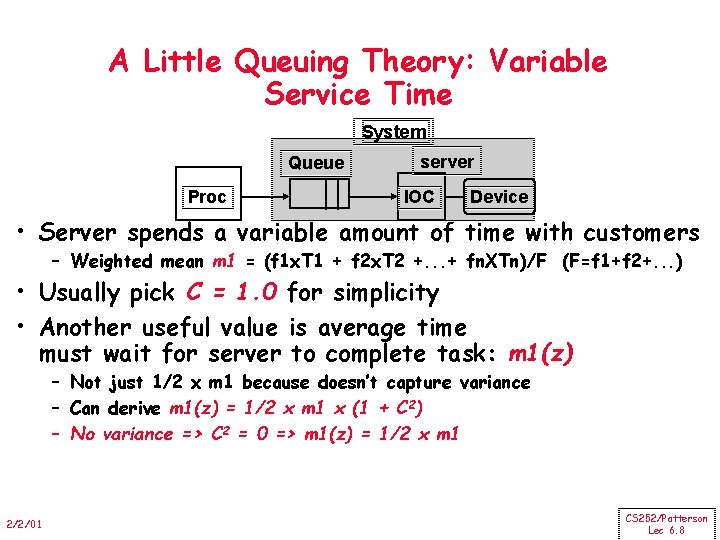
A Little Queuing Theory: Variable Service Time System Queue Proc server IOC Device • Server spends a variable amount of time with customers – Weighted mean m 1 = (f 1 x. T 1 + f 2 x. T 2 +. . . + fn. XTn)/F (F=f 1+f 2+. . . ) • Usually pick C = 1. 0 for simplicity • Another useful value is average time must wait for server to complete task: m 1(z) – Not just 1/2 x m 1 because doesn’t capture variance – Can derive m 1(z) = 1/2 x m 1 x (1 + C 2) – No variance => C 2 = 0 => m 1(z) = 1/2 x m 1 2/2/01 CS 252/Patterson Lec 6. 8

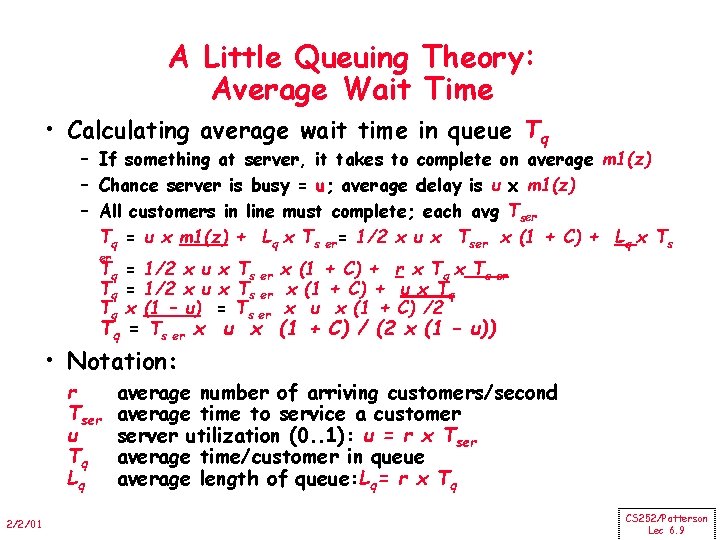
A Little Queuing Theory: Average Wait Time • Calculating average wait time in queue Tq – If something at server, it takes to complete on average m 1(z) – Chance server is busy = u; average delay is u x m 1(z) – All customers in line must complete; each avg Tser Tq = u x m 1(z) + Lq x Ts er= 1/2 x u x Tser x (1 + C) + Lq x Ts er Tq = 1/2 x u Tq x (1 – u) Tq = Ts er x x Ts er x (1 + C) + r x Tq x Ts er x (1 + C) + u x Tq = Ts er x u x (1 + C) /2 u x (1 + C) / (2 x (1 – u)) • Notation: r Tser u Tq Lq 2/2/01 average number of arriving customers/second average time to service a customer server utilization (0. . 1): u = r x Tser average time/customer in queue average length of queue: Lq= r x Tq CS 252/Patterson Lec 6. 9

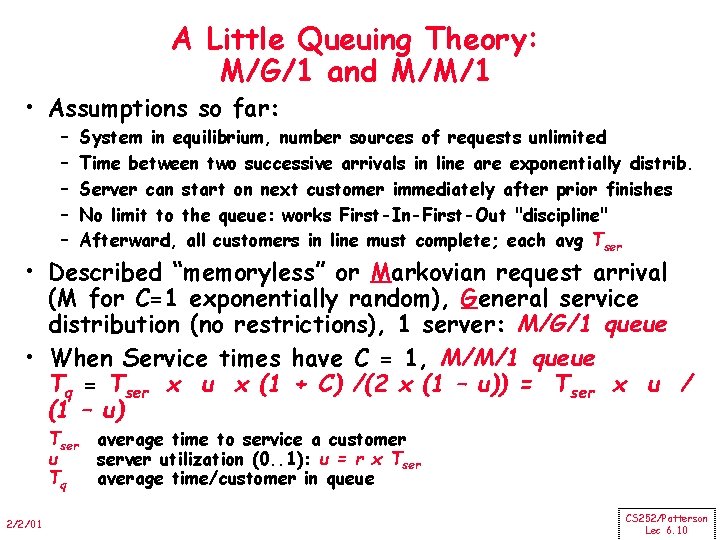
A Little Queuing Theory: M/G/1 and M/M/1 • Assumptions so far: – – – System in equilibrium, number sources of requests unlimited Time between two successive arrivals in line are exponentially distrib. Server can start on next customer immediately after prior finishes No limit to the queue: works First-In-First-Out "discipline" Afterward, all customers in line must complete; each avg Tser • Described “memoryless” or Markovian request arrival (M for C=1 exponentially random), General service distribution (no restrictions), 1 server: M/G/1 queue • When Service times have C = 1, M/M/1 queue Tq = Tser x u x (1 + C) /(2 x (1 – u)) = Tser x u / (1 – u) Tser u Tq 2/2/01 average time to service a customer server utilization (0. . 1): u = r x Tser average time/customer in queue CS 252/Patterson Lec 6. 10

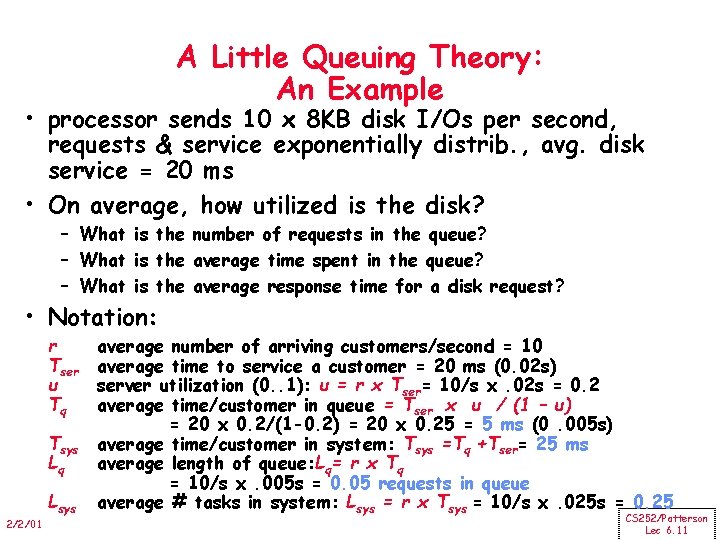
A Little Queuing Theory: An Example • processor sends 10 x 8 KB disk I/Os per second, requests & service exponentially distrib. , avg. disk service = 20 ms • On average, how utilized is the disk? – What is the number of requests in the queue? – What is the average time spent in the queue? – What is the average response time for a disk request? • Notation: r Tser u Tq Tsys Lq Lsys 2/2/01 average number of arriving customers/second = 10 average time to service a customer = 20 ms (0. 02 s) server utilization (0. . 1): u = r x Tser= 10/s x. 02 s = 0. 2 average time/customer in queue = Tser x u / (1 – u) = 20 x 0. 2/(1 -0. 2) = 20 x 0. 25 = 5 ms (0. 005 s) average time/customer in system: Tsys =Tq +Tser= 25 ms average length of queue: Lq= r x Tq = 10/s x. 005 s = 0. 05 requests in queue average # tasks in system: Lsys = r x Tsys = 10/s x. 025 s = 0. 25 CS 252/Patterson Lec 6. 11

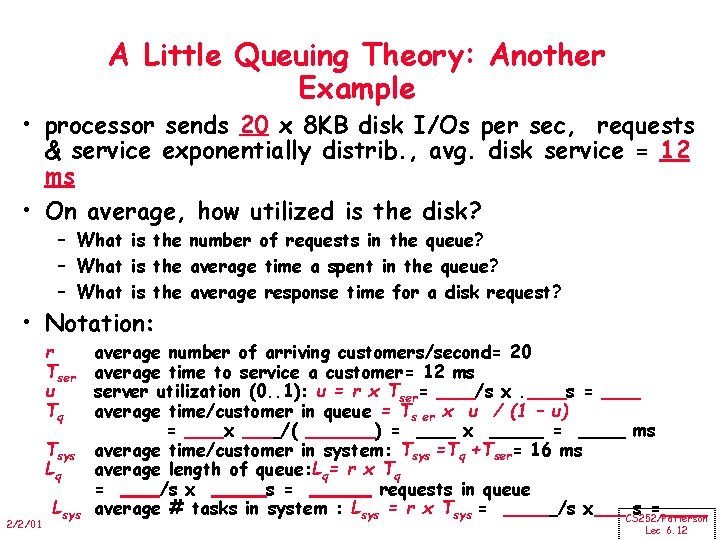
A Little Queuing Theory: Another Example • processor sends 20 x 8 KB disk I/Os per sec, requests & service exponentially distrib. , avg. disk service = 12 ms • On average, how utilized is the disk? – What is the number of requests in the queue? – What is the average time a spent in the queue? – What is the average response time for a disk request? • Notation: r Tser u Tq Tsys Lq 2/2/01 Lsys average number of arriving customers/second= 20 average time to service a customer= 12 ms server utilization (0. . 1): u = r x Tser= /s x. s = average time/customer in queue = Ts er x u / (1 – u) = x /( ) = x = average time/customer in system: Tsys =Tq +Tser= 16 ms average length of queue: Lq= r x Tq = /s x s = requests in queue average # tasks in system : Lsys = r x Tsys = /s x ms s = CS 252/Patterson Lec 6. 12

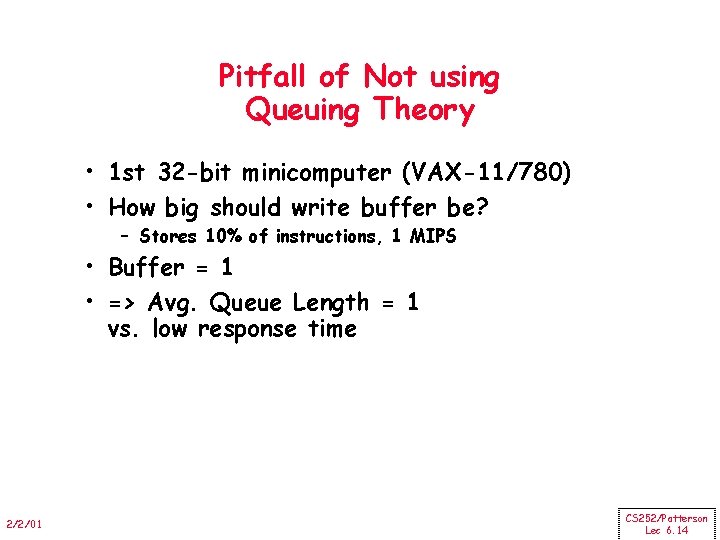
Pitfall of Not using Queuing Theory • 1 st 32 -bit minicomputer (VAX-11/780) • How big should write buffer be? – Stores 10% of instructions, 1 MIPS • Buffer = 1 • => Avg. Queue Length = 1 vs. low response time 2/2/01 CS 252/Patterson Lec 6. 14

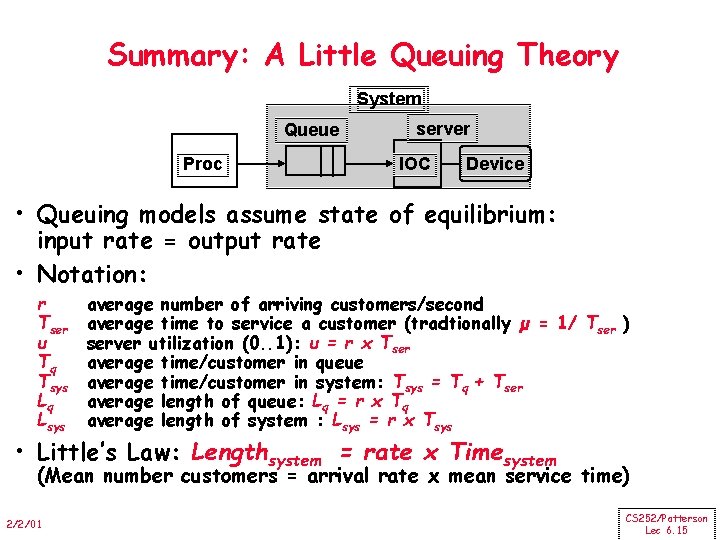
Summary: A Little Queuing Theory System Queue Proc server IOC Device • Queuing models assume state of equilibrium: input rate = output rate • Notation: r Tser u Tq Tsys Lq Lsys average number of arriving customers/second average time to service a customer (tradtionally µ = 1/ Tser ) server utilization (0. . 1): u = r x Tser average time/customer in queue average time/customer in system: Tsys = Tq + Tser average length of queue: Lq = r x Tq average length of system : Lsys = r x Tsys • Little’s Law: Lengthsystem = rate x Timesystem (Mean number customers = arrival rate x mean service time) 2/2/01 CS 252/Patterson Lec 6. 15

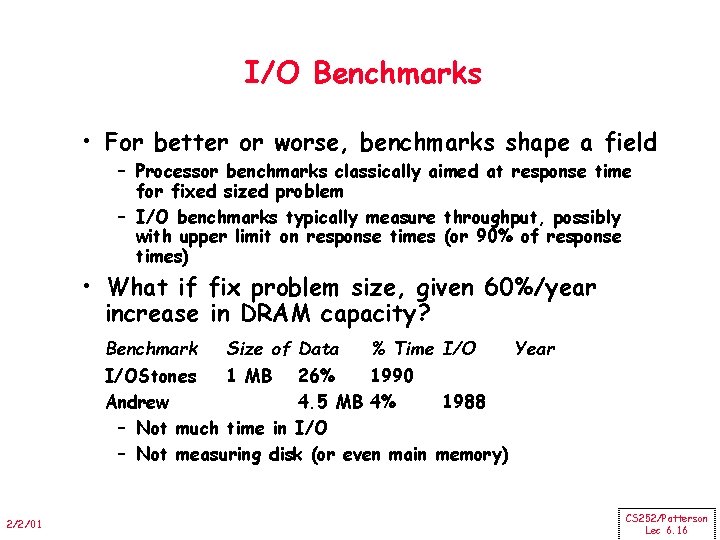
I/O Benchmarks • For better or worse, benchmarks shape a field – Processor benchmarks classically aimed at response time for fixed sized problem – I/O benchmarks typically measure throughput, possibly with upper limit on response times (or 90% of response times) • What if fix problem size, given 60%/year increase in DRAM capacity? Benchmark Size of Data % Time I/O Year I/OStones 1 MB 26% 1990 Andrew 4. 5 MB 4% 1988 – Not much time in I/O – Not measuring disk (or even main memory) 2/2/01 CS 252/Patterson Lec 6. 16

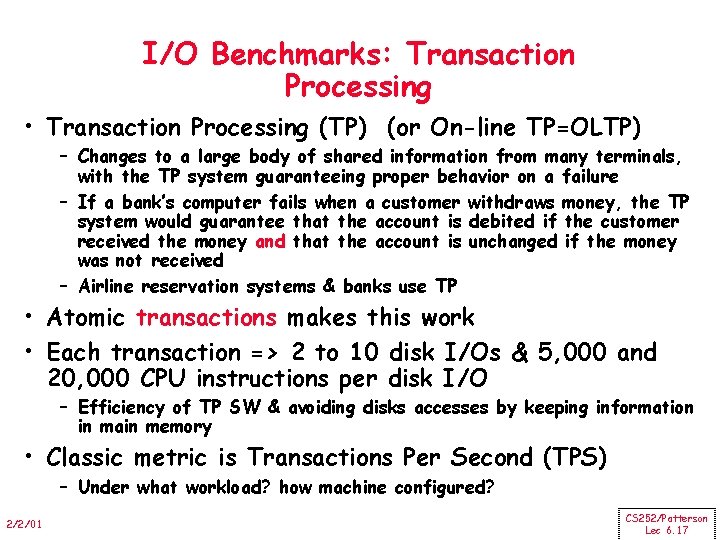
I/O Benchmarks: Transaction Processing • Transaction Processing (TP) (or On-line TP=OLTP) – Changes to a large body of shared information from many terminals, with the TP system guaranteeing proper behavior on a failure – If a bank’s computer fails when a customer withdraws money, the TP system would guarantee that the account is debited if the customer received the money and that the account is unchanged if the money was not received – Airline reservation systems & banks use TP • Atomic transactions makes this work • Each transaction => 2 to 10 disk I/Os & 5, 000 and 20, 000 CPU instructions per disk I/O – Efficiency of TP SW & avoiding disks accesses by keeping information in main memory • Classic metric is Transactions Per Second (TPS) – Under what workload? how machine configured? 2/2/01 CS 252/Patterson Lec 6. 17

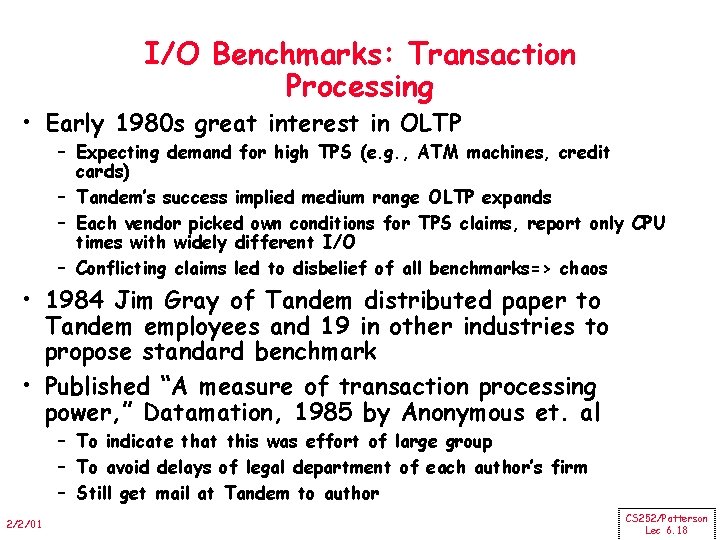
I/O Benchmarks: Transaction Processing • Early 1980 s great interest in OLTP – Expecting demand for high TPS (e. g. , ATM machines, credit cards) – Tandem’s success implied medium range OLTP expands – Each vendor picked own conditions for TPS claims, report only CPU times with widely different I/O – Conflicting claims led to disbelief of all benchmarks=> chaos • 1984 Jim Gray of Tandem distributed paper to Tandem employees and 19 in other industries to propose standard benchmark • Published “A measure of transaction processing power, ” Datamation, 1985 by Anonymous et. al – To indicate that this was effort of large group – To avoid delays of legal department of each author’s firm – Still get mail at Tandem to author 2/2/01 CS 252/Patterson Lec 6. 18

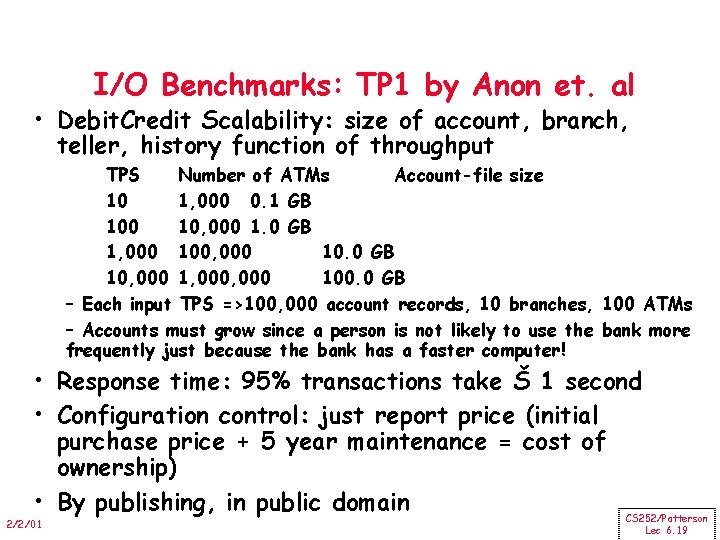
I/O Benchmarks: TP 1 by Anon et. al • Debit. Credit Scalability: size of account, branch, teller, history function of throughput TPS Number of ATMs Account-file size 10 1, 000 0. 1 GB 100 10, 000 1. 0 GB 1, 000 100, 000 10. 0 GB 10, 000 1, 000 100. 0 GB – Each input TPS =>100, 000 account records, 10 branches, 100 ATMs – Accounts must grow since a person is not likely to use the bank more frequently just because the bank has a faster computer! • Response time: 95% transactions take Š 1 second • Configuration control: just report price (initial purchase price + 5 year maintenance = cost of ownership) • By publishing, in public domain CS 252/Patterson 2/2/01 Lec 6. 19

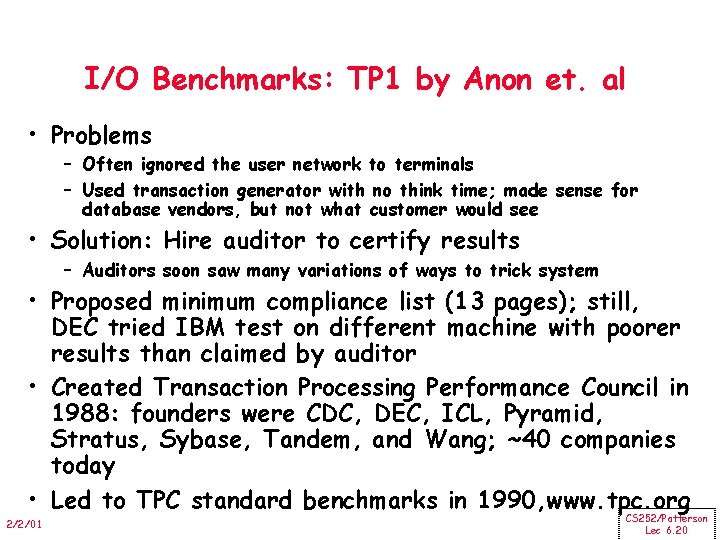
I/O Benchmarks: TP 1 by Anon et. al • Problems – Often ignored the user network to terminals – Used transaction generator with no think time; made sense for database vendors, but not what customer would see • Solution: Hire auditor to certify results – Auditors soon saw many variations of ways to trick system • Proposed minimum compliance list (13 pages); still, DEC tried IBM test on different machine with poorer results than claimed by auditor • Created Transaction Processing Performance Council in 1988: founders were CDC, DEC, ICL, Pyramid, Stratus, Sybase, Tandem, and Wang; ~40 companies today • Led to TPC standard benchmarks in 1990, www. tpc. org 2/2/01 CS 252/Patterson Lec 6. 20

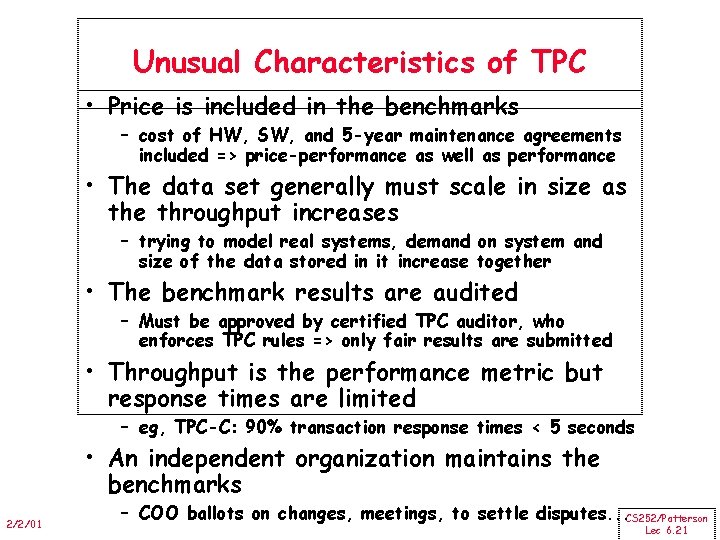
Unusual Characteristics of TPC • Price is included in the benchmarks – cost of HW, SW, and 5 -year maintenance agreements included => price-performance as well as performance • The data set generally must scale in size as the throughput increases – trying to model real systems, demand on system and size of the data stored in it increase together • The benchmark results are audited – Must be approved by certified TPC auditor, who enforces TPC rules => only fair results are submitted • Throughput is the performance metric but response times are limited – eg, TPC-C: 90% transaction response times < 5 seconds • An independent organization maintains the benchmarks 2/2/01 – COO ballots on changes, meetings, to settle disputes. . . CS 252/Patterson Lec 6. 21

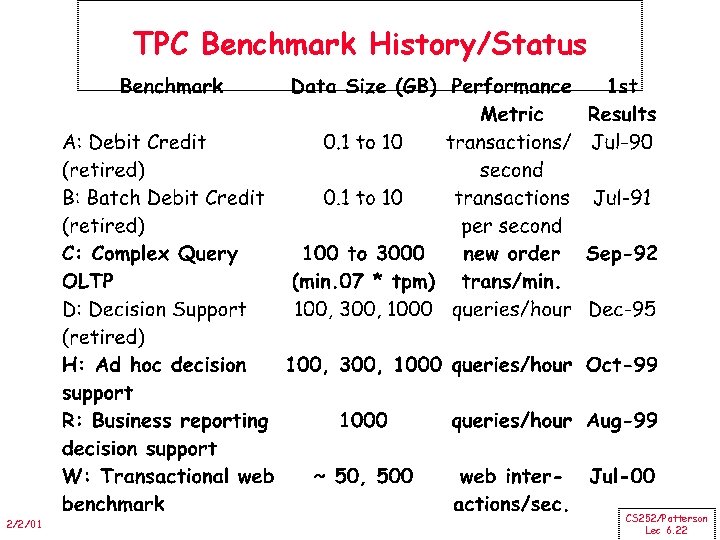
TPC Benchmark History/Status 2/2/01 CS 252/Patterson Lec 6. 22

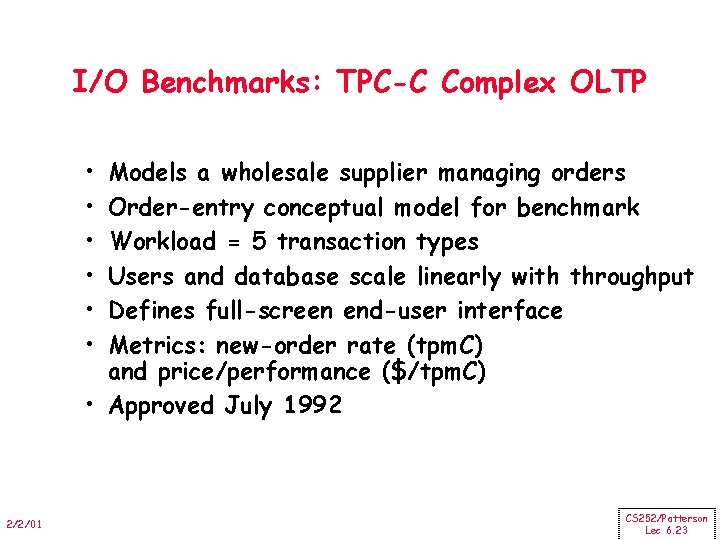
I/O Benchmarks: TPC-C Complex OLTP • • • Models a wholesale supplier managing orders Order-entry conceptual model for benchmark Workload = 5 transaction types Users and database scale linearly with throughput Defines full-screen end-user interface Metrics: new-order rate (tpm. C) and price/performance ($/tpm. C) • Approved July 1992 2/2/01 CS 252/Patterson Lec 6. 23

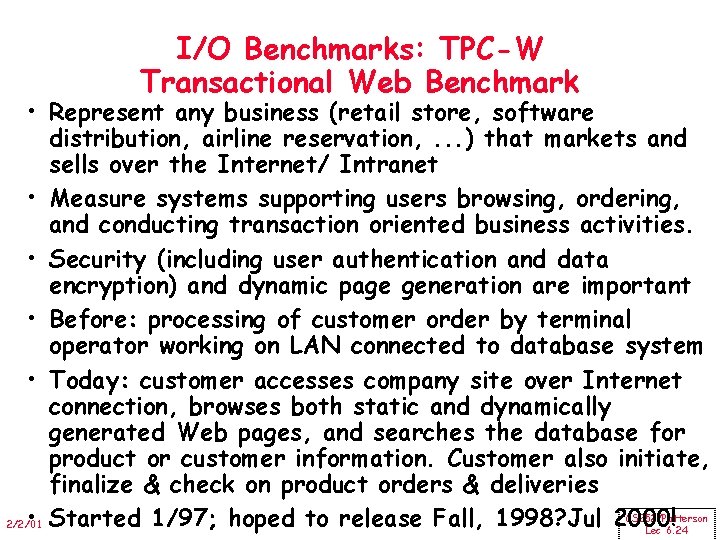
I/O Benchmarks: TPC-W Transactional Web Benchmark • Represent any business (retail store, software distribution, airline reservation, . . . ) that markets and sells over the Internet/ Intranet • Measure systems supporting users browsing, ordering, and conducting transaction oriented business activities. • Security (including user authentication and data encryption) and dynamic page generation are important • Before: processing of customer order by terminal operator working on LAN connected to database system • Today: customer accesses company site over Internet connection, browses both static and dynamically generated Web pages, and searches the database for product or customer information. Customer also initiate, finalize & check on product orders & deliveries CS 252/Patterson • Started 1/97; hoped to release Fall, 1998? Jul 2000! 2/2/01 Lec 6. 24

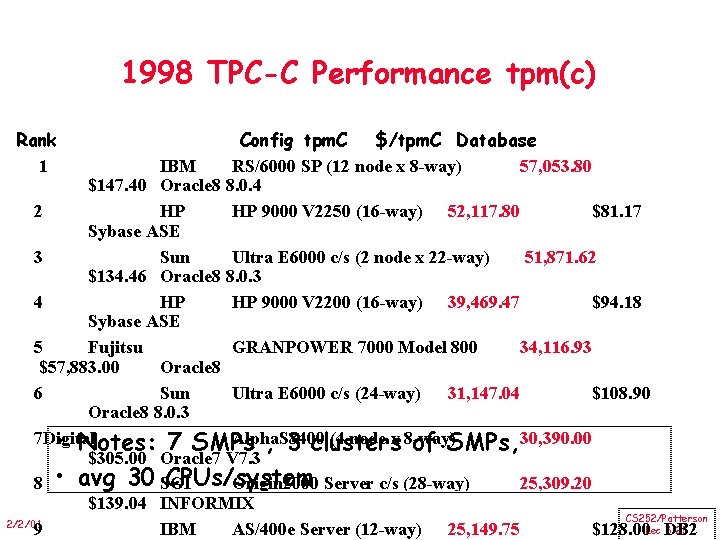
1998 TPC-C Performance tpm(c) Rank 1 Config tpm. C $/tpm. C Database IBM RS/6000 SP (12 node x 8 -way) 57, 053. 80 $147. 40 Oracle 8 8. 0. 4 2 HP HP 9000 V 2250 (16 -way) 52, 117. 80 $81. 17 Sybase ASE 3 Sun Ultra E 6000 c/s (2 node x 22 -way) 51, 871. 62 $134. 46 Oracle 8 8. 0. 3 4 HP HP 9000 V 2200 (16 -way) 39, 469. 47 $94. 18 Sybase ASE 5 Fujitsu GRANPOWER 7000 Model 800 34, 116. 93 $57, 883. 00 Oracle 8 6 Sun Ultra E 6000 c/s (24 -way) 31, 147. 04 $108. 90 Oracle 8 8. 0. 3 7 Digital Alpha. S 8400 (4 node x 8 -way) • Notes: 7 SMPs , 3 clusters of SMPs, 30, 390. 00 $305. 00 Oracle 7 V 7. 3 CPUs/system 8 • avg 30 SGI Origin 2000 Server c/s (28 -way) 25, 309. 20 $139. 04 INFORMIX CS 252/Patterson 2/2/01 6. 25 9 IBM AS/400 e Server (12 -way) 25, 149. 75 $128. 00 Lec DB 2

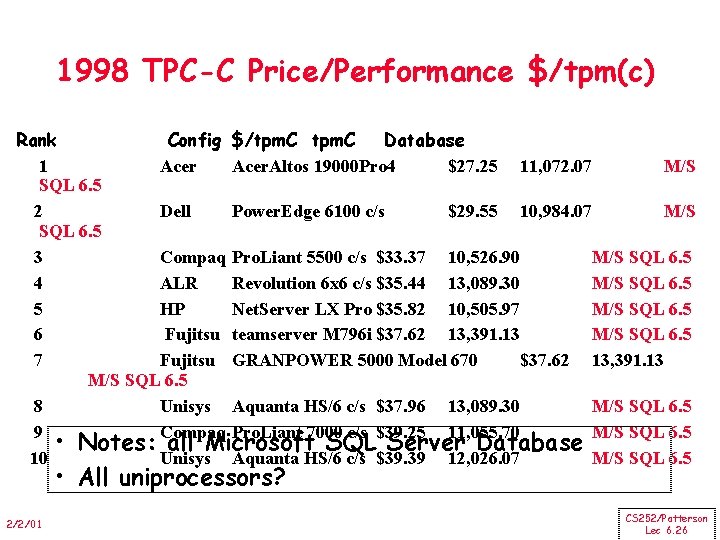
1998 TPC-C Price/Performance $/tpm(c) Rank Config $/tpm. C Database 1 Acer. Altos 19000 Pro 4 $27. 25 11, 072. 07 M/S SQL 6. 5 2 Dell Power. Edge 6100 c/s $29. 55 10, 984. 07 M/S SQL 6. 5 3 Compaq Pro. Liant 5500 c/s $33. 37 10, 526. 90 M/S SQL 6. 5 4 ALR Revolution 6 x 6 c/s $35. 44 13, 089. 30 M/S SQL 6. 5 5 HP Net. Server LX Pro $35. 82 10, 505. 97 M/S SQL 6. 5 6 Fujitsu teamserver M 796 i $37. 62 13, 391. 13 M/S SQL 6. 5 7 Fujitsu GRANPOWER 5000 Model 670 $37. 62 13, 391. 13 M/S SQL 6. 5 8 Unisys Aquanta HS/6 c/s $37. 96 13, 089. 30 M/S SQL 6. 5 9 Compaq Pro. Liant 7000 c/s $39. 25 11, 055. 70 M/S SQL 6. 5 • Notes: all Microsoft SQL Server Database 10 Unisys Aquanta HS/6 c/s $39. 39 12, 026. 07 M/S SQL 6. 5 • All uniprocessors? 2/2/01 CS 252/Patterson Lec 6. 26

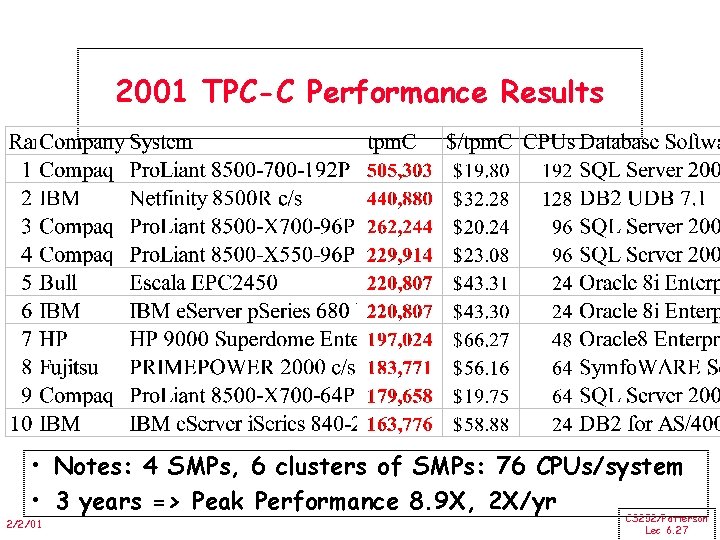
2001 TPC-C Performance Results • Notes: 4 SMPs, 6 clusters of SMPs: 76 CPUs/system • 3 years => Peak Performance 8. 9 X, 2 X/yr 2/2/01 CS 252/Patterson Lec 6. 27

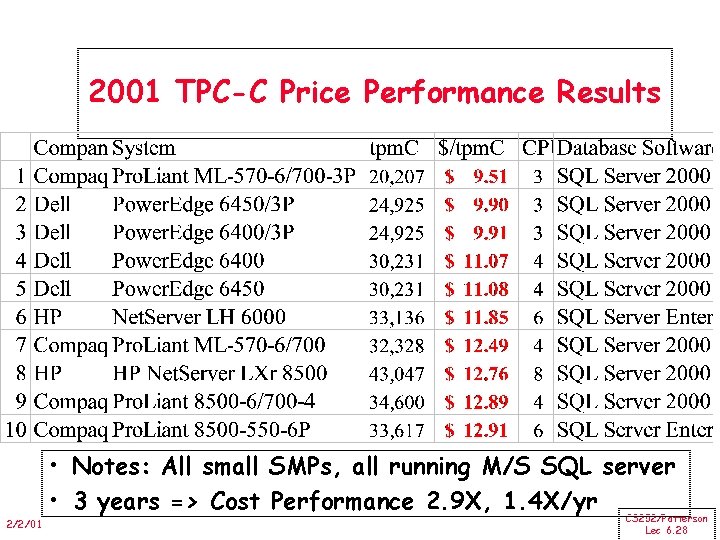
2001 TPC-C Price Performance Results • Notes: All small SMPs, all running M/S SQL server • 3 years => Cost Performance 2. 9 X, 1. 4 X/yr 2/2/01 CS 252/Patterson Lec 6. 28

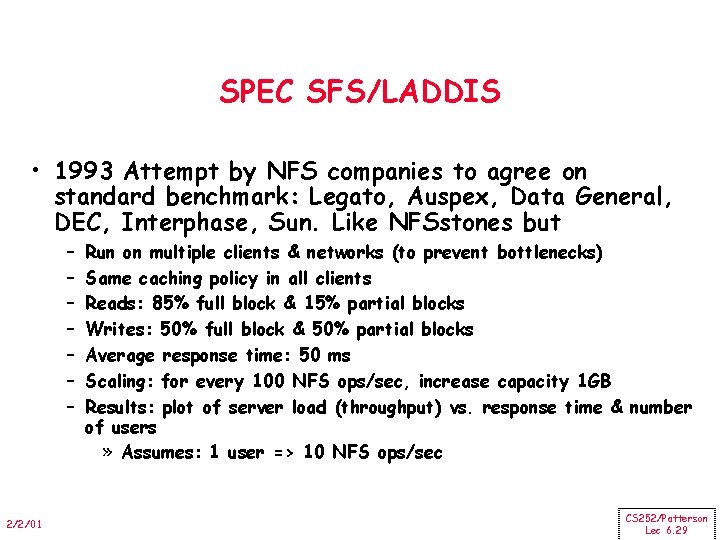
SPEC SFS/LADDIS • 1993 Attempt by NFS companies to agree on standard benchmark: Legato, Auspex, Data General, DEC, Interphase, Sun. Like NFSstones but – – – – 2/2/01 Run on multiple clients & networks (to prevent bottlenecks) Same caching policy in all clients Reads: 85% full block & 15% partial blocks Writes: 50% full block & 50% partial blocks Average response time: 50 ms Scaling: for every 100 NFS ops/sec, increase capacity 1 GB Results: plot of server load (throughput) vs. response time & number of users » Assumes: 1 user => 10 NFS ops/sec CS 252/Patterson Lec 6. 29

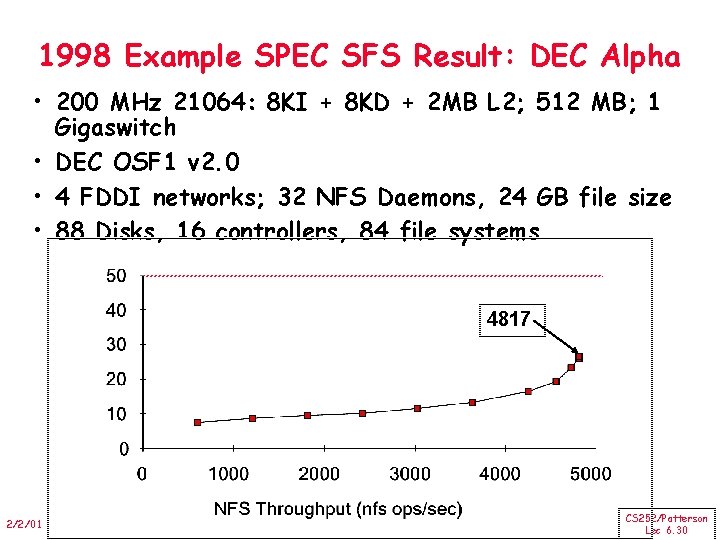
1998 Example SPEC SFS Result: DEC Alpha • 200 MHz 21064: 8 KI + 8 KD + 2 MB L 2; 512 MB; 1 Gigaswitch • DEC OSF 1 v 2. 0 • 4 FDDI networks; 32 NFS Daemons, 24 GB file size • 88 Disks, 16 controllers, 84 file systems 4817 2/2/01 CS 252/Patterson Lec 6. 30

SPEC sfs 97 for EMC Celera NFS servers: 2, 4, 8, 14 CPUs; 67, 133, 265, 433 disks 15, 700, 32, 000, 61, 800 104, 600 ops/sec 2/2/01 CS 252/Patterson Lec 6. 31

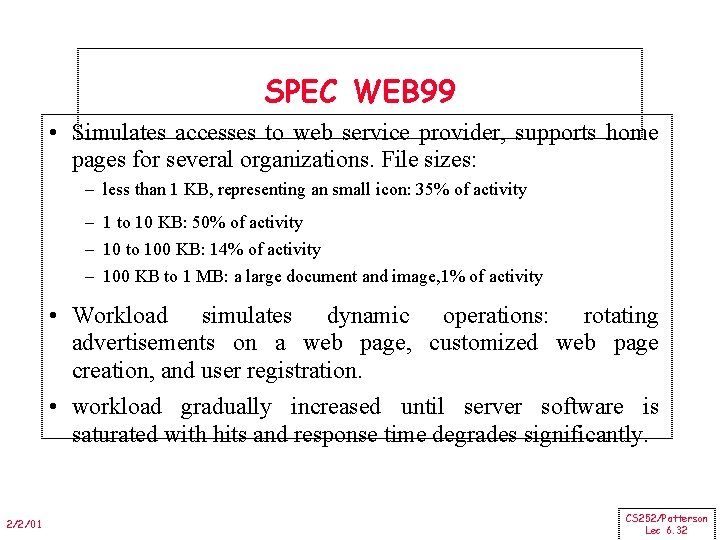
SPEC WEB 99 • Simulates accesses to web service provider, supports home pages for several organizations. File sizes: – less than 1 KB, representing an small icon: 35% of activity – 1 to 10 KB: 50% of activity – 10 to 100 KB: 14% of activity – 100 KB to 1 MB: a large document and image, 1% of activity • Workload simulates dynamic operations: rotating advertisements on a web page, customized web page creation, and user registration. • workload gradually increased until server software is saturated with hits and response time degrades significantly. 2/2/01 CS 252/Patterson Lec 6. 32

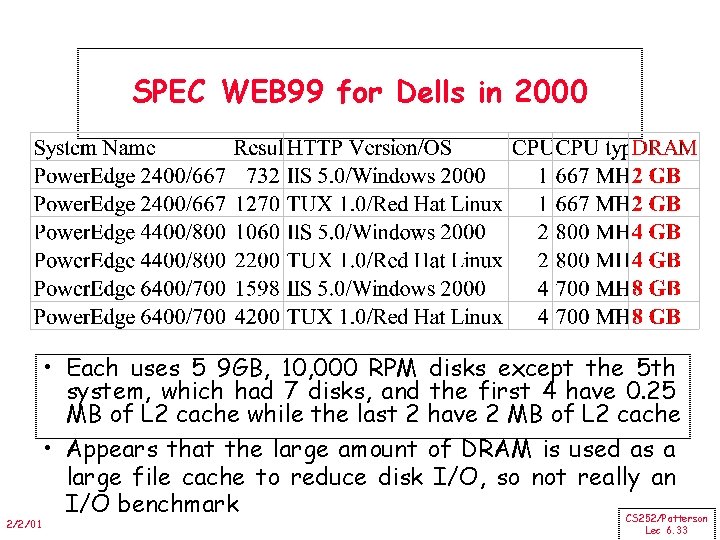
SPEC WEB 99 for Dells in 2000 2/2/01 • Each uses 5 9 GB, 10, 000 RPM disks except the 5 th system, which had 7 disks, and the first 4 have 0. 25 MB of L 2 cache while the last 2 have 2 MB of L 2 cache • Appears that the large amount of DRAM is used as a large file cache to reduce disk I/O, so not really an I/O benchmark CS 252/Patterson Lec 6. 33

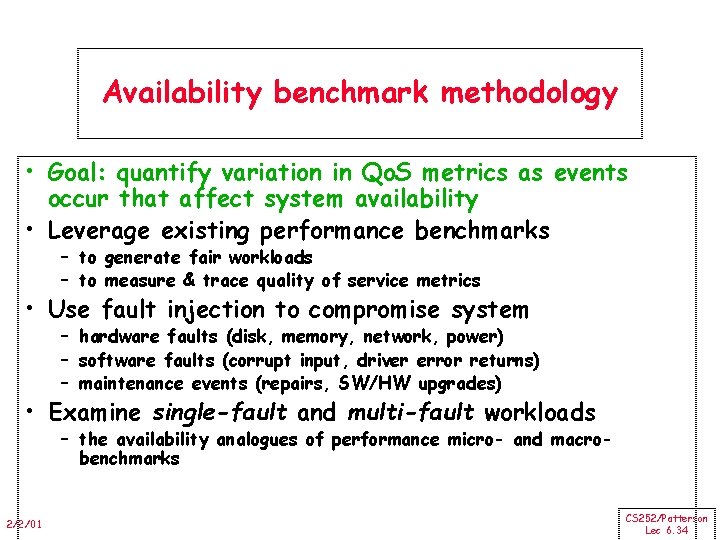
Availability benchmark methodology • Goal: quantify variation in Qo. S metrics as events occur that affect system availability • Leverage existing performance benchmarks – to generate fair workloads – to measure & trace quality of service metrics • Use fault injection to compromise system – hardware faults (disk, memory, network, power) – software faults (corrupt input, driver error returns) – maintenance events (repairs, SW/HW upgrades) • Examine single-fault and multi-fault workloads – the availability analogues of performance micro- and macrobenchmarks 2/2/01 CS 252/Patterson Lec 6. 34

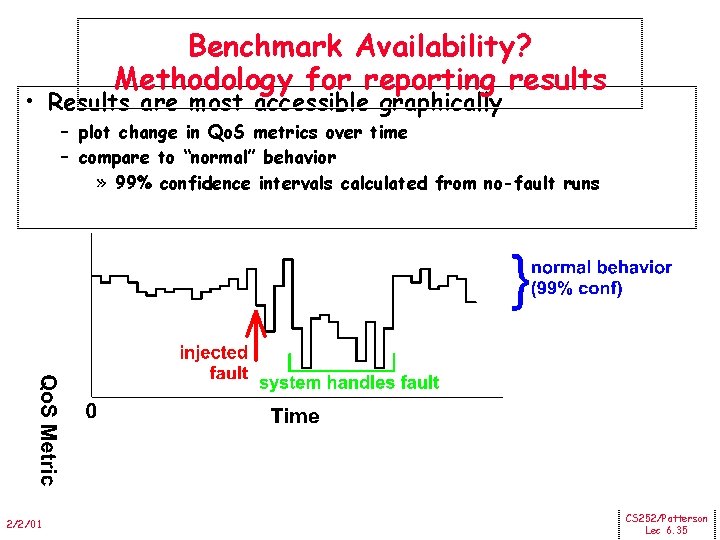
Benchmark Availability? Methodology for reporting results • Results are most accessible graphically – plot change in Qo. S metrics over time – compare to “normal” behavior » 99% confidence intervals calculated from no-fault runs 2/2/01 CS 252/Patterson Lec 6. 35

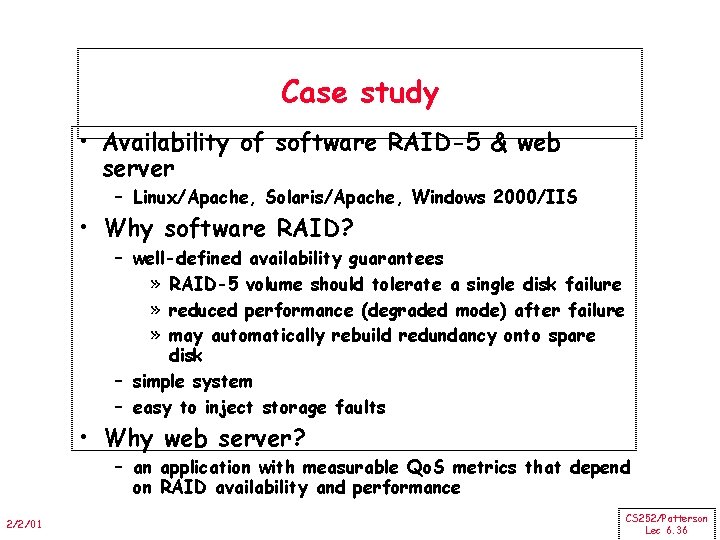
Case study • Availability of software RAID-5 & web server – Linux/Apache, Solaris/Apache, Windows 2000/IIS • Why software RAID? – well-defined availability guarantees » RAID-5 volume should tolerate a single disk failure » reduced performance (degraded mode) after failure » may automatically rebuild redundancy onto spare disk – simple system – easy to inject storage faults • Why web server? – an application with measurable Qo. S metrics that depend on RAID availability and performance 2/2/01 CS 252/Patterson Lec 6. 36

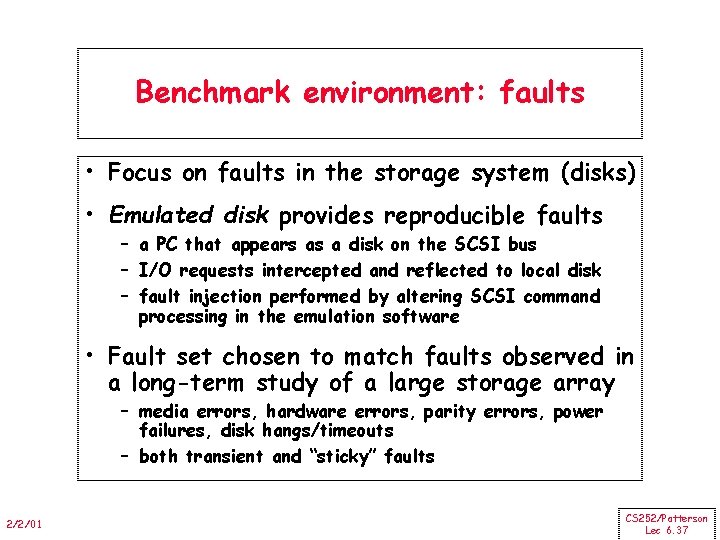
Benchmark environment: faults • Focus on faults in the storage system (disks) • Emulated disk provides reproducible faults – a PC that appears as a disk on the SCSI bus – I/O requests intercepted and reflected to local disk – fault injection performed by altering SCSI command processing in the emulation software • Fault set chosen to match faults observed in a long-term study of a large storage array – media errors, hardware errors, parity errors, power failures, disk hangs/timeouts – both transient and “sticky” faults 2/2/01 CS 252/Patterson Lec 6. 37

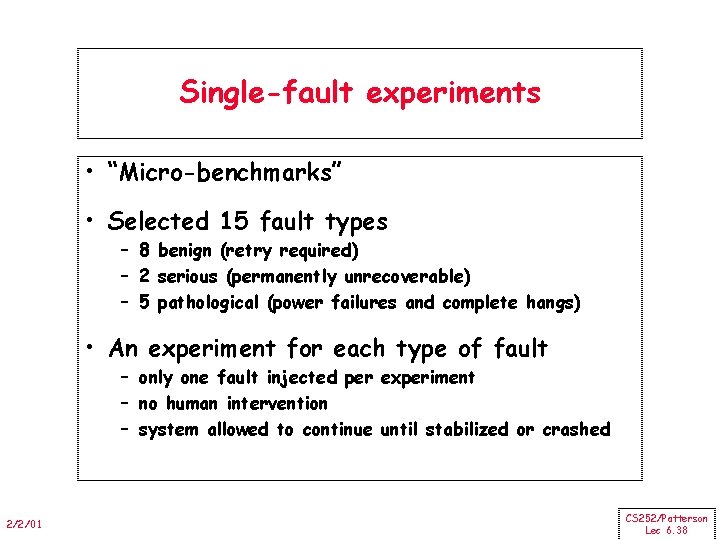
Single-fault experiments • “Micro-benchmarks” • Selected 15 fault types – 8 benign (retry required) – 2 serious (permanently unrecoverable) – 5 pathological (power failures and complete hangs) • An experiment for each type of fault – only one fault injected per experiment – no human intervention – system allowed to continue until stabilized or crashed 2/2/01 CS 252/Patterson Lec 6. 38

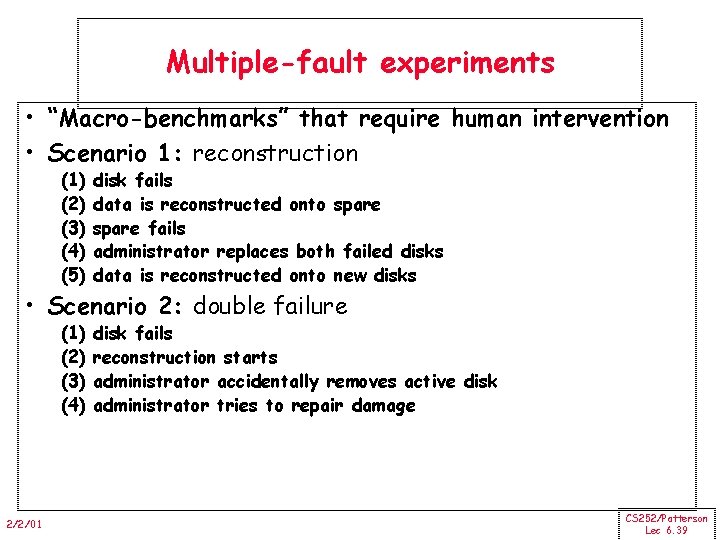
Multiple-fault experiments • “Macro-benchmarks” that require human intervention • Scenario 1: reconstruction (1) (2) (3) (4) (5) disk fails data is reconstructed onto spare fails administrator replaces both failed disks data is reconstructed onto new disks • Scenario 2: double failure (1) (2) (3) (4) 2/2/01 disk fails reconstruction starts administrator accidentally removes active disk administrator tries to repair damage CS 252/Patterson Lec 6. 39

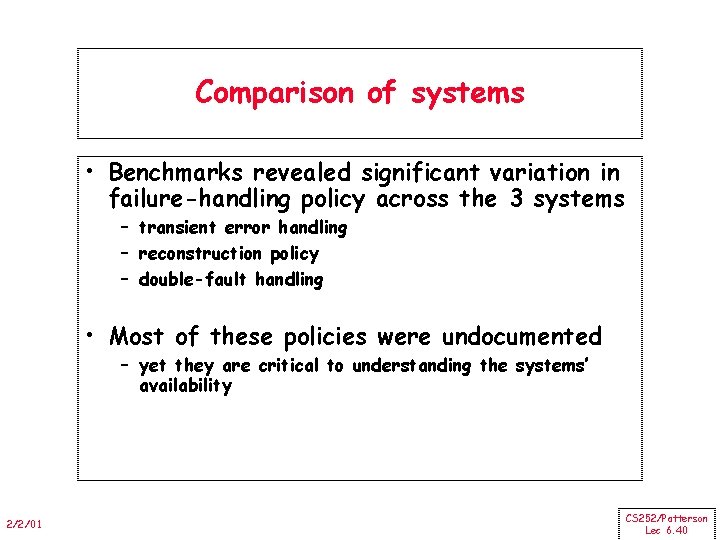
Comparison of systems • Benchmarks revealed significant variation in failure-handling policy across the 3 systems – transient error handling – reconstruction policy – double-fault handling • Most of these policies were undocumented – yet they are critical to understanding the systems’ availability 2/2/01 CS 252/Patterson Lec 6. 40

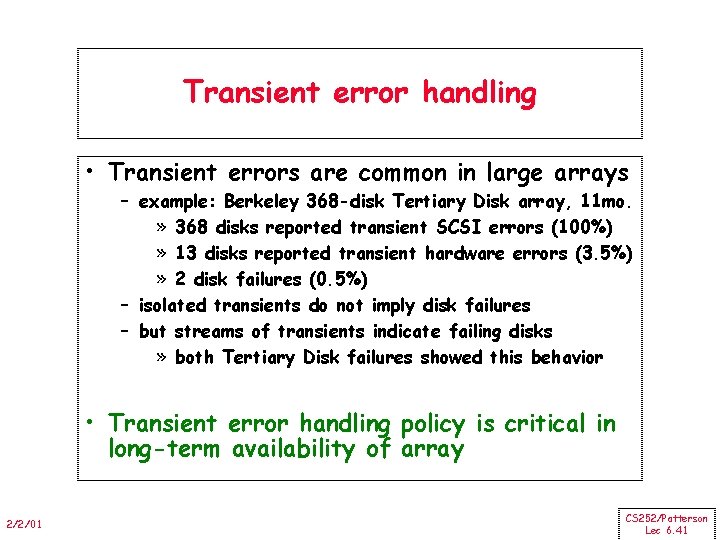
Transient error handling • Transient errors are common in large arrays – example: Berkeley 368 -disk Tertiary Disk array, 11 mo. » 368 disks reported transient SCSI errors (100%) » 13 disks reported transient hardware errors (3. 5%) » 2 disk failures (0. 5%) – isolated transients do not imply disk failures – but streams of transients indicate failing disks » both Tertiary Disk failures showed this behavior • Transient error handling policy is critical in long-term availability of array 2/2/01 CS 252/Patterson Lec 6. 41

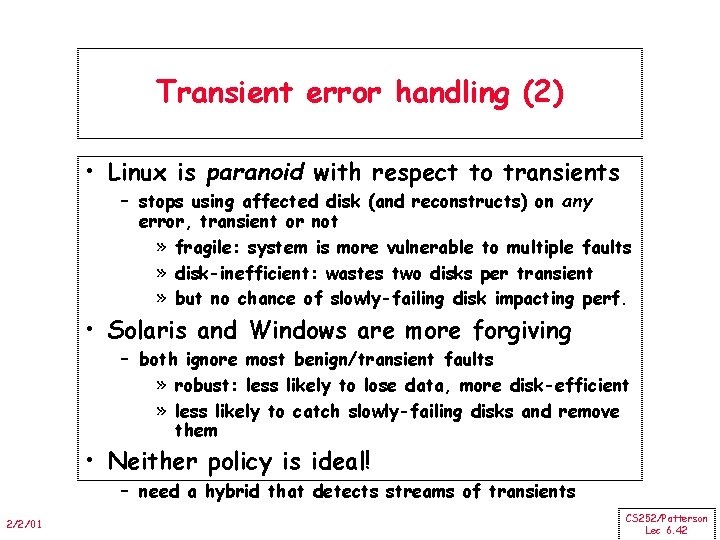
Transient error handling (2) • Linux is paranoid with respect to transients – stops using affected disk (and reconstructs) on any error, transient or not » fragile: system is more vulnerable to multiple faults » disk-inefficient: wastes two disks per transient » but no chance of slowly-failing disk impacting perf. • Solaris and Windows are more forgiving – both ignore most benign/transient faults » robust: less likely to lose data, more disk-efficient » less likely to catch slowly-failing disks and remove them • Neither policy is ideal! – need a hybrid that detects streams of transients 2/2/01 CS 252/Patterson Lec 6. 42

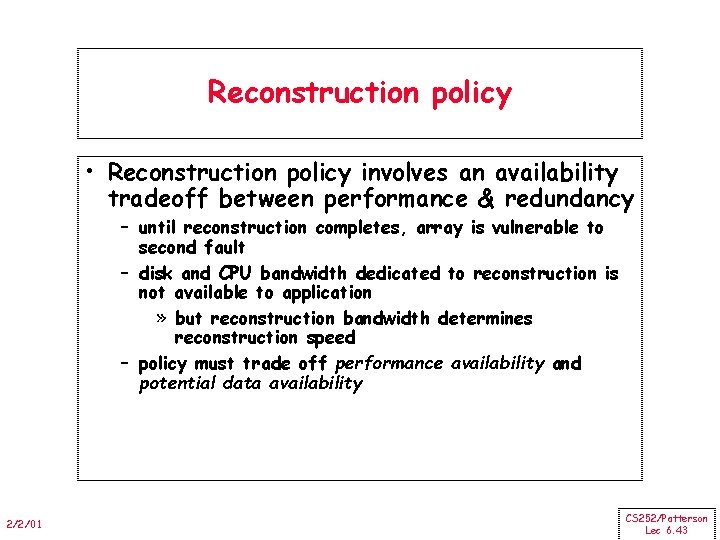
Reconstruction policy • Reconstruction policy involves an availability tradeoff between performance & redundancy – until reconstruction completes, array is vulnerable to second fault – disk and CPU bandwidth dedicated to reconstruction is not available to application » but reconstruction bandwidth determines reconstruction speed – policy must trade off performance availability and potential data availability 2/2/01 CS 252/Patterson Lec 6. 43

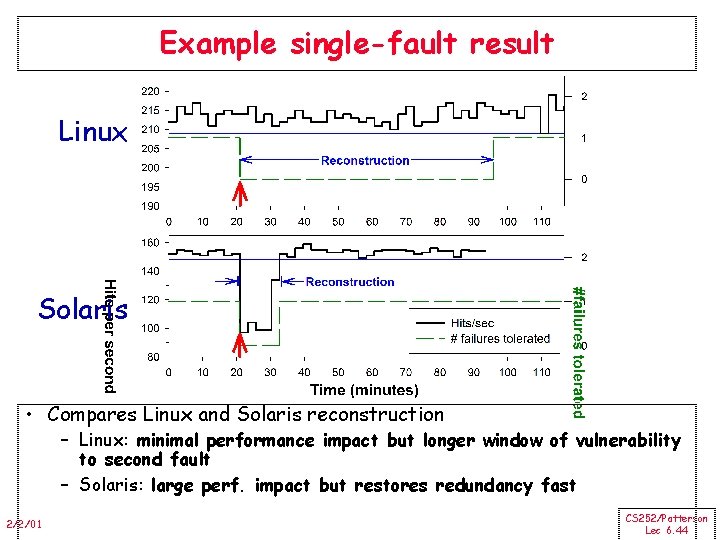
Example single-fault result Linux Solaris • Compares Linux and Solaris reconstruction – Linux: minimal performance impact but longer window of vulnerability to second fault – Solaris: large perf. impact but restores redundancy fast 2/2/01 CS 252/Patterson Lec 6. 44

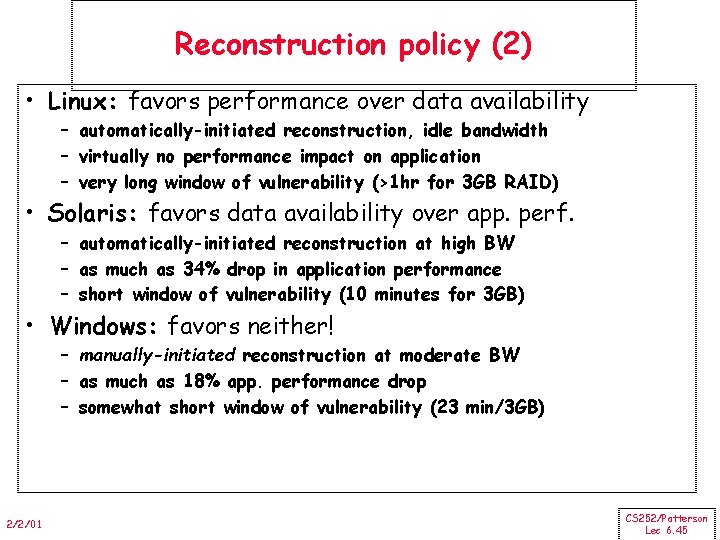
Reconstruction policy (2) • Linux: favors performance over data availability – automatically-initiated reconstruction, idle bandwidth – virtually no performance impact on application – very long window of vulnerability (>1 hr for 3 GB RAID) • Solaris: favors data availability over app. perf. – automatically-initiated reconstruction at high BW – as much as 34% drop in application performance – short window of vulnerability (10 minutes for 3 GB) • Windows: favors neither! – manually-initiated reconstruction at moderate BW – as much as 18% app. performance drop – somewhat short window of vulnerability (23 min/3 GB) 2/2/01 CS 252/Patterson Lec 6. 45

Double-fault handling • A double fault results in unrecoverable loss of some data on the RAID volume • Linux: blocked access to volume • Windows: blocked access to volume • Solaris: silently continued using volume, delivering fabricated data to application! – clear violation of RAID availability semantics – resulted in corrupted file system and garbage data at the application level – this undocumented policy has serious availability implications for applications 2/2/01 CS 252/Patterson Lec 6. 46

Availability Conclusions: Case study • RAID vendors should expose and document policies affecting availability – ideally should be user-adjustable • Availability benchmarks can provide valuable insight into availability behavior of systems – reveal undocumented availability policies – illustrate impact of specific faults on system behavior • We believe our approach can be generalized well beyond RAID and storage systems – the RAID case study is based on a general methodology 2/2/01 CS 252/Patterson Lec 6. 47

Conclusions: Availability benchmarks • Our methodology is best for understanding the availability behavior of a system – extensions are needed to distill results for automated system comparison • A good fault-injection environment is critical – need realistic, reproducible, controlled faults – system designers should consider building in hooks for fault-injection and availability testing • Measuring and understanding availability will be crucial in building systems that meet the needs of modern server applications – our benchmarking methodology is just the first step towards this important goal 2/2/01 CS 252/Patterson Lec 6. 48

Summary: I/O Benchmarks • Scaling to track technological change • TPC: price performance as nomalizing configuration feature • Auditing to ensure no foul play • Throughput with restricted response time is normal measure • Benchmarks to measure Availability, Maintainability? 2/2/01 CS 252/Patterson Lec 6. 49

Summary: A Little Queuing Theory System Queue Proc server IOC Device • Queuing models assume state of equilibrium: input rate = output rate • Notation: r Tser u Tq Tsys Lq Lsys average number of arriving customers/second average time to service a customer (tradtionally µ = 1/ Tser ) server utilization (0. . 1): u = r x Tser average time/customer in queue average time/customer in system: Tsys = Tq + Tser average length of queue: Lq = r x Tq average length of system : Lsys = r x Tsys • Little’s Law: Lengthsystem = rate x Timesystem (Mean number customers = arrival rate x mean service time) 2/2/01 CS 252/Patterson Lec 6. 50