Crosssectional studies Crosssectional study Examines the relationship between

Cross-sectional studies

Cross-sectional study § Examines the relationship between outcome and other variables of interest as they exist in a defined population § The presence or absence of disease and the other variables are determined at one particular time point

Design A cross-sectional study can be both descriptive and analytic Uses include: § To describe the distribution of disease or health status in a population § To generate an etiologic hypothesis § For disease surveillance § Explore associations between an exposure and outcome

Design Disease Status n n n Exposure Status Nature/subject/others assign exposure status Subjects are all persons in a given population at some point in time or a representative sample of the population Investigators ascertain present (i. e. , prevalent) DISEASE status and EXPOSURE status simultaneously

Design

Descriptive Design Cross sectional studies start with the population of interest, and then measure the outcome of interest at a single point in time POPULATION # WITH OUTCOME OR EXPOSURE REPRESENTATI VE SAMPLE IF NOT USING WHOLE POP # WITHOUT OUTCOME OR EXPOSURE Calculate prevalence of outcome or exposure in population Describe the frequency or level of an outcome (e. g. measure the prevalence of a disease in a population)

Analytic Design EXPOSED If exposures are measured, then a cross sectional study can measure whethere is an association between an exposure and an outcome # WITH OUTCOME AND WITH EXPOSURE # WITHOUT OUTCOME WITH EXPOSURE REPRESENTATIVE SAMPLE IF NOT USING WHOLE POPULATION UNEXPOSED #WITH OUTCOME AND WITHOUT EXPOSURE Calculate prevalence in exposed and in unexposed then calculate the prevalence ratio # WITHOUT OUTCOME AND WITHOUT EXPOSURE

Design Cross sectional descriptive Number of people in the population Number deaths from diarrheal diseases Cross sectional analytical Number of households with latrines Number deaths from diarrheal diseases in these houses Number of households without latrines Number deaths from diarrheal diseases in these houses

Data Output Prevalent Disease Yes No Total Exposure Yes a b a+b No c d c+d Total a+c b+d n Can estimate absolute risk, relative risk and odds ratios

A measure of association for cross-sectional data Exposed Not Exposed Disease a c No Disease b d Odds ratio = (a/b) / (c/d) = ad/bc Relative risk = (a/a+b) / (c/c+d) “Exposure” and “disease” can represent any characteristic of interest.

Choosing this design § Practical study design to examine: àDiseases of long duration àBiological characteristics that do not change over time àNot good for diseases with periods of exacerbation and remission § Good for generating hypotheses about exposure-disease relations. § Data are collected on an individual level.

Choosing this design Strengths § Can quantify the frequency of an outcome in a population § Can be (but not always) relatively low resource studies § Relatively quick to get results, as you do not have to wait for an outcome to occur Weaknesses § Cannot establish causality § Risk of bias if participants are different from nonparticipants § Cannot measure the incidence of an outcome/disease § Subject to confounding

Hypothetical Example § You conduct a survey of people in Stockholm who were selected at random. § You ask whether or not they have a history of clinical depression. § You also ask questions about demographic and socioeconomic factors. You find that people in low social classes are more likely to have clinical depression than those is high social classes.

Bias in cross-sectional survey § Non-response bias § Recall bias § Measurement bias § Interviewer bias

Prevention of bias § To use a measure instrument with high accuracy § To employ standardized criteria for disease diagnosis or measurement of exposure status § To train interviewers and to standardize the interview procedures

Quick Quiz! § Which of these statements would be reasonable to make from a cross-sectional study: à There is an association between having a chronic illness and reporting symptoms of depression à Having a chronic illness results in higher rates of depression à The risk of depression was 42% higher in those with a chronic illness than those without (RR: 1. 42) à The incidence of depression was 0. 8 per 100 person years

Ecological Studies

Definition § Compare measurements of two or more aggregated characteristics within a defined population. § The unit of observation is a group of people (or a population) rather than an individual.

Design n No formal procedure of random assignment n Units of observation: groups of people n n n DISEASE frequency in each group is compared (correlated) with EXPOSURE frequency Exposure can be measured using an overall index within the population under study Analyses can correlate changes over time in disease rates and exposure at the group level

Choosing this design: § Analysis can often be conducted from existing data § Can reveal patterns that form the basis for developing hypotheses § Only way to deal with environmental or group level variability in health outcomes § Data on exposure and/or disease are summary group measures à an individual’s characteristics for one or more factors are not measured and are not known à Can account for BETWEEN group variability, but not WITHIN group variability

Ecological Fallacy Potential confounding factors at the individual level cannot be taken into account à The association being evaluated may result from some unmeasured individual level variability

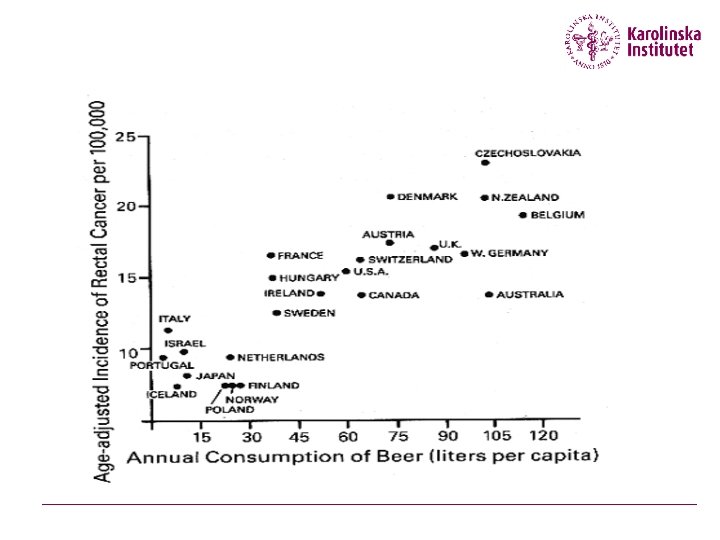
Ecological Fallacy

Ecological Fallacy § Communities with higher median income could have higher death rates of CHD. Does this mean individuals with higher incomes die from CHD more than those with lower incomes?

Summary § Both cross-sectional and ecological studies can be descriptive or analytic § Both have advantages of being (typically) efficient study designs to conduct § However, key biases need to be considered and causality cannot be assigned with these study designs § RR and OR can be calculated from analytic crosssectional studies
- Slides: 25