
Crop Market Outlook ProAg Meeting Sheldon and Cherokee

- Slides: 28
Crop Market Outlook Pro-Ag Meeting Sheldon and Cherokee, Iowa Nov. 2, 2012 Chad Hart Associate Professor/Grain Markets Specialist chart@iastate. edu 515 -294 -9911 Extension and Outreach/Department of Economics
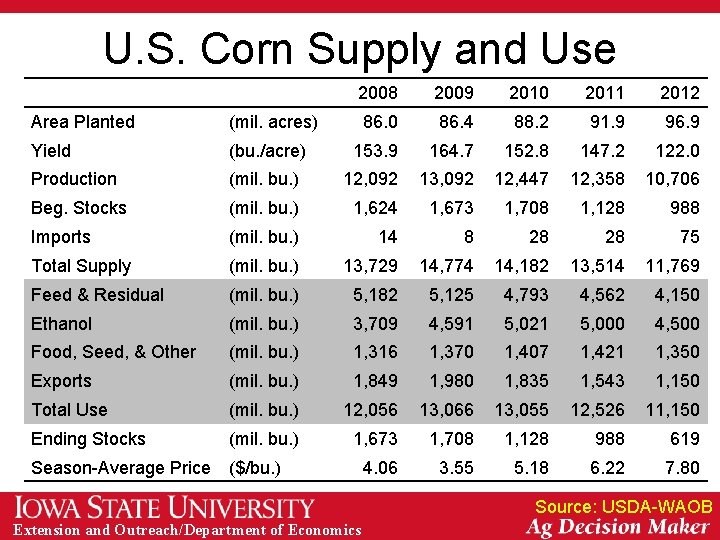
U. S. Corn Supply and Use 2008 2009 2010 2011 2012 86. 0 86. 4 88. 2 91. 9 96. 9 Area Planted (mil. acres) Yield (bu. /acre) 153. 9 164. 7 152. 8 147. 2 122. 0 Production (mil. bu. ) 12, 092 13, 092 12, 447 12, 358 10, 706 Beg. Stocks (mil. bu. ) 1, 624 1, 673 1, 708 1, 128 988 Imports (mil. bu. ) 14 8 28 28 75 Total Supply (mil. bu. ) 13, 729 14, 774 14, 182 13, 514 11, 769 Feed & Residual (mil. bu. ) 5, 182 5, 125 4, 793 4, 562 4, 150 Ethanol (mil. bu. ) 3, 709 4, 591 5, 021 5, 000 4, 500 Food, Seed, & Other (mil. bu. ) 1, 316 1, 370 1, 407 1, 421 1, 350 Exports (mil. bu. ) 1, 849 1, 980 1, 835 1, 543 1, 150 Total Use (mil. bu. ) 12, 056 13, 066 13, 055 12, 526 11, 150 Ending Stocks (mil. bu. ) 1, 673 1, 708 1, 128 988 619 4. 06 3. 55 5. 18 6. 22 7. 80 Season-Average Price ($/bu. ) Source: USDA-WAOB Extension and Outreach/Department of Economics
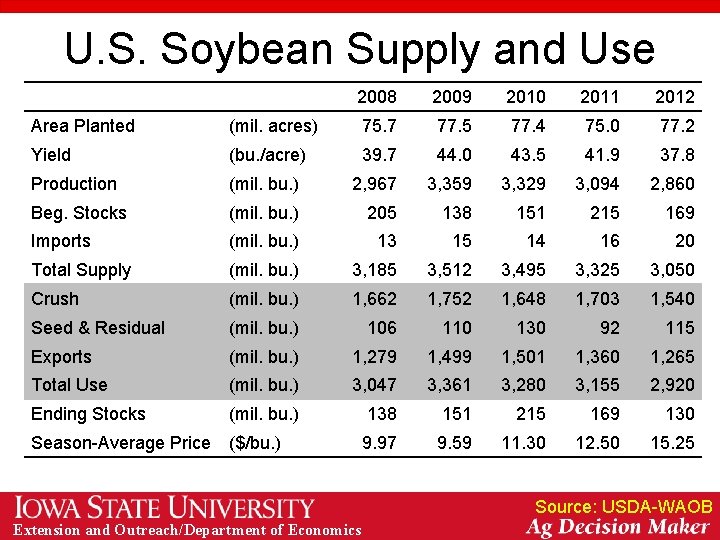
U. S. Soybean Supply and Use 2008 2009 2010 2011 2012 Area Planted (mil. acres) 75. 7 77. 5 77. 4 75. 0 77. 2 Yield (bu. /acre) 39. 7 44. 0 43. 5 41. 9 37. 8 Production (mil. bu. ) 2, 967 3, 359 3, 329 3, 094 2, 860 Beg. Stocks (mil. bu. ) 205 138 151 215 169 Imports (mil. bu. ) 13 15 14 16 20 Total Supply (mil. bu. ) 3, 185 3, 512 3, 495 3, 325 3, 050 Crush (mil. bu. ) 1, 662 1, 752 1, 648 1, 703 1, 540 Seed & Residual (mil. bu. ) 106 110 130 92 115 Exports (mil. bu. ) 1, 279 1, 499 1, 501 1, 360 1, 265 Total Use (mil. bu. ) 3, 047 3, 361 3, 280 3, 155 2, 920 Ending Stocks (mil. bu. ) 138 151 215 169 130 9. 97 9. 59 11. 30 12. 50 15. 25 Season-Average Price ($/bu. ) Source: USDA-WAOB Extension and Outreach/Department of Economics
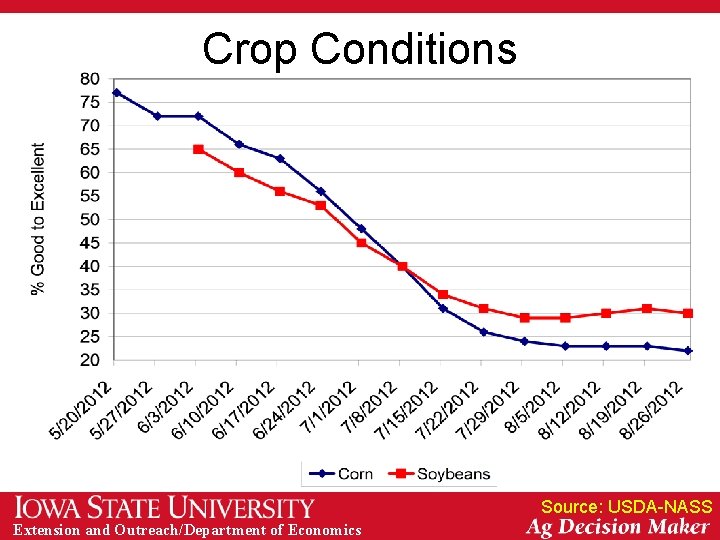
Crop Conditions Source: USDA-NASS Extension and Outreach/Department of Economics
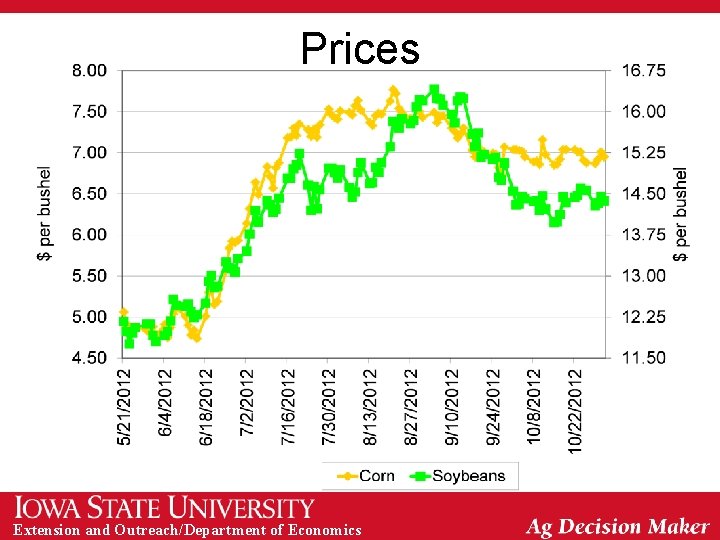
Prices Extension and Outreach/Department of Economics
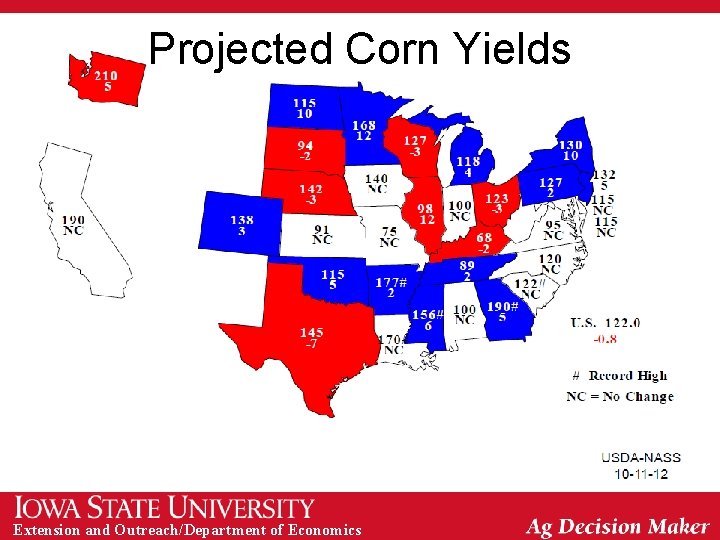
Projected Corn Yields Extension and Outreach/Department of Economics
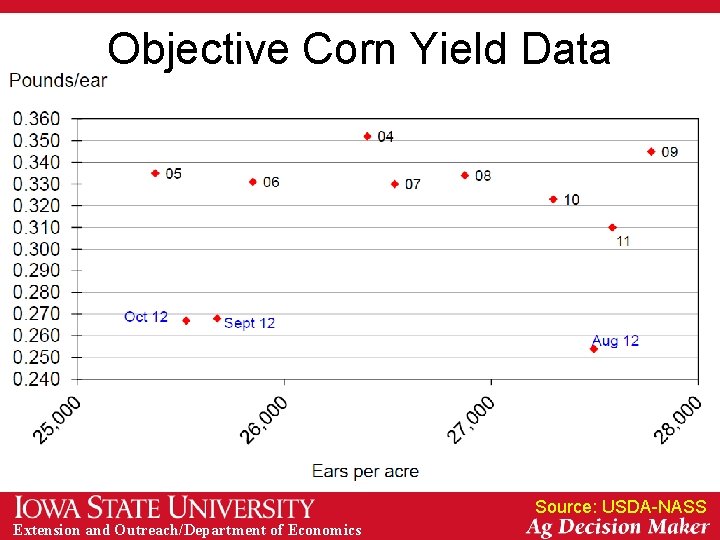
Objective Corn Yield Data Source: USDA-NASS Extension and Outreach/Department of Economics
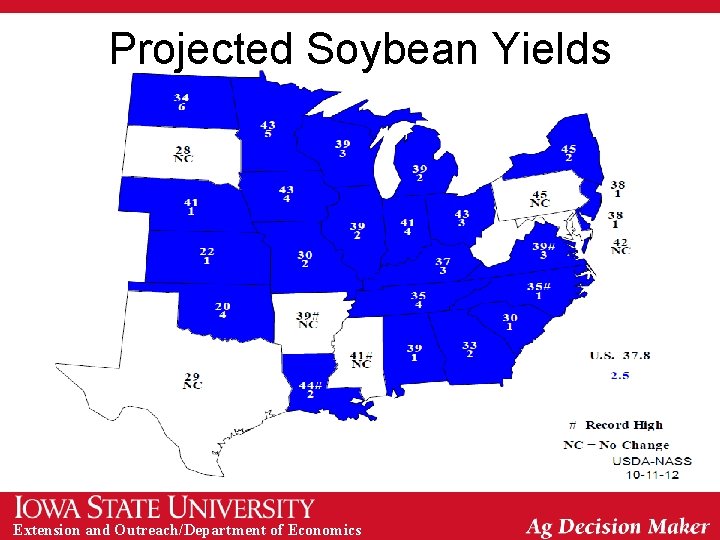
Projected Soybean Yields Extension and Outreach/Department of Economics
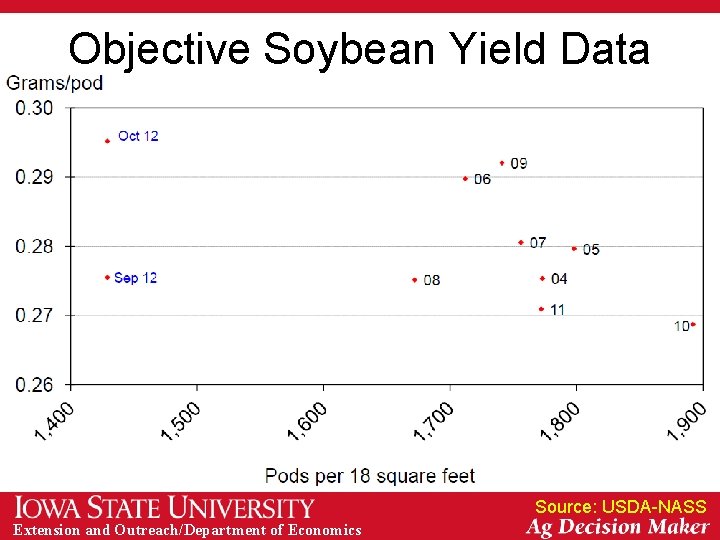
Objective Soybean Yield Data Source: USDA-NASS Extension and Outreach/Department of Economics
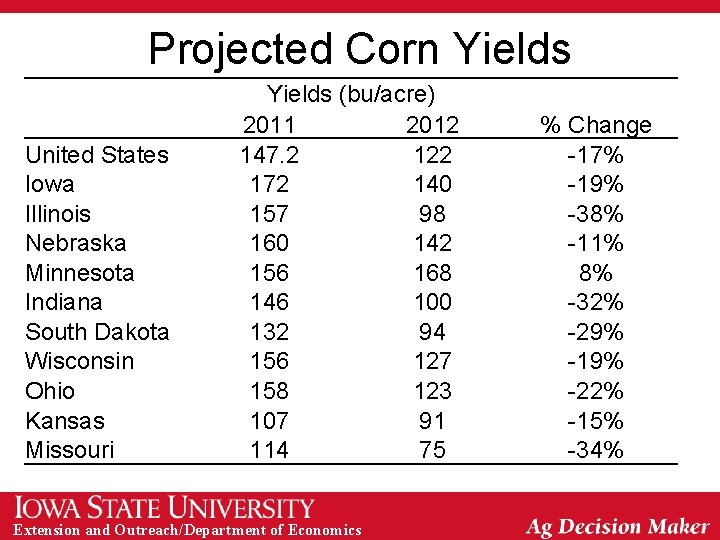
Projected Corn Yields United States Iowa Illinois Nebraska Minnesota Indiana South Dakota Wisconsin Ohio Kansas Missouri Yields (bu/acre) 2011 2012 147. 2 122 172 140 157 98 160 142 156 168 146 100 132 94 156 127 158 123 107 91 114 75 Extension and Outreach/Department of Economics % Change -17% -19% -38% -11% 8% -32% -29% -19% -22% -15% -34%
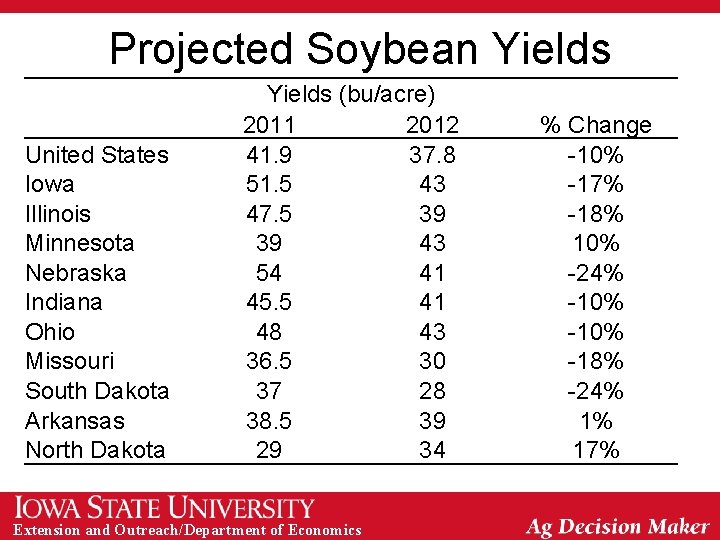
Projected Soybean Yields United States Iowa Illinois Minnesota Nebraska Indiana Ohio Missouri South Dakota Arkansas North Dakota Yields (bu/acre) 2011 2012 41. 9 37. 8 51. 5 43 47. 5 39 39 43 54 41 45. 5 41 48 43 36. 5 30 37 28 38. 5 39 29 34 Extension and Outreach/Department of Economics % Change -10% -17% -18% 10% -24% -10% -18% -24% 1% 17%
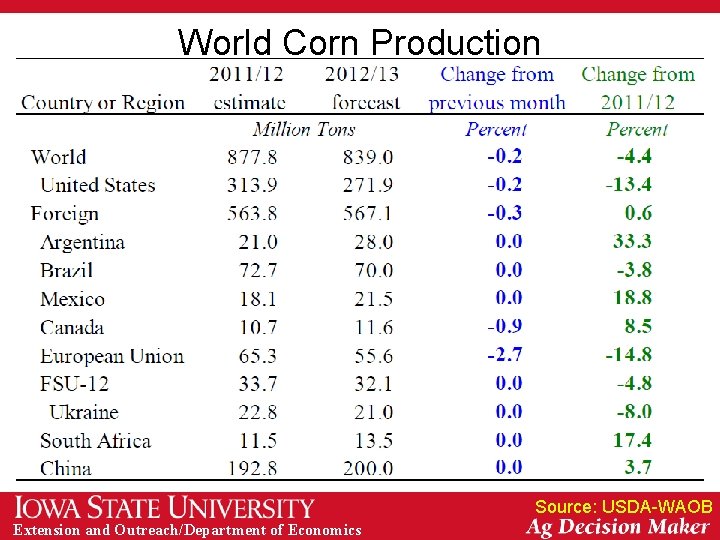
World Corn Production Source: USDA-WAOB Extension and Outreach/Department of Economics
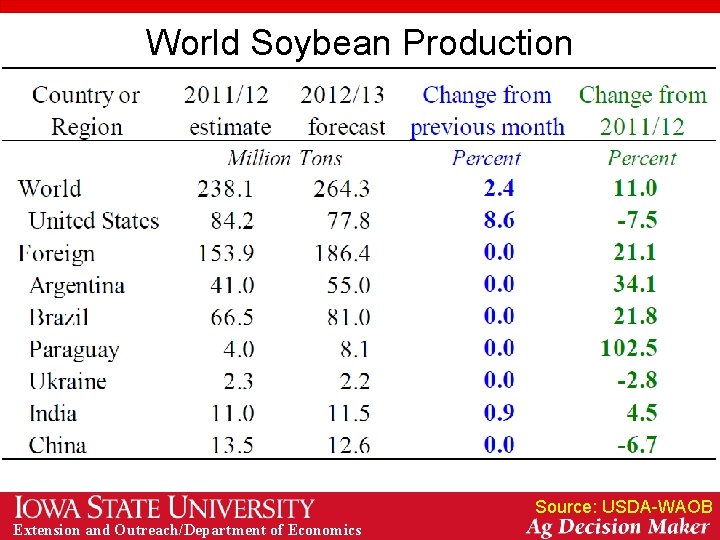
World Soybean Production Source: USDA-WAOB Extension and Outreach/Department of Economics
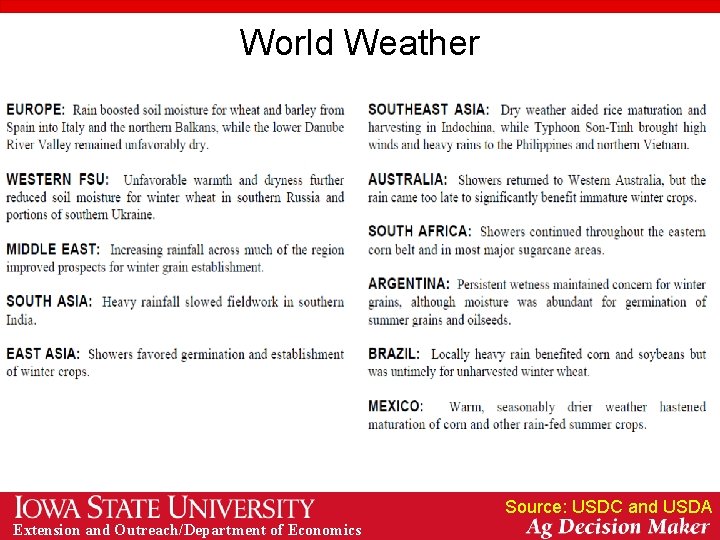
World Weather Source: USDC and USDA Extension and Outreach/Department of Economics
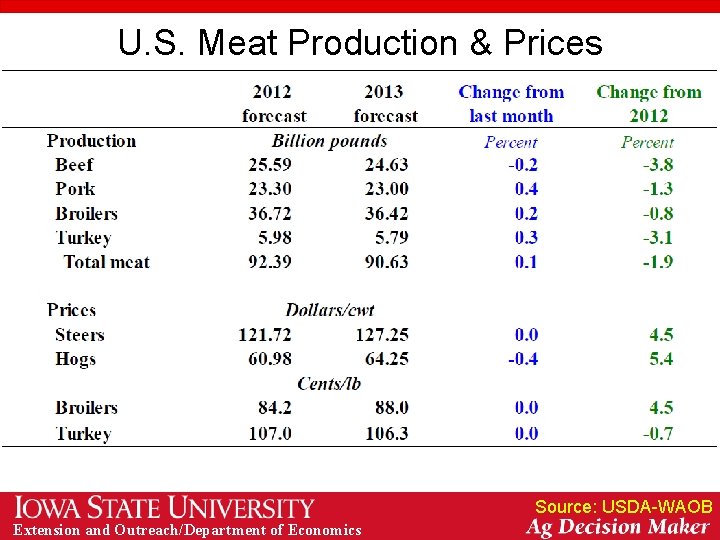
U. S. Meat Production & Prices Source: USDA-WAOB Extension and Outreach/Department of Economics
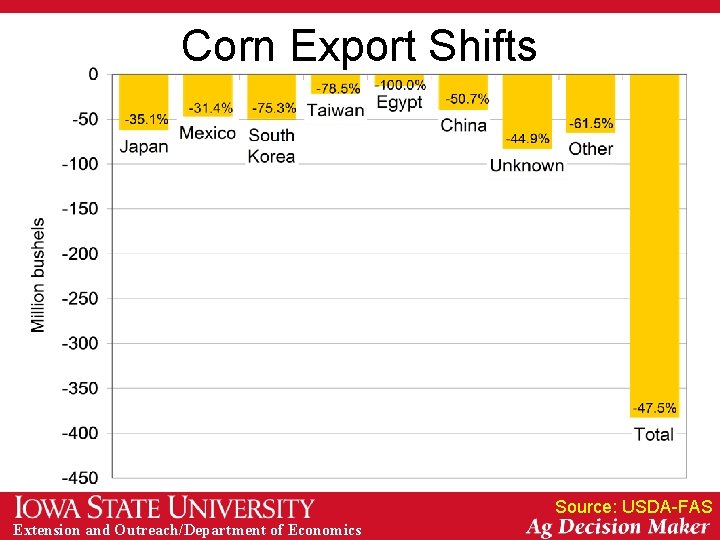
Corn Export Shifts Source: USDA-FAS Extension and Outreach/Department of Economics
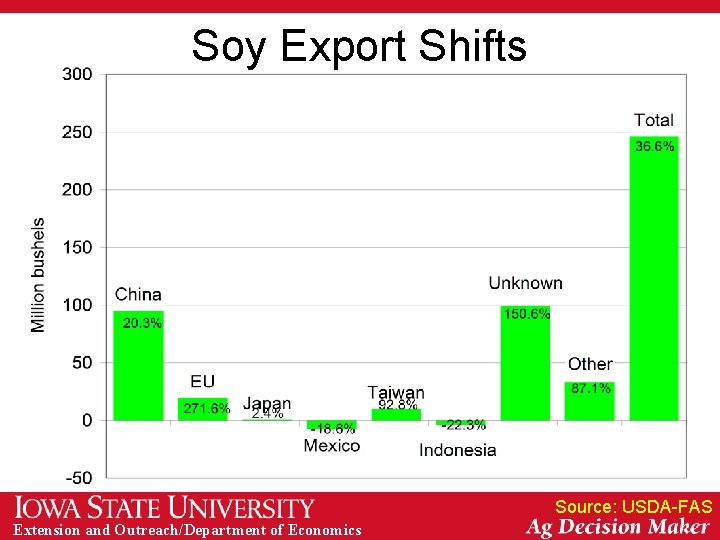
Soy Export Shifts Source: USDA-FAS Extension and Outreach/Department of Economics
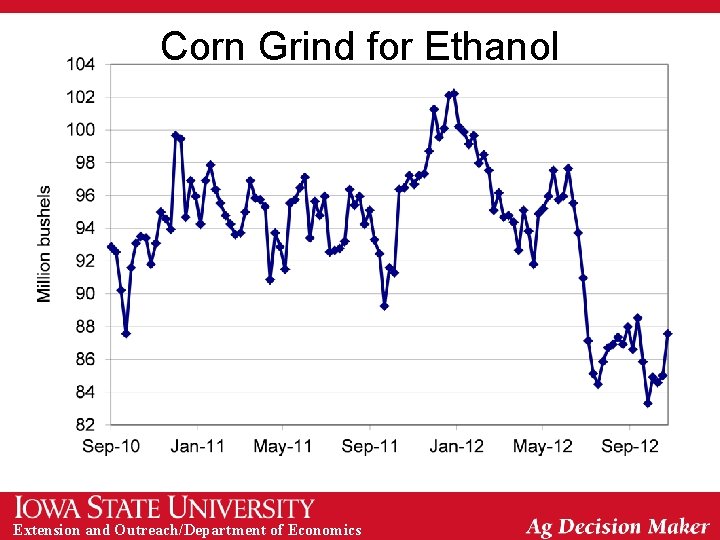
Corn Grind for Ethanol Extension and Outreach/Department of Economics
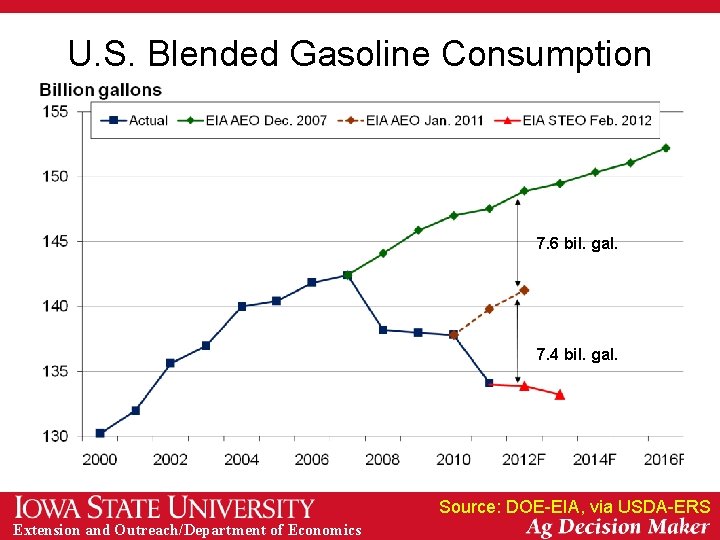
U. S. Blended Gasoline Consumption 7. 6 bil. gal. 7. 4 bil. gal. Source: DOE-EIA, via USDA-ERS Extension and Outreach/Department of Economics
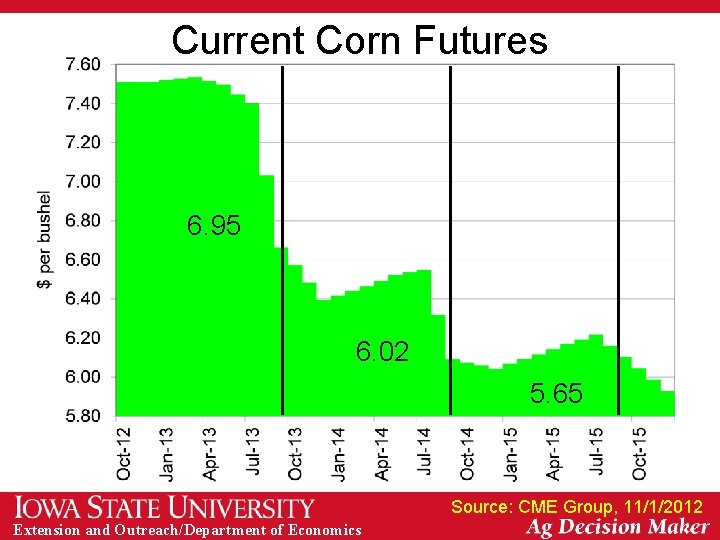
Current Corn Futures 6. 95 6. 02 5. 65 Source: CME Group, 11/1/2012 Extension and Outreach/Department of Economics
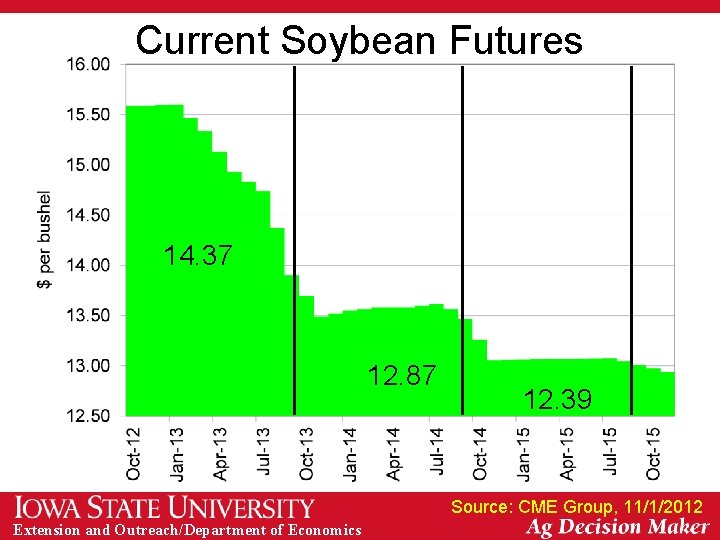
Current Soybean Futures 14. 37 12. 87 12. 39 Source: CME Group, 11/1/2012 Extension and Outreach/Department of Economics
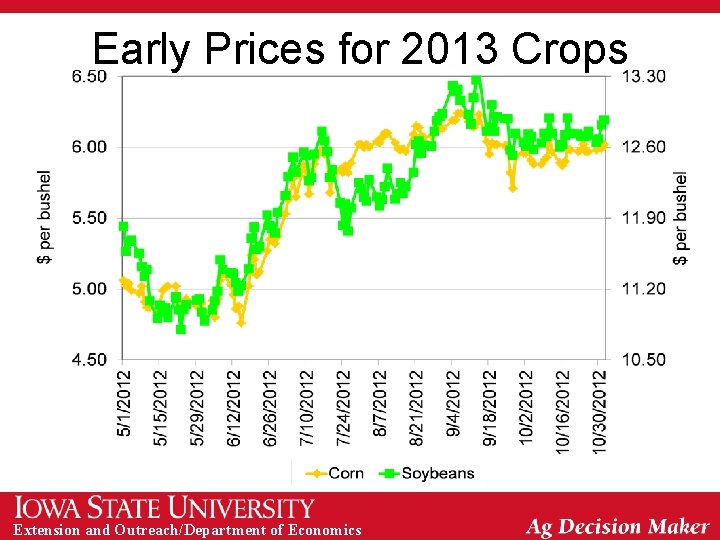
Early Prices for 2013 Crops Extension and Outreach/Department of Economics
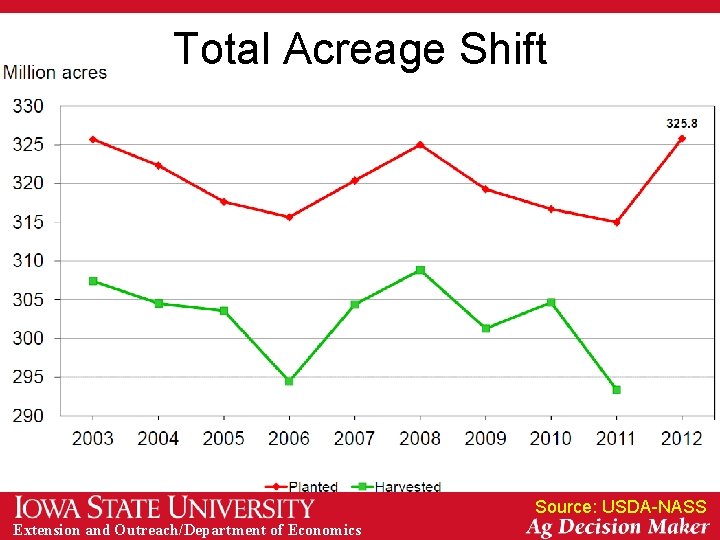
Total Acreage Shift Source: USDA-NASS Extension and Outreach/Department of Economics
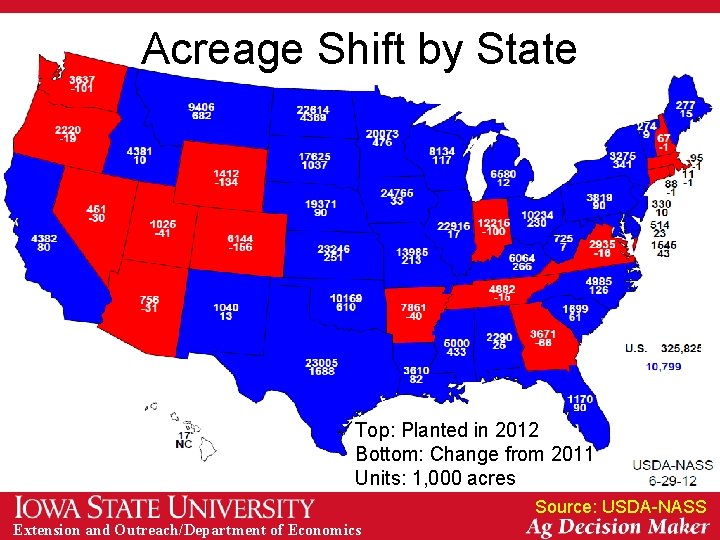
Acreage Shift by State Top: Planted in 2012 Bottom: Change from 2011 Units: 1, 000 acres Source: USDA-NASS Extension and Outreach/Department of Economics
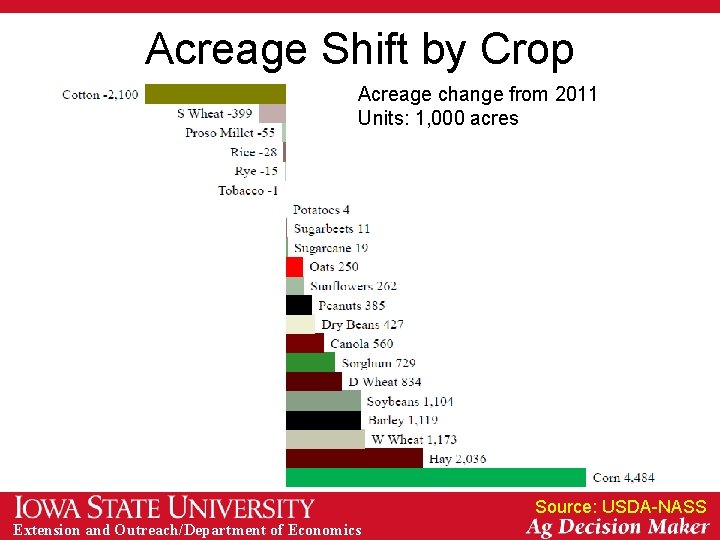
Acreage Shift by Crop Acreage change from 2011 Units: 1, 000 acres Source: USDA-NASS Extension and Outreach/Department of Economics
Extension and Outreach/Department of Economics
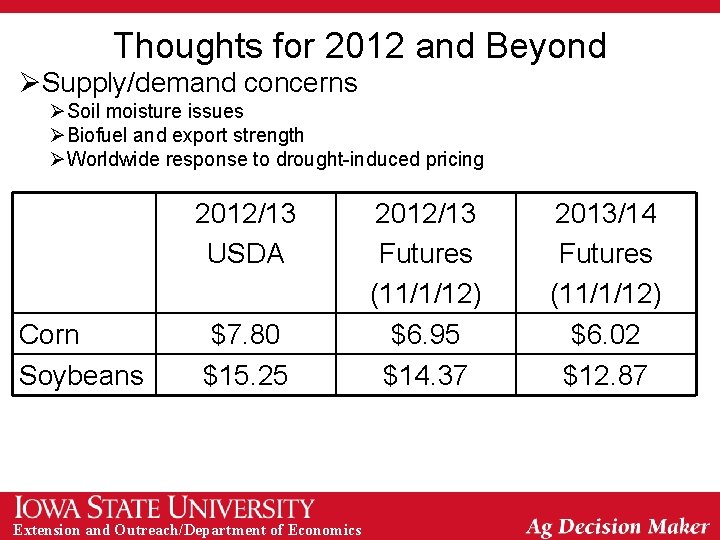
Thoughts for 2012 and Beyond ØSupply/demand concerns ØSoil moisture issues ØBiofuel and export strength ØWorldwide response to drought-induced pricing 2012/13 USDA Corn Soybeans $7. 80 $15. 25 Extension and Outreach/Department of Economics 2012/13 Futures (11/1/12) $6. 95 $14. 37 2013/14 Futures (11/1/12) $6. 02 $12. 87
Thank you for your time! Any questions? My web site: http: //www. econ. iastate. edu/~chart/ Iowa Farm Outlook: http: //www. econ. iastate. edu/ifo/ Ag Decision Maker: http: //www. extension. iastate. edu/agdm/ Extension and Outreach/Department of Economics