
Critiquing for Evidencebased Practice Diagnostic and Screening Tests
Critiquing for Evidence-based Practice: Diagnostic and Screening Tests M 8120 Columbia University Fall 2001 Suzanne Bakken, RN, DNSc
Overview z. Probability fundamentals z. Clinical role of probability revision z. Characterizing new information (test performance) z. Probability revision methods – Bayes’ formula – Contingency table z. In class exercises
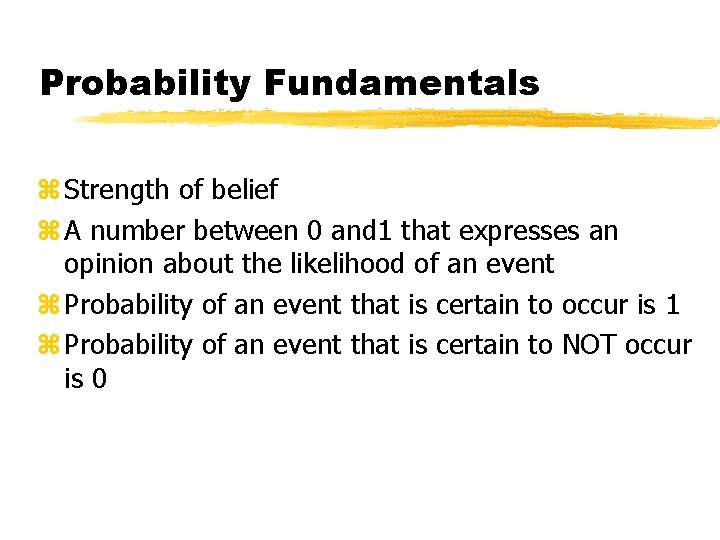
Probability Fundamentals z Strength of belief z A number between 0 and 1 that expresses an opinion about the likelihood of an event z Probability of an event that is certain to occur is 1 z Probability of an event that is certain to NOT occur is 0
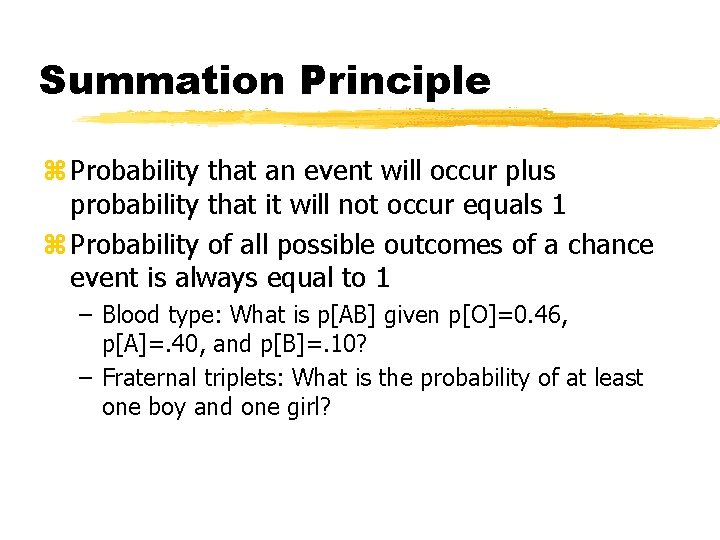
Summation Principle z Probability that an event will occur plus probability that it will not occur equals 1 z Probability of all possible outcomes of a chance event is always equal to 1 – Blood type: What is p[AB] given p[O]=0. 46, p[A]=. 40, and p[B]=. 10? – Fraternal triplets: What is the probability of at least one boy and one girl?
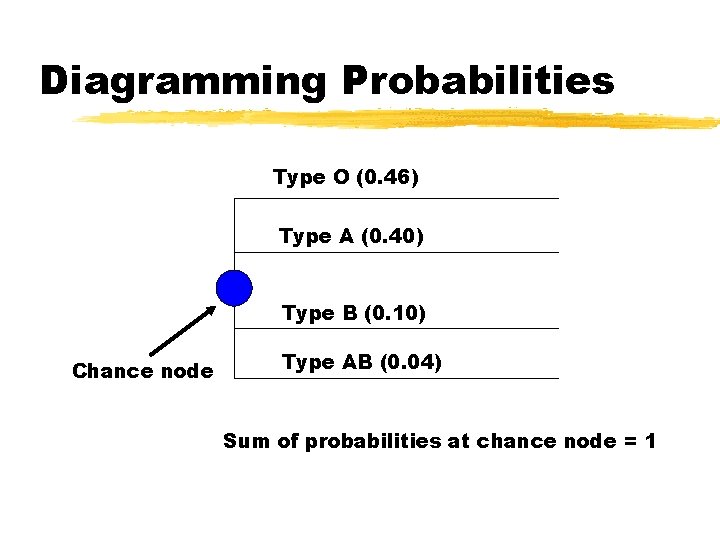
Diagramming Probabilities Type O (0. 46) Type A (0. 40) Type B (0. 10) Chance node Type AB (0. 04) Sum of probabilities at chance node = 1
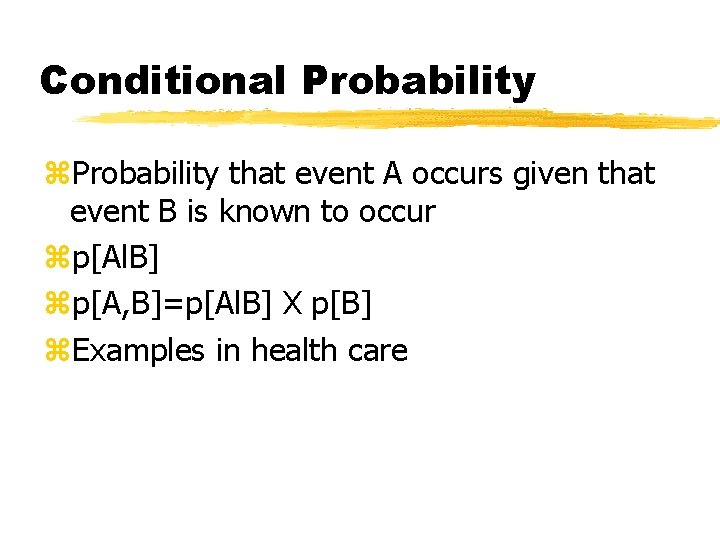
Conditional Probability z. Probability that event A occurs given that event B is known to occur zp[Al. B] zp[A, B]=p[Al. B] X p[B] z. Examples in health care
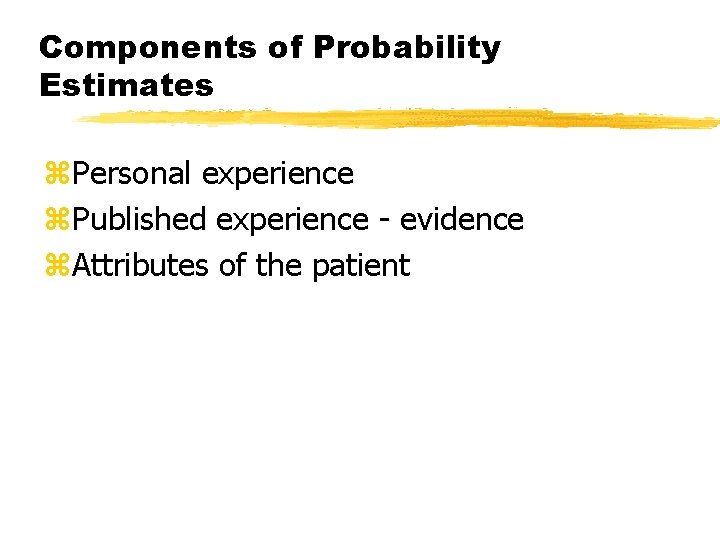
Components of Probability Estimates z. Personal experience z. Published experience - evidence z. Attributes of the patient
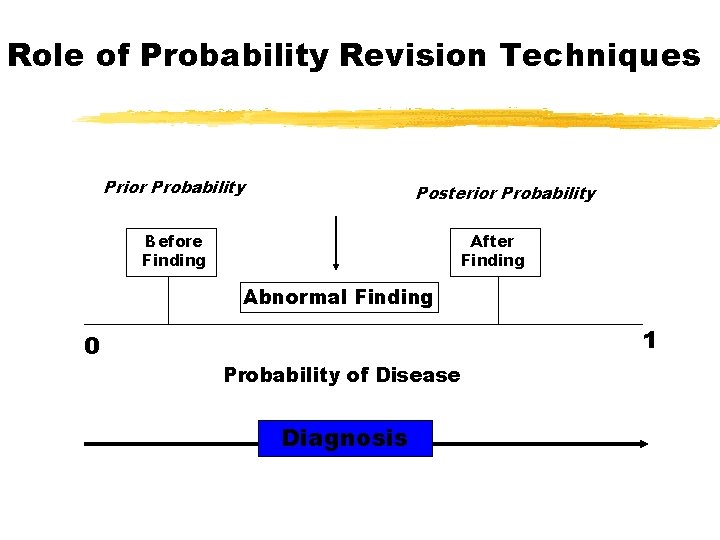
Role of Probability Revision Techniques Prior Probability Posterior Probability Before Finding After Finding Abnormal Finding 0 1 Probability of Disease Diagnosis
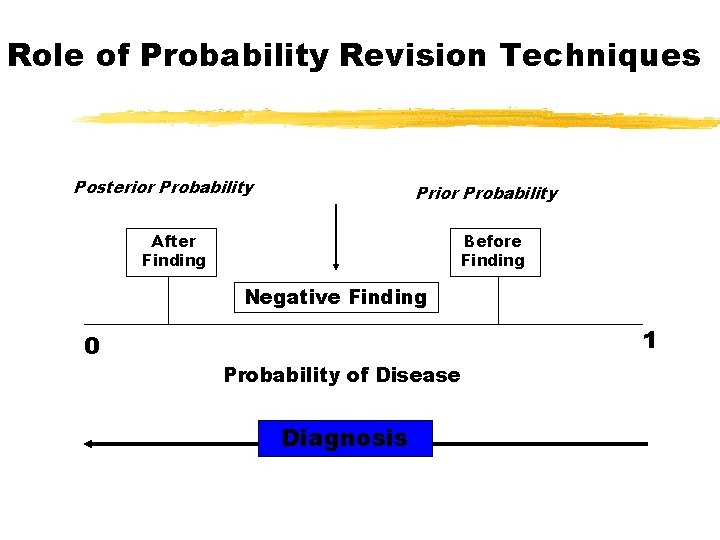
Role of Probability Revision Techniques Posterior Probability Prior Probability After Finding Before Finding Negative Finding 0 1 Probability of Disease Diagnosis
Findings z. Signs z. Symptoms z. Diagnostic tests z. Probabilistic relationships between findings and disease basis of diagnostic decision support systems – Dxplain – QMR – Iliad
Definitions z. Prior probability - the probability of an event before new information (finding) is acquired; pretest probability or risk z. Posterior probability - the probability of an event after new information (finding) is acquired; posttest probability or risk z. Probability revision - taking new information into account by converting prior probability to posterior probability
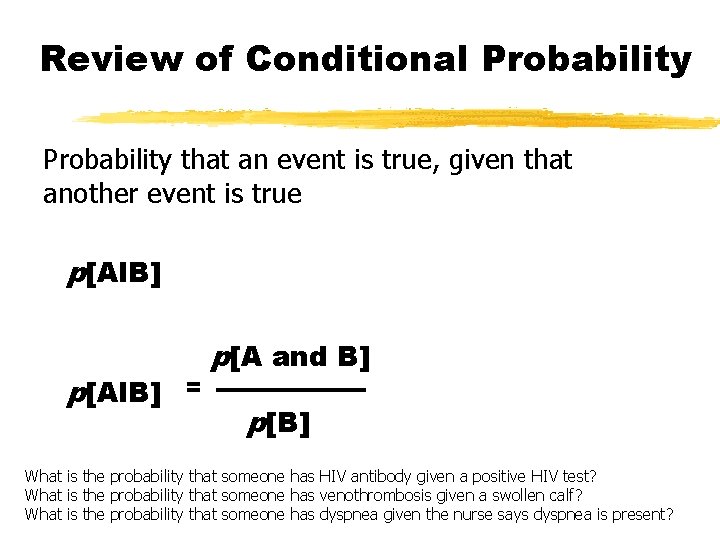
Review of Conditional Probability that an event is true, given that another event is true p[Al. B] = p[A and B] p[B] What is the probability that someone has HIV antibody given a positive HIV test? What is the probability that someone has venothrombosis given a swollen calf? What is the probability that someone has dyspnea given the nurse says dyspnea is present?
Characterizing “Test” Performance z. Compare test against gold standard (e. g. , presence of disease; established test) z. Ideal test - no values at which the distribution of those with the disease and without the disease overlap z. Few tests ideal so … – – TP TN FP FN
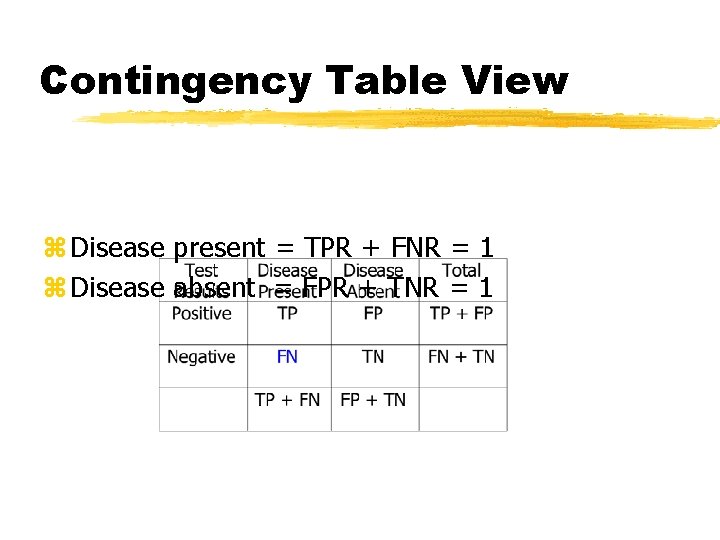
Test Performance z True positive rate (TPR) p[+l. D] = probability of an abnormal test result given that the disease is present; the number of persons WITH the disease who have an abnormal test result divided by the number of persons WITH the disease; sensitivity
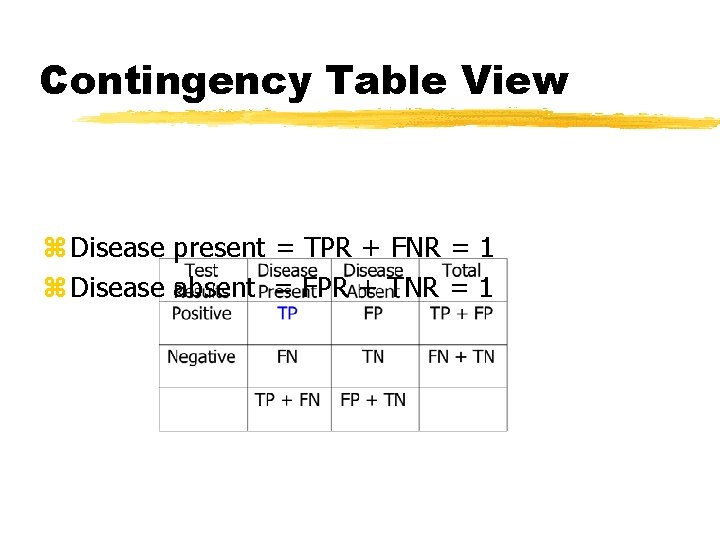
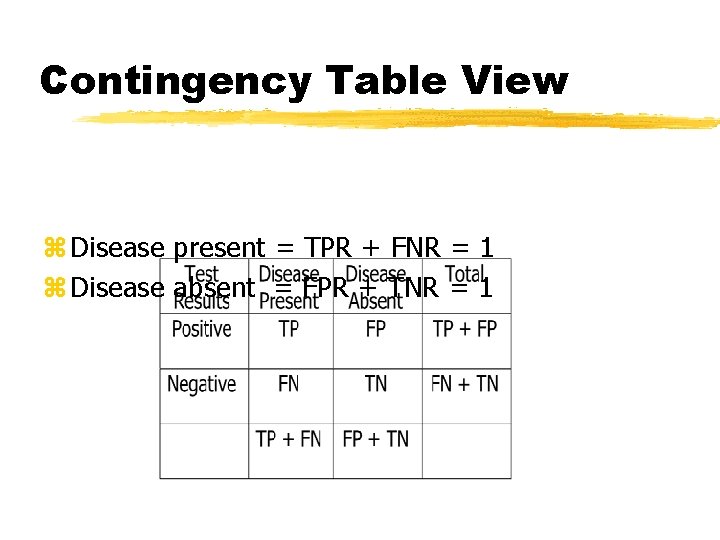
Contingency Table View z Disease present = TPR + FNR = 1 z Disease absent = FPR + TNR = 1
Test Performance z False positive rate (FPR) p[+lno D] = probability of an abnormal test result given that the disease is absent: the number of persons WITHOUT the disease who have an abnormal test result divided by the number of persons WITHOUT the disease
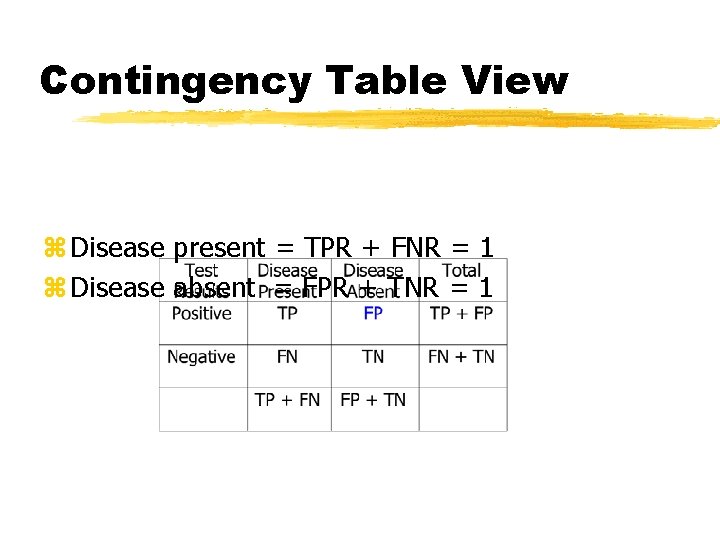
Contingency Table View z Disease present = TPR + FNR = 1 z Disease absent = FPR + TNR = 1
Test Performance z True negative rate (TNR) p[-lno D] = probability of a normal test result given that the disease is absent; number of persons WITHOUT the disease who have a normal test result divided by number of persons WITHOUT the disease; 1 - FPR or specificity; 100% specificity = pathognomonic
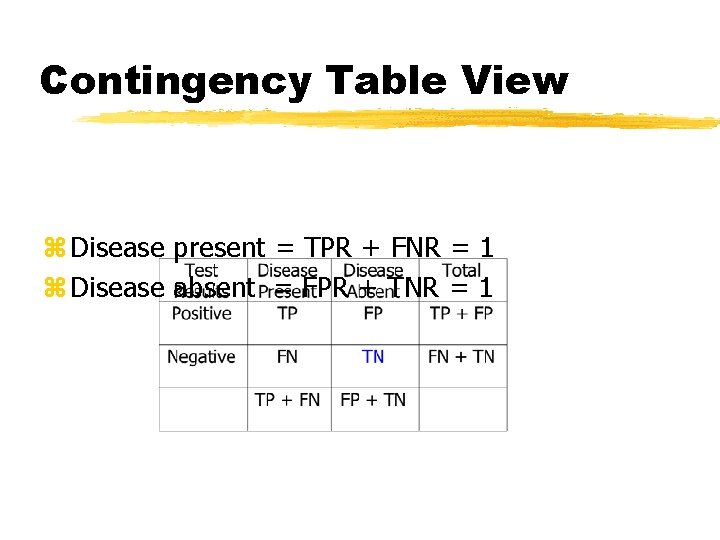
Contingency Table View z Disease present = TPR + FNR = 1 z Disease absent = FPR + TNR = 1
Test Performance z False negative rate (FNR) p[-l D] = probability of a normal test result given that the disease is present; number of persons WITH the disease who have a normal test result divided by number of persons WITH the disease; 1 - TPR
Contingency Table View z Disease present = TPR + FNR = 1 z Disease absent = FPR + TNR = 1
Sensitivity vs. Specificity z. Weighing sensitivity Vs. specificity in setting cutoff level for abnormality in a test z. Consequences of FPR vs. FNR – Severity of disease – Availability of treatment – Risk of treatment z. Sensitivity and specificity are characteristics of a test and a criterion for abnormality
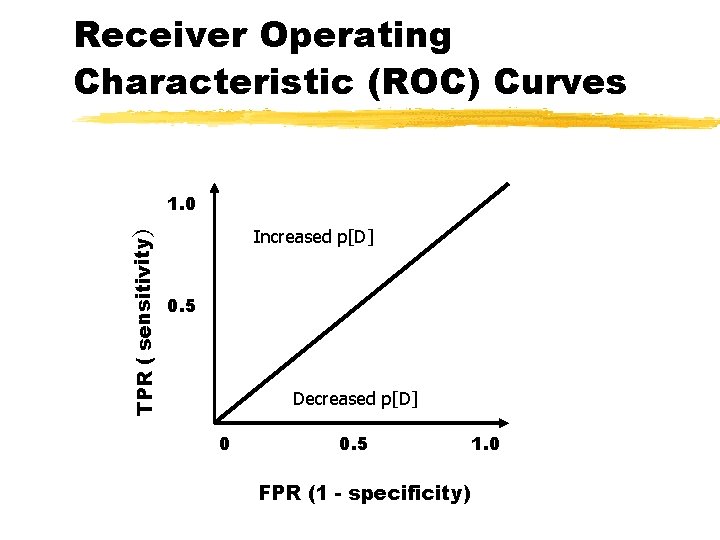
Receiver Operating Characteristic (ROC) Curves TPR ( sensitivity) 1. 0 Increased p[D] 0. 5 Decreased p[D] 0 0. 5 FPR (1 - specificity) 1. 0
Contingency Table View z Disease present = TPR + FNR = 1 z Disease absent = FPR + TNR = 1
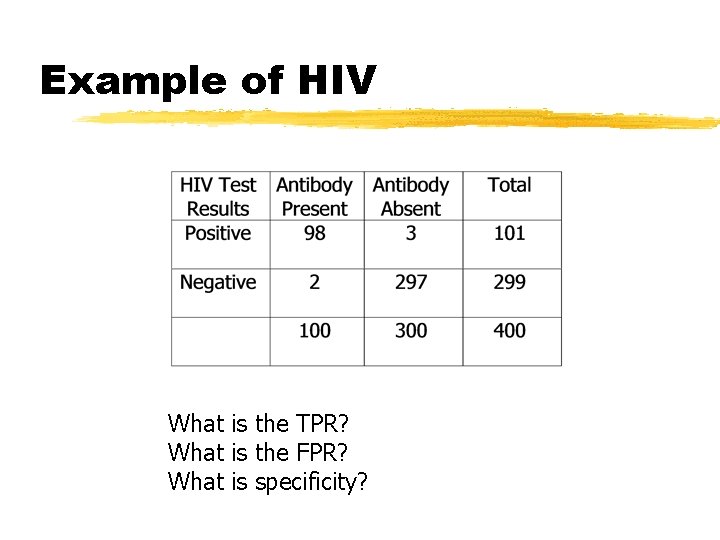
Example of HIV What is the TPR? What is the FPR? What is specificity?
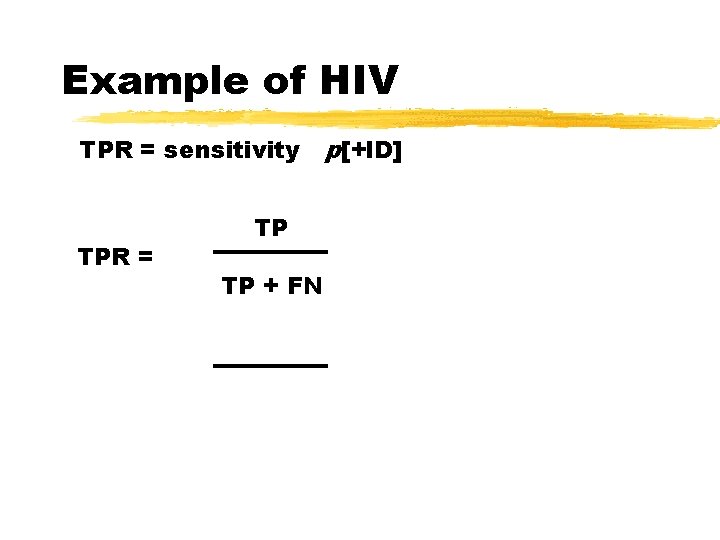
Example of HIV TPR = sensitivity TPR = TP TP + FN p[+l. D]

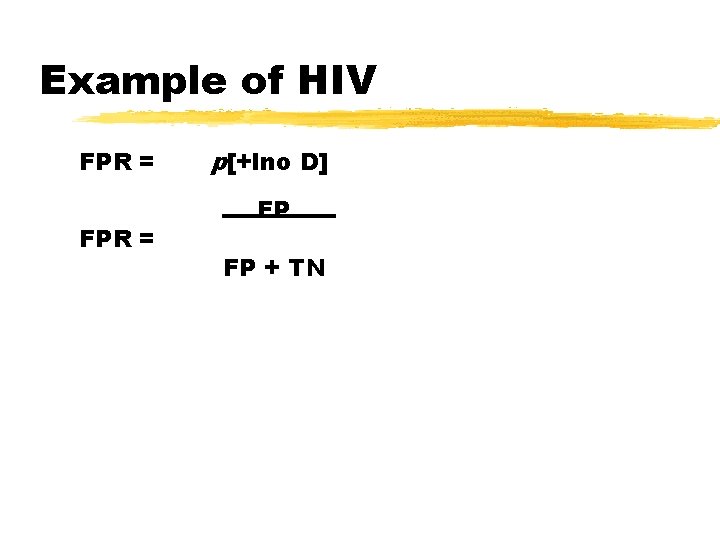
Example of HIV FPR = p[+lno D] FP FP + TN

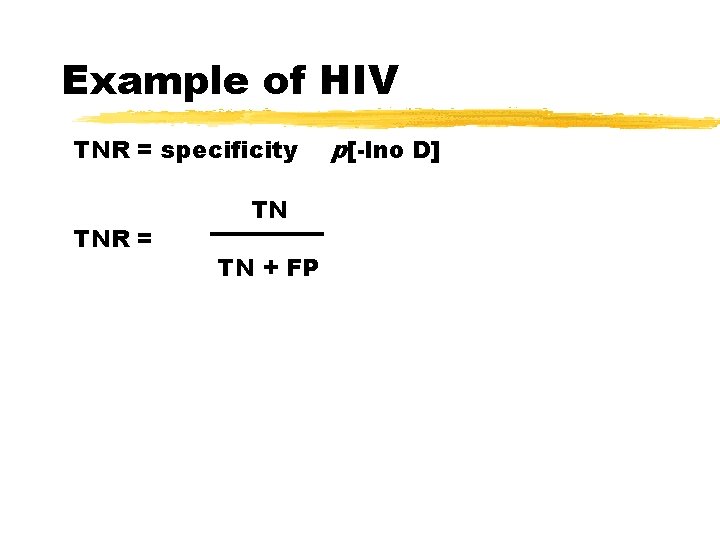
Example of HIV TNR = specificity TNR = TN TN + FP p[-lno D]


Nurse and Patient Rating of Symptoms z. By definition, patient is gold standard for symptom rating z. RN as “test” for presence or absence of symptom z. Fatigue – – RN RN yes/Pt yes = 50 yes/Pt no = 15 no/Pt yes = 20 no/Pt no = 15 z. What is sensitivity? What is specificity?

Nurse and Patient Ratings of Symptoms: Sensitivity TPR = TP TP + FN

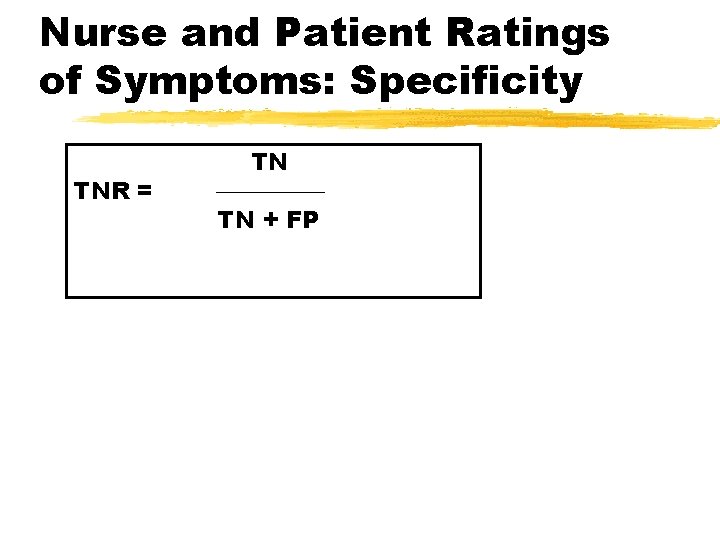
Nurse and Patient Ratings of Symptoms: Specificity TNR = TN TN + FP

Moving from Test Characteristics to Predictive Value and Posterior Probabilities z. Predictive value z. Forms of Bayes’ – Bayes’ formula – Contingency table view – Likelihood ratio
Prevalence z. Frequency of disease in the population of interest at a given point in time
Predictive Value z. Sensitivity, specificity, and their complements (FNR & FPR) focus on probability of findings given presence or absence of disease so not in a clinically useful form z. Predictive value focuses on probability of disease given findings z. Predictive value takes prevalence of disease in study population into account
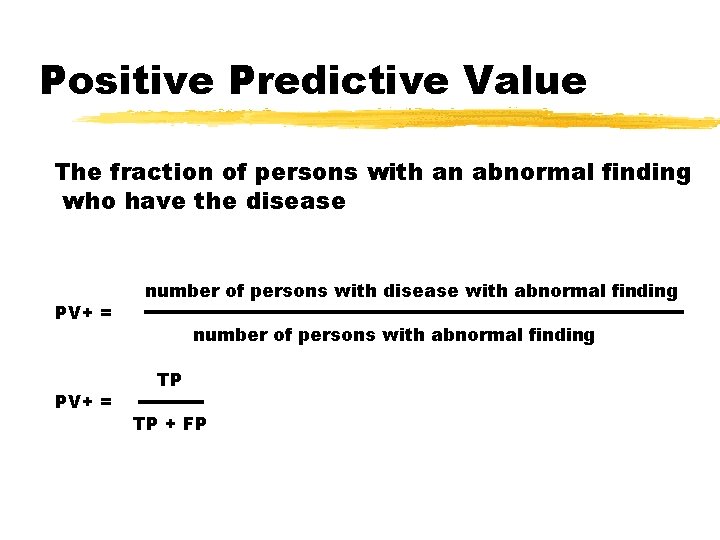
Positive Predictive Value The fraction of persons with an abnormal finding who have the disease PV+ = number of persons with disease with abnormal finding number of persons with abnormal finding TP TP + FP
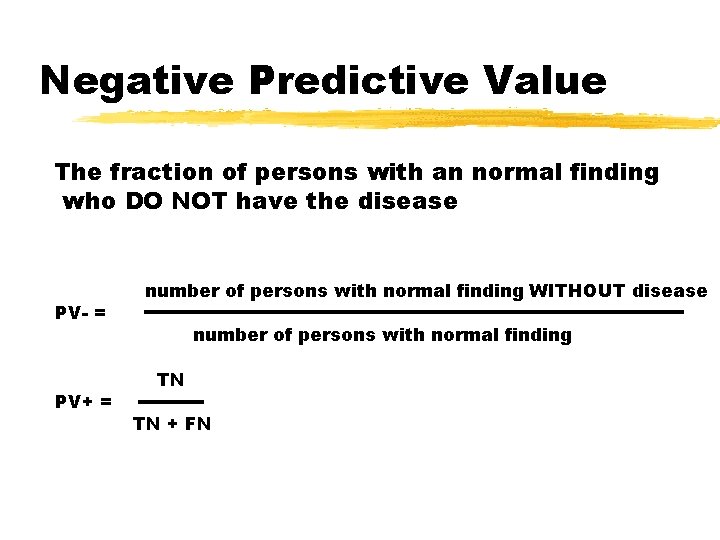
Negative Predictive Value The fraction of persons with an normal finding who DO NOT have the disease PV- = PV+ = number of persons with normal finding WITHOUT disease number of persons with normal finding TN TN + FN
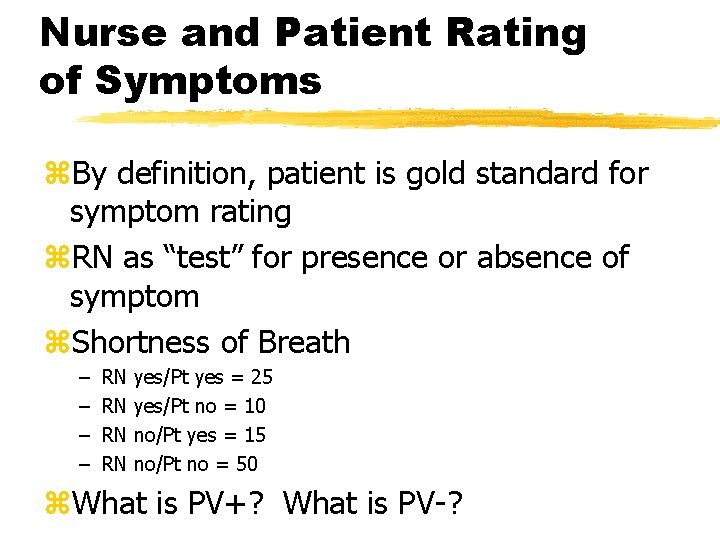
Nurse and Patient Rating of Symptoms z. By definition, patient is gold standard for symptom rating z. RN as “test” for presence or absence of symptom z. Shortness of Breath – – RN RN yes/Pt yes = 25 yes/Pt no = 10 no/Pt yes = 15 no/Pt no = 50 z. What is PV+? What is PV-?
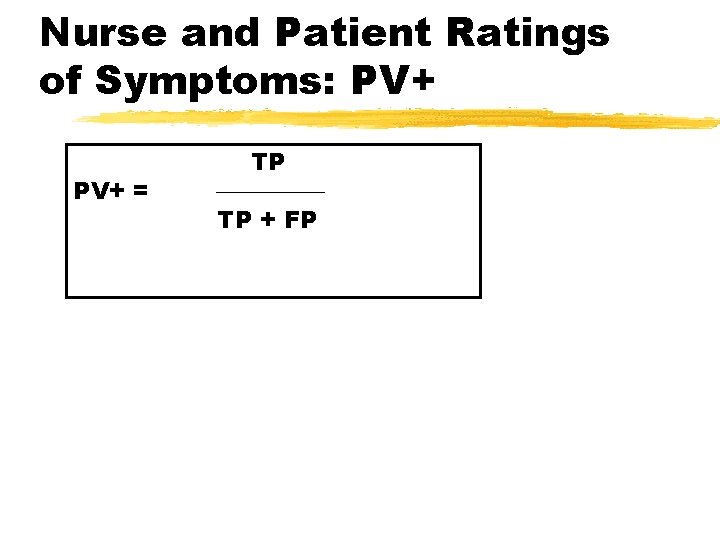
Nurse and Patient Ratings of Symptoms: PV+ = TP TP + FP


Nurse and Patient Ratings of Symptoms: PVPV- = TN TN + FN

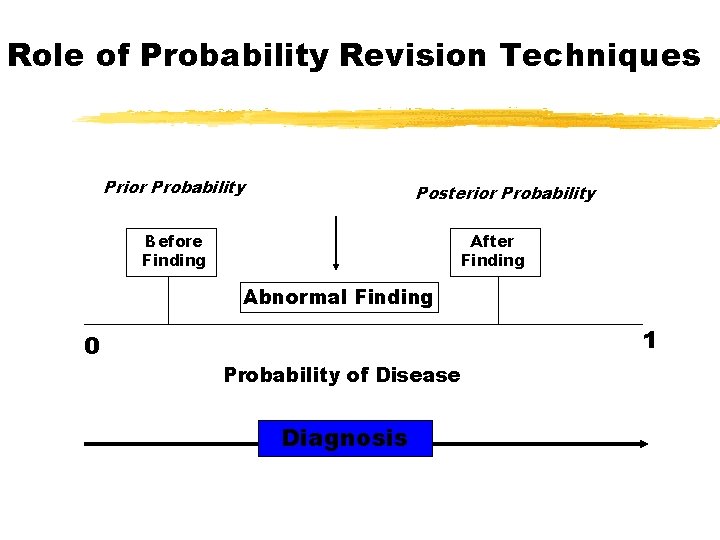
Role of Probability Revision Techniques Prior Probability Posterior Probability Before Finding After Finding Abnormal Finding 0 1 Probability of Disease Diagnosis
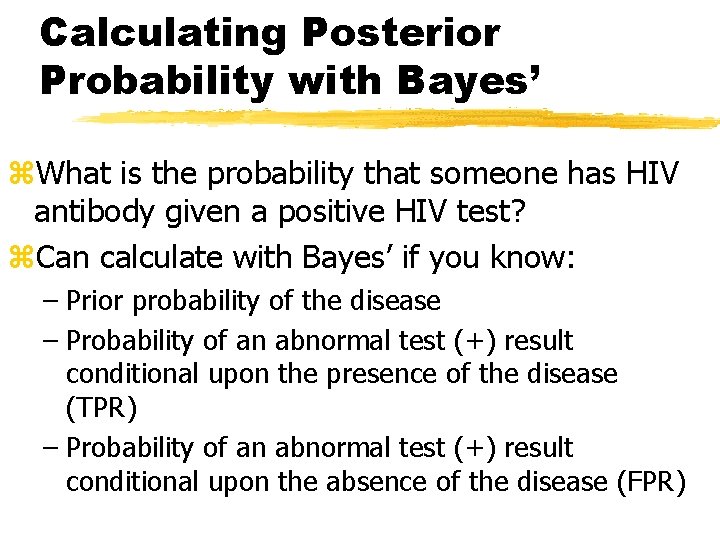
Calculating Posterior Probability with Bayes’ z. What is the probability that someone has HIV antibody given a positive HIV test? z. Can calculate with Bayes’ if you know: – Prior probability of the disease – Probability of an abnormal test (+) result conditional upon the presence of the disease (TPR) – Probability of an abnormal test (+) result conditional upon the absence of the disease (FPR)
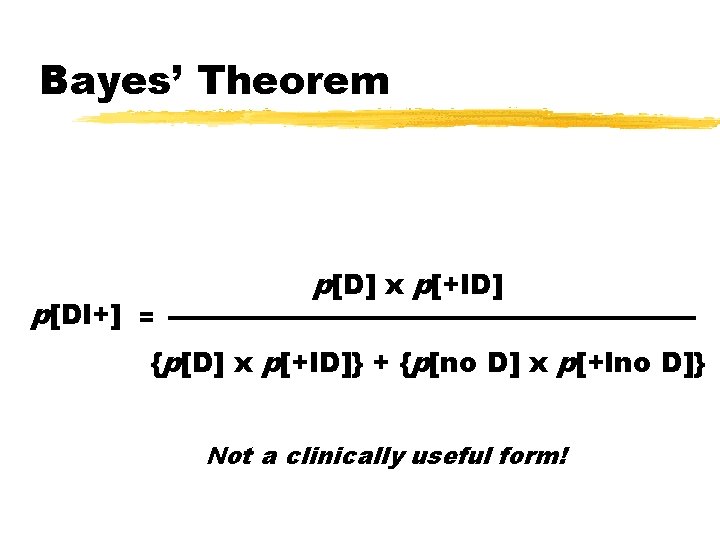
Bayes’ Theorem p[Dl+] = p[D] x p[+l. D] {p[D] x p[+l. D]} + {p[no D] x p[+lno D]} Not a clinically useful form!
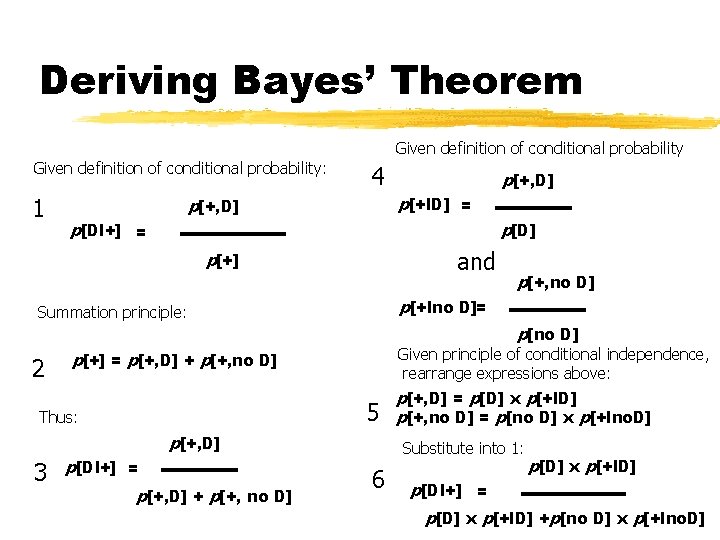
Deriving Bayes’ Theorem Given definition of conditional probability: 1 4 p[+l. D] = p[+, D] p[Dl+] = p[D] and p[+] p[no D] Given principle of conditional independence, rearrange expressions above: p[+] = p[+, D] + p[+, no D] 5 Thus: p[+, D] 3 p[Dl+] = p[+, D] + p[+, no D] p[+lno D]= Summation principle: 2 p[+, D] = p[D] x p[+l. D] p[+, no D] = p[no D] x p[+lno. D] Substitute into 1: 6 p[D] x p[+l. D] p[Dl+] = p[D] x p[+l. D] +p[no D] x p[+lno. D]
Calculating Posterior Probability with Bayes’ z. What is the probability that someone has HIV antibody given a positive HIV test? z. Can calculate with Bayes’ if you know: – Prior probability of the disease – Probability of an abnormal (+) test result conditional upon the presence of the disease (TPR=. 98) – Probability of an abnormal (+) test result conditional upon the absence of the disease (FPR=. 01)
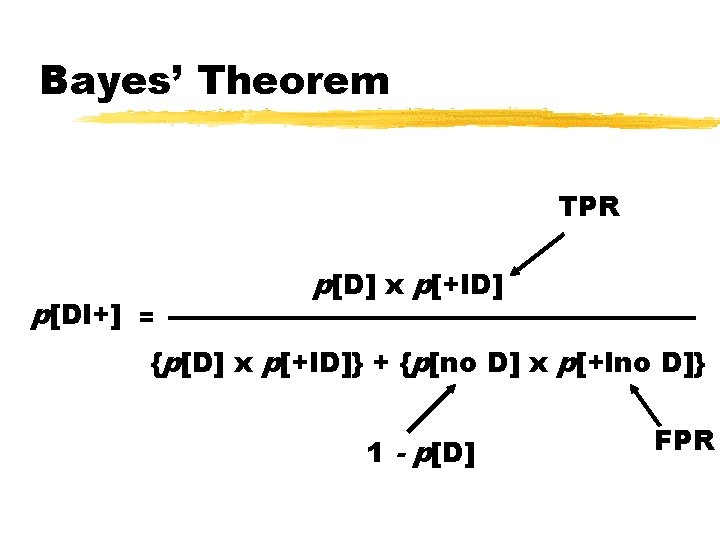
Bayes’ Theorem TPR p[Dl+] = p[D] x p[+l. D] {p[D] x p[+l. D]} + {p[no D] x p[+lno D]} 1 - p[D] FPR
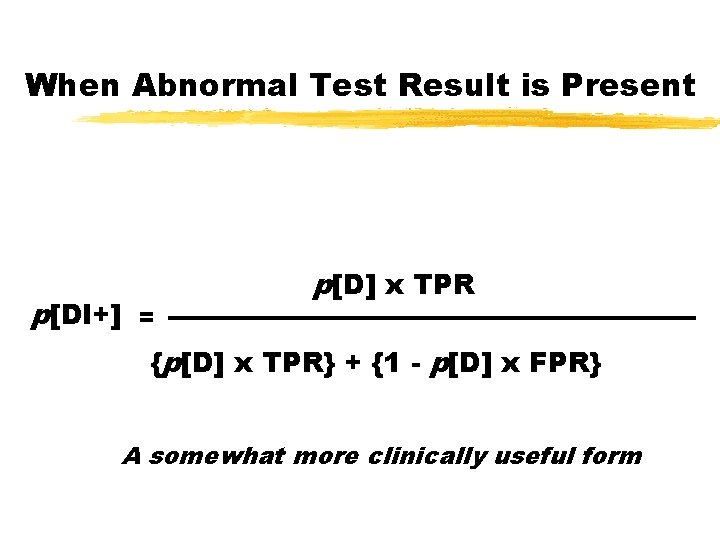
When Abnormal Test Result is Present p[Dl+] = p[D] x TPR {p[D] x TPR} + {1 - p[D] x FPR} A somewhat more clinically useful form
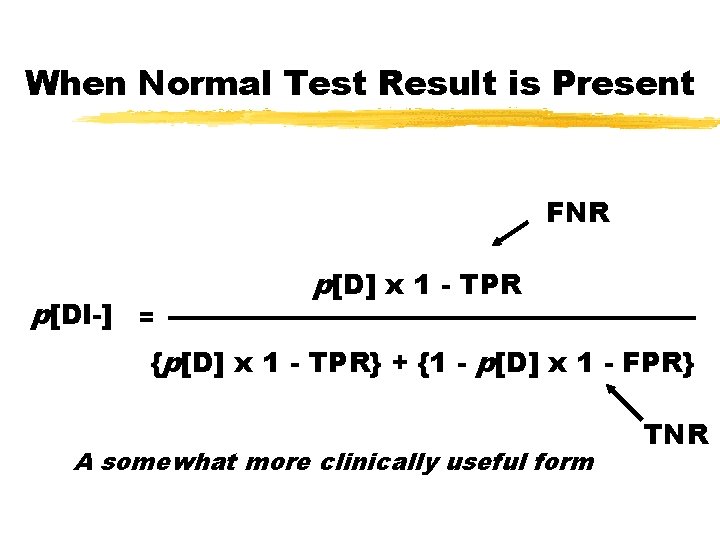
When Normal Test Result is Present FNR p[Dl-] = p[D] x 1 - TPR {p[D] x 1 - TPR} + {1 - p[D] x 1 - FPR} A somewhat more clinically useful form TNR
Calculating Posterior Probability with Bayes’ z. What is the probability that someone has HIV antibody given a positive HIV test? z. Can calculate with Bayes’ if you know: 1. Prior probability of the disease (can be prevalence or other information) 2. Probability of an abnormal test result conditional upon the presence of the disease (TPR=. 98) 3. Probability of an abnormal test result conditional upon the absence of the disease (FPR=. 01)
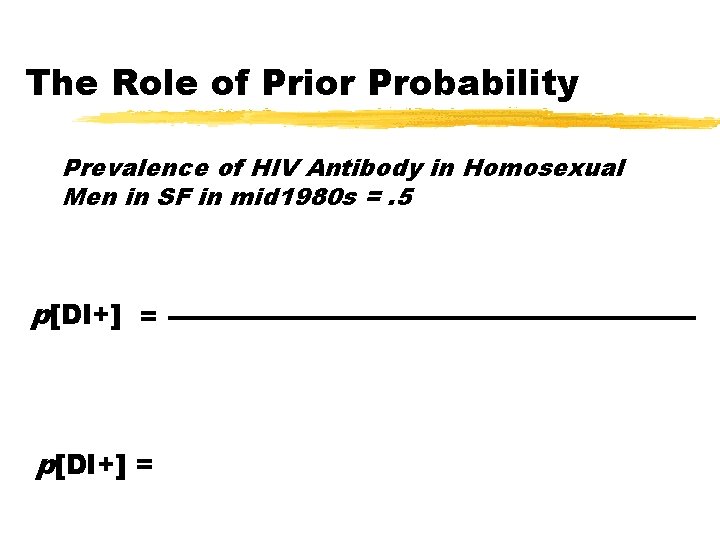
The Role of Prior Probability Prevalence of HIV Antibody in Homosexual Men in SF in mid 1980 s =. 5 p[Dl+] =
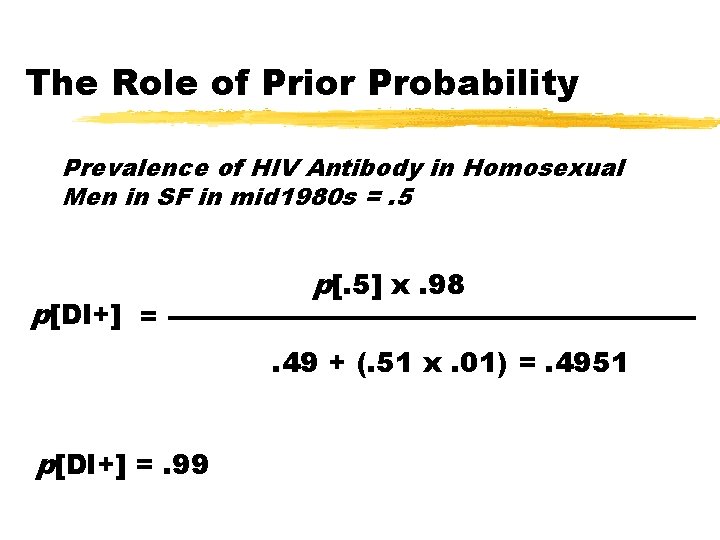
The Role of Prior Probability Prevalence of HIV Antibody in Homosexual Men in SF in mid 1980 s =. 5 p[Dl+] = p[. 5] x. 98. 49 + (. 51 x. 01) =. 4951 p[Dl+] =. 99
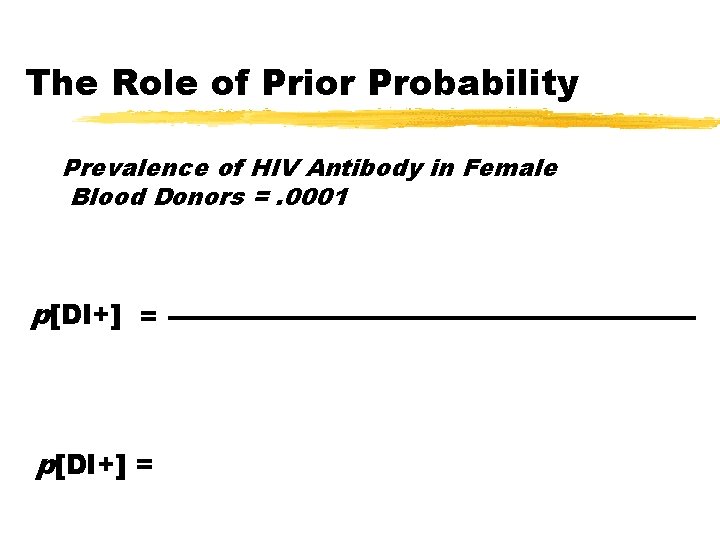
The Role of Prior Probability Prevalence of HIV Antibody in Female Blood Donors =. 0001 p[Dl+] =
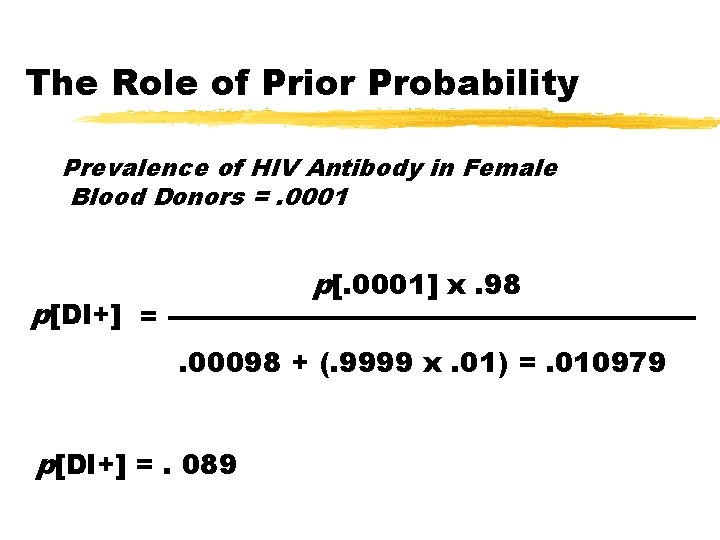
The Role of Prior Probability Prevalence of HIV Antibody in Female Blood Donors =. 0001 p[. 0001] x. 98 p[Dl+] = . 00098 + (. 9999 x. 01) =. 010979 p[Dl+] =. 089
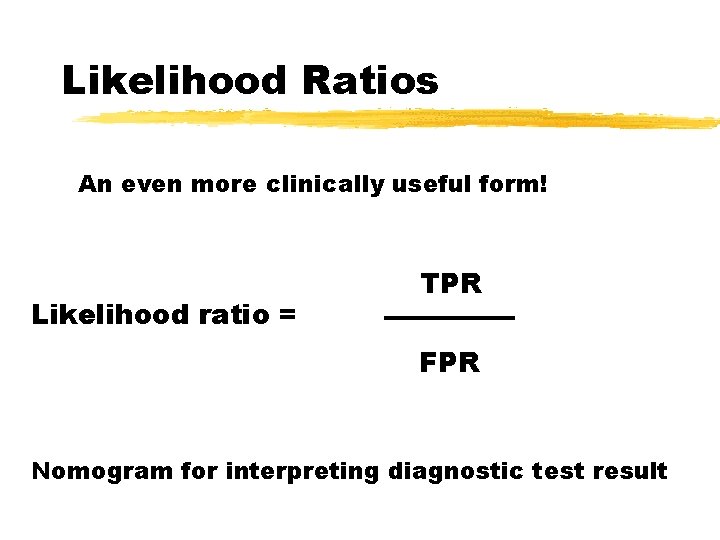
Likelihood Ratios An even more clinically useful form! Likelihood ratio = TPR FPR Nomogram for interpreting diagnostic test result
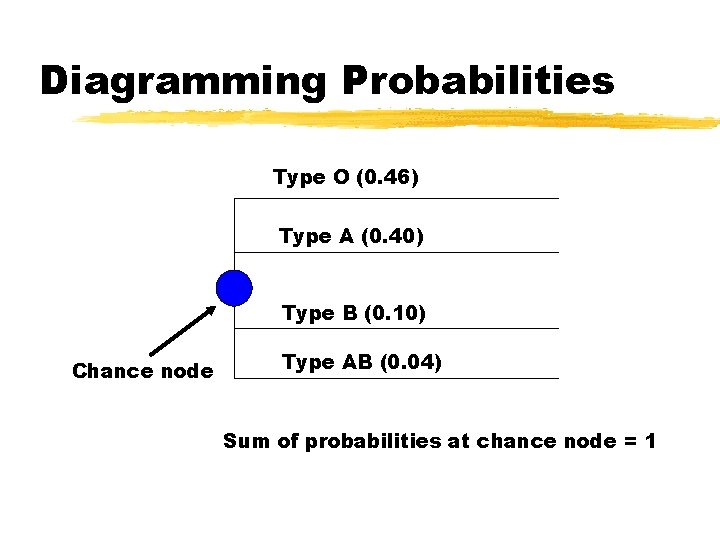
Diagramming Probabilities Type O (0. 46) Type A (0. 40) Type B (0. 10) Chance node Type AB (0. 04) Sum of probabilities at chance node = 1
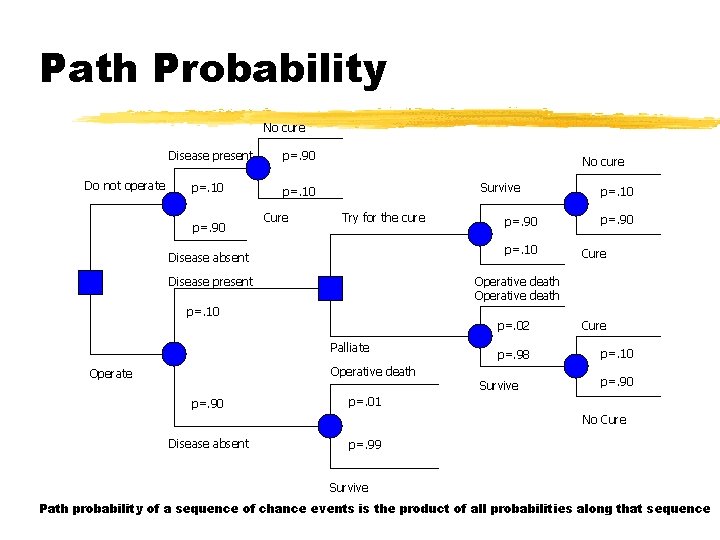
Path Probability No cure Do not operate Disease present p=. 90 p=. 10 p=. 90 Cure No cure Survive Try for the cure p=. 90 p=. 10 Disease absent Disease present p=. 10 p=. 90 Cure Operative death p=. 10 p=. 02 Palliate p=. 98 Operative death Operate Survive p=. 90 Cure p=. 10 p=. 90 p=. 01 No Cure Disease absent p=. 99 Survive Path probability of a sequence of chance events is the product of all probabilities along that sequence
Conditional Independence z. Two findings are conditionally independent if TPR and FPR of one clinical finding do not depend upon the presence of the other finding z. Assumption of conditional independence invoked when the same TPR (or FPR) is used in Bayes’ regardless of the prior probability of disease z. Relevant in series of tests z. May be invalid in some clinical situations
Interpreting Sequence of Tests z. Posttest probability of first test used as pretest probability of second test z. TPR and FPR of second test used in Bayes’ to calculate posttest probability following second test
Test Performance Biases z Most significance source of error in measuring test performance is due to differences between population in which test performance is measured and the population in which the test will be used z Spectrum bias - differences between populations in the spectrum of disease presentation and severity – Test population contains more sick persons than clinically relevant population – Test-referral bias - the composition of the population used to evaluate a diagnostic test is altered when the test is a criterion for referring a patient for the definitive diagnostic procedure z TPR is usually higher in the study population than in the clinically relevant population due to few negatives (FN & TN) referred z FPR is usually higher in the study population than in the clinically relevant population due to few TN (remember FP + TN = 1)
Critically Analysis of Report of Diagnostic or Screening Test 4 Are the results of the study valid? z. What are the results? z. Will the results help me in caring for my patients?
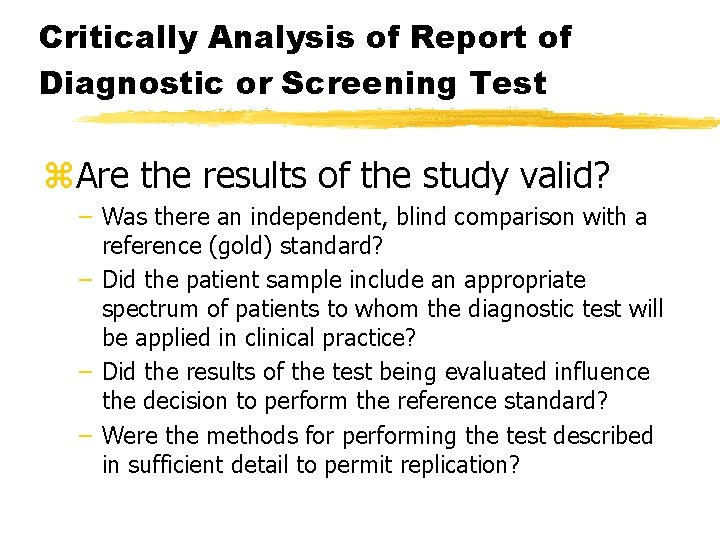
Critically Analysis of Report of Diagnostic or Screening Test z. Are the results of the study valid? – Was there an independent, blind comparison with a reference (gold) standard? – Did the patient sample include an appropriate spectrum of patients to whom the diagnostic test will be applied in clinical practice? – Did the results of the test being evaluated influence the decision to perform the reference standard? – Were the methods for performing the test described in sufficient detail to permit replication?
Critically Analysis of Report of Diagnostic or Screening Test z. Are the results of the study valid? 4 What are the results? z. Will the results help me in caring for my patients?
Critically Analysis of Report of Diagnostic or Screening Test z. What are the results? – Are likelihood ratios for the test result presented or data necessary for their calculation included?
Critically Analysis of Report of Diagnostic or Screening Test z. Are the results of the study valid? z. What are the results? 4 Will the results help me in caring for my patients?
Critically Analysis of Report of Diagnostic or Screening Test z. Will the results help me in caring for my patients? – Will the reproducibility of the test result and its interpretation be satisfactory in my setting? – Are the results applicable to my patient?
- Slides: 71