
Cristobal Young Stanford University Why focus on Millionaire

Cristobal Young Stanford University
Why focus on Millionaire Taxes?
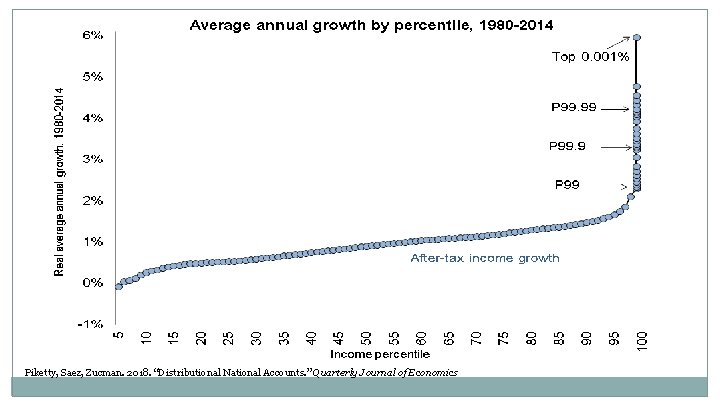
Piketty, Saez, Zucman. 2018. “Distributional National Accounts. ” Quarterly Journal of Economics
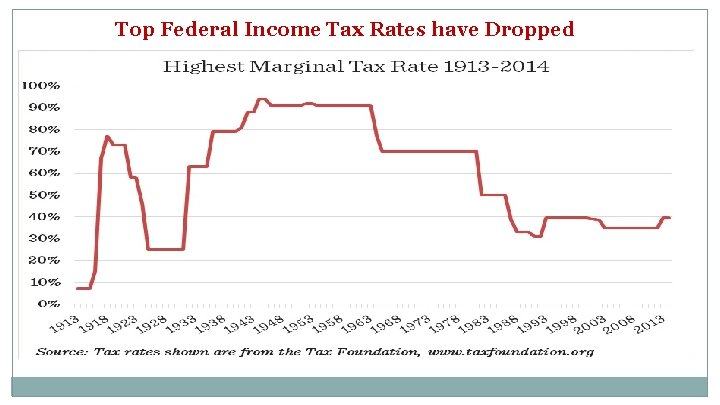
Top Federal Income Tax Rates have Dropped
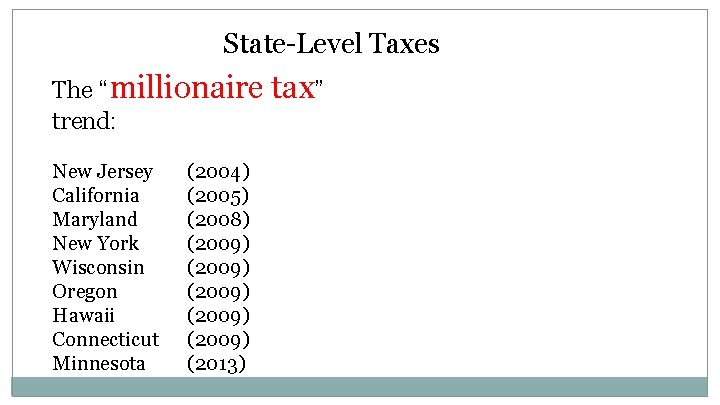
State-Level Taxes The “millionaire tax” trend: New Jersey California Maryland New York Wisconsin Oregon Hawaii Connecticut Minnesota (2004) (2005) (2008) (2009) (2009) (2013)
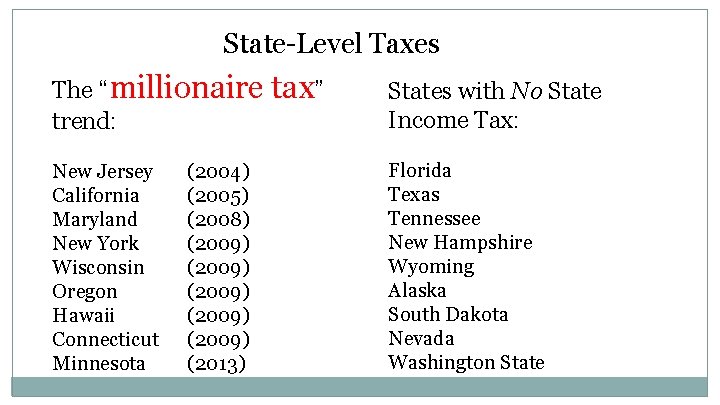
State-Level Taxes The “millionaire tax” trend: States with No State Income Tax: New Jersey California Maryland New York Wisconsin Oregon Hawaii Connecticut Minnesota Florida Texas Tennessee New Hampshire Wyoming Alaska South Dakota Nevada Washington State (2004) (2005) (2008) (2009) (2009) (2013)
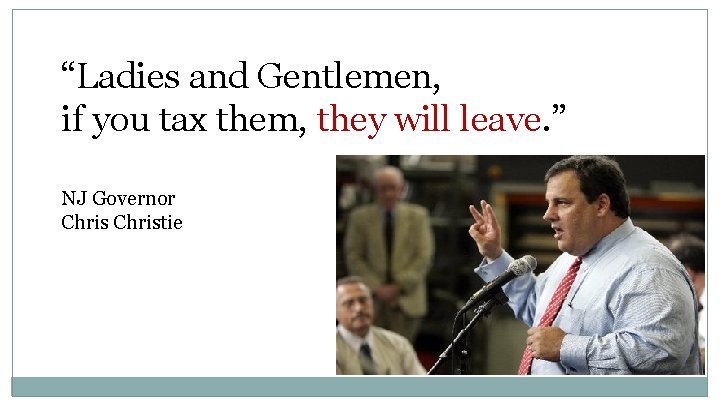
“Ladies and Gentlemen, if you tax them, they will leave. ” NJ Governor Christie

Economic embeddedness: Place-specific social capital
Economic embeddedness: Place-specific social capital Elite income derives from human capital (mobile)
Economic embeddedness: Place-specific social capital Elite income derives from human capital (mobile) And social capital: Personal and professional connections, colleagues, clients (not mobile)
Mobile Millionaires or Embedded Elites ?
IRS Data Individual records for all millionaire tax filers, for all states, 1999 -2011 N ≈ 45, 000 3. 7 million unique “millionaires”
IRS Data Individual records for all millionaire tax filers, for all states, 1999 -2011 N ≈ 45, 000 3. 7 million unique “millionaires” Census-scale panel data on where millionaires live and where they move to.
IRS Data For comparison, pulled a 1% sample of all filers N (all population) ≈24, 000 2. 6 million unique tax filers. Run separate migration analyses for millionaires and the general population
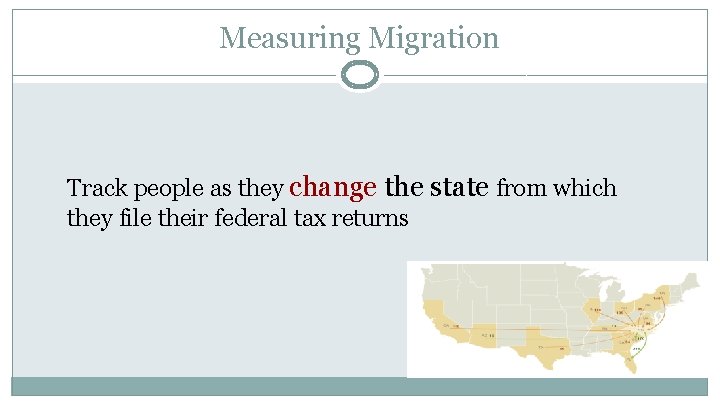
Measuring Migration Track people as they change the state from which they file their federal tax returns
Q 1. Where do Millionaires Live?
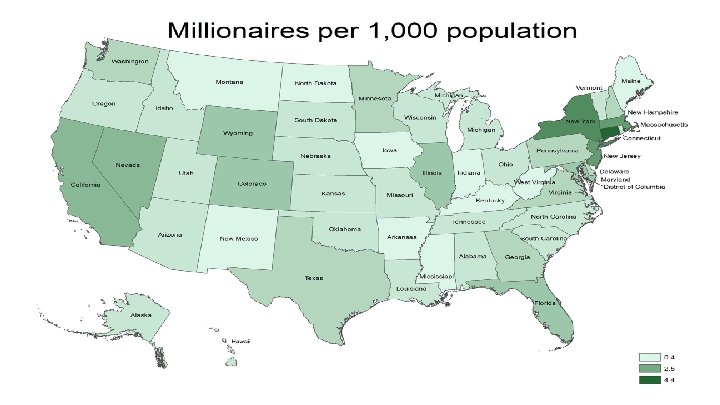
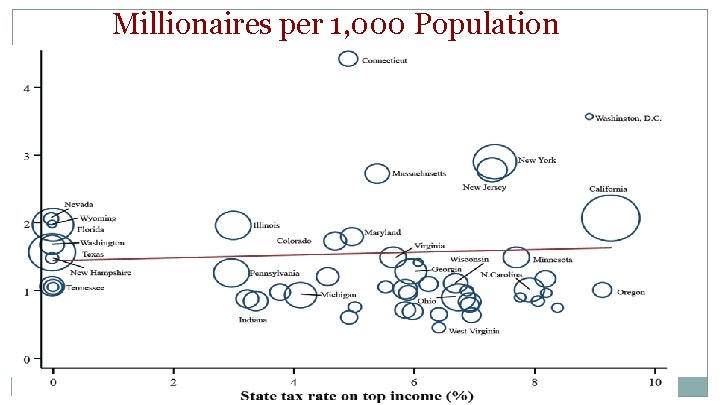
Millionaires per 1, 000 Population
Q 2. Are Millionaires Highly Mobile?
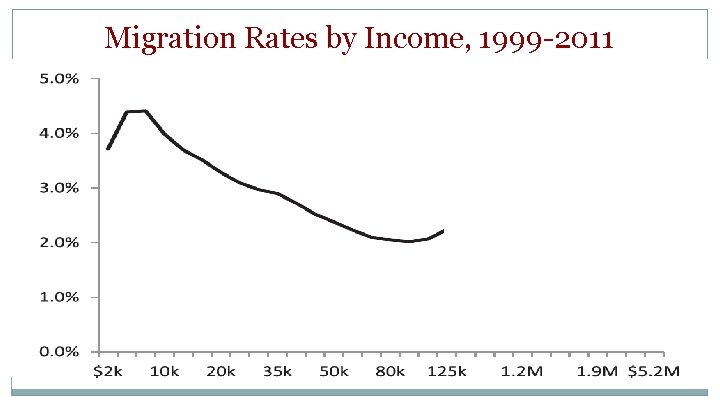
Migration Rates by Income, 1999 -2011
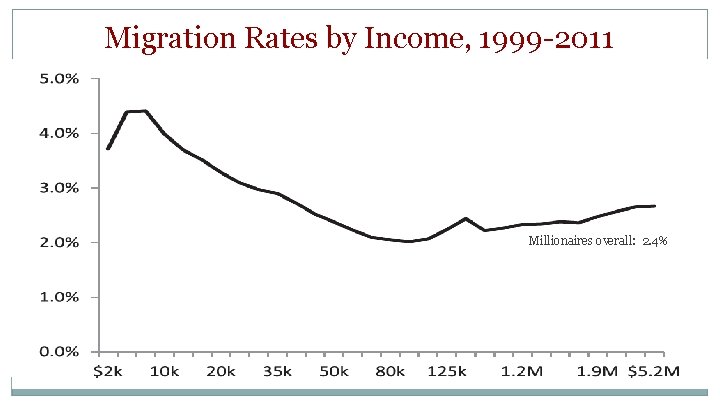
Migration Rates by Income, 1999 -2011 Millionaires overall: 2. 4%
Q 3. How Much Tax-Induced Migration?
Q 3. How Much Tax-Induced Migration? Do millionaires systematically move from high-tax to low-tax states?
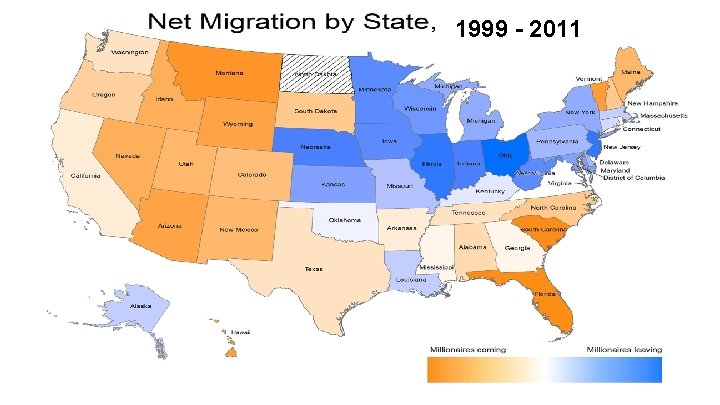
1999 - 2011
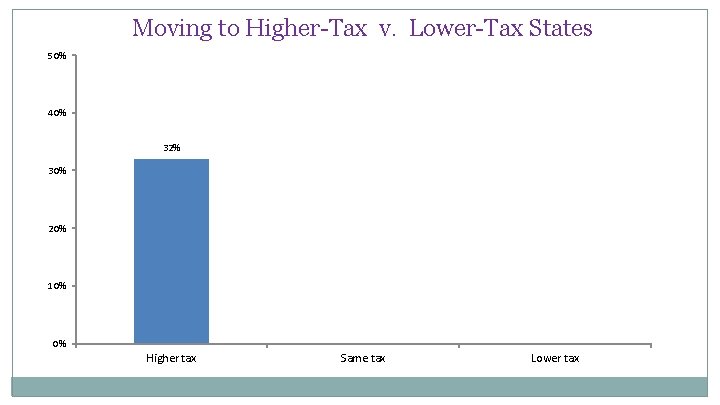
Moving to Higher-Tax v. Lower-Tax States 50% 40% 32% 30% 20% 10% 0% Higher tax Same tax Lower tax
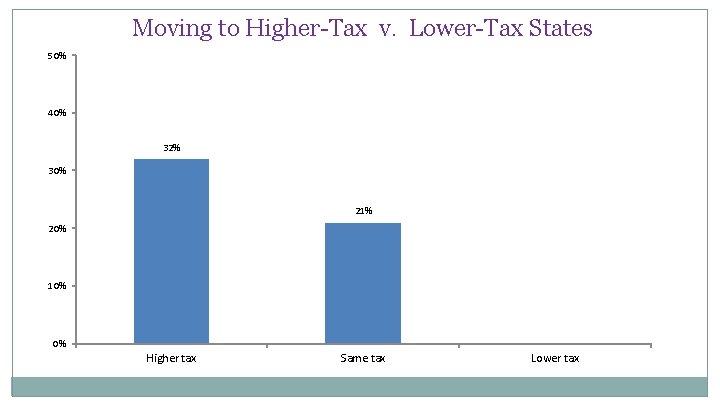
Moving to Higher-Tax v. Lower-Tax States 50% 40% 32% 30% 21% 20% 10% 0% Higher tax Same tax Lower tax
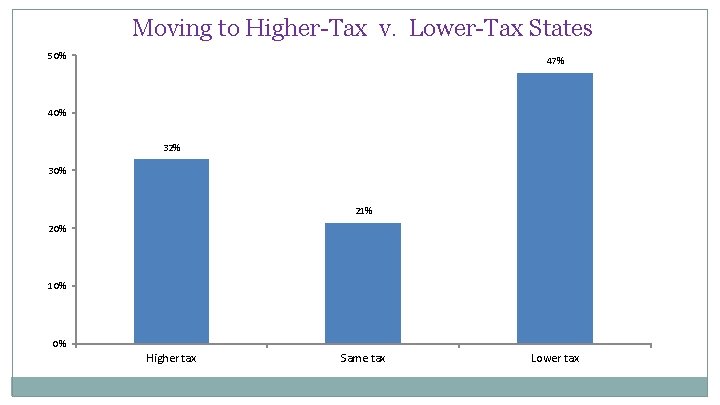
Moving to Higher-Tax v. Lower-Tax States 50% 47% 40% 32% 30% 21% 20% 10% 0% Higher tax Same tax Lower tax
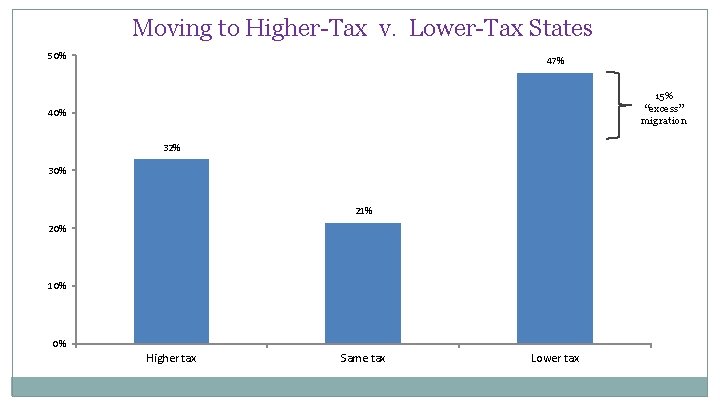
Moving to Higher-Tax v. Lower-Tax States 50% 47% 15% “excess” migration 40% 32% 30% 21% 20% 10% 0% Higher tax Same tax Lower tax
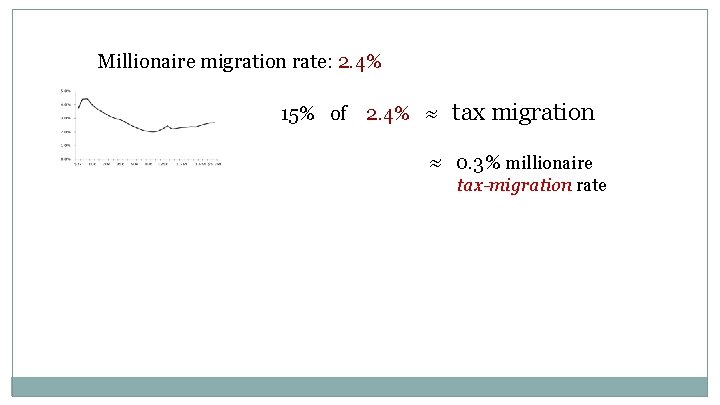
Millionaire migration rate: 2. 4% 15% of 2. 4% ≈ tax migration ≈ 0. 3% millionaire tax-migration rate
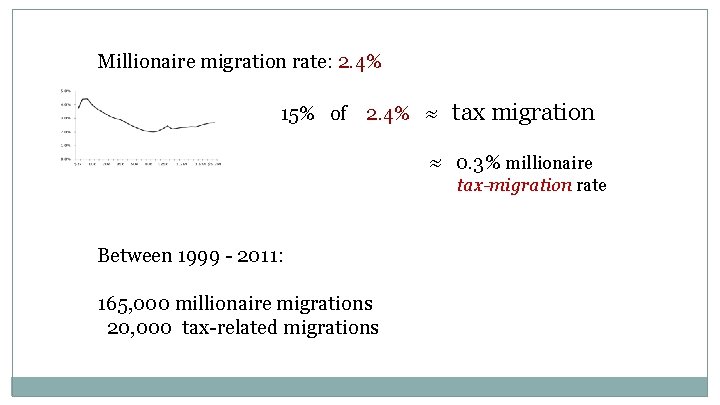
Millionaire migration rate: 2. 4% 15% of 2. 4% ≈ tax migration ≈ 0. 3% millionaire tax-migration rate Between 1999 - 2011: 165, 000 millionaire migrations 20, 000 tax-related migrations
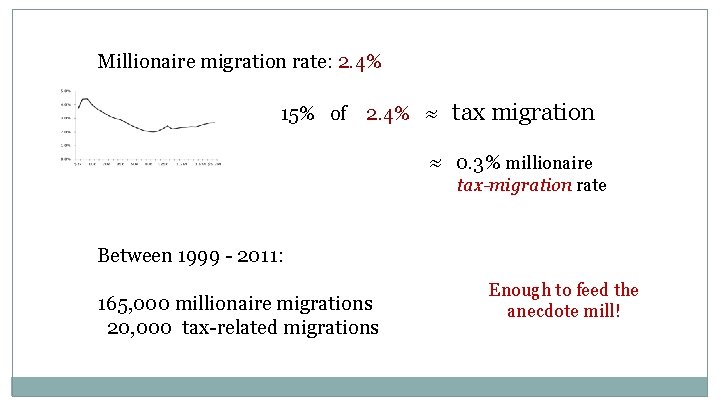
Millionaire migration rate: 2. 4% 15% of 2. 4% ≈ tax migration ≈ 0. 3% millionaire tax-migration rate Between 1999 - 2011: 165, 000 millionaire migrations 20, 000 tax-related migrations Enough to feed the anecdote mill!
Gravity Model of Migration Millionaire migrants from state i (origin) to state j (destination) is a function of:
Gravity Model of Migration Millionaire migrants from state i (origin) to state j (destination) is a function of: # of millionaires in each state Distance between states Income tax rate (on millionaires) Contiguity
Gravity Model of Migration Millionaire migrants from state i (origin) to state j (destination) is a function of: # of millionaires in each state Distance between states Income tax rate (on millionaires) Contiguity Control for: Other state taxes (sales, property, inheritance) Economic performance (per capita income, unemployment rate) Natural climate (winter temperature) Residential land prices (market demand)
Gravity Model of Migration Millionaire migrants from state i (origin) to state j (destination) is a function of: # of millionaires in each state Distance between states Income tax rate (on millionaires) Contiguity Control for: Other state taxes (sales, property, inheritance) Economic performance (per capita income, unemployment rate) Natural climate (winter temperature) Residential land prices (market demand) Look at: $10 million incomes Retirement age (65+) Business owners / “Capitalists” …
Q 3. 1 The Problem of Florida
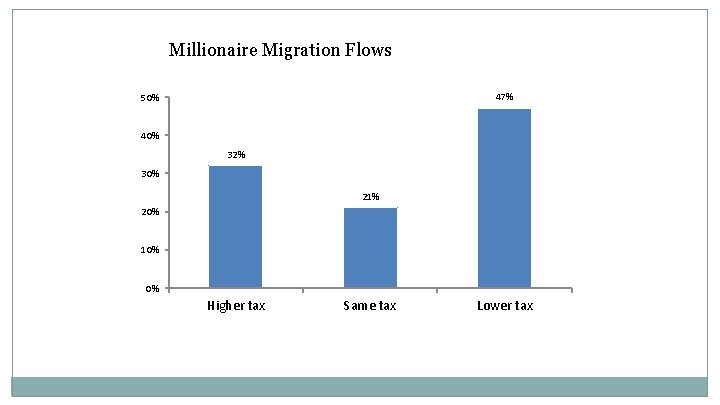
Millionaire Migration Flows 50% 47% 40% 32% 30% 21% 20% 10% 0% Higher tax Same tax Lower tax
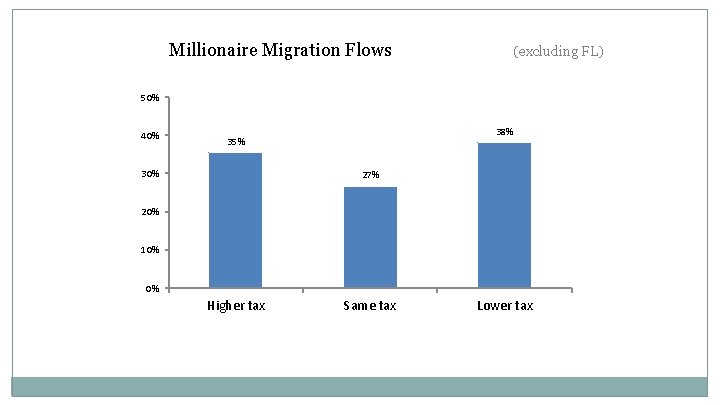
Millionaire Migration Flows (excluding FL) 50% 40% 38% 35% 30% 27% 20% 10% 0% Higher tax Same tax Lower tax
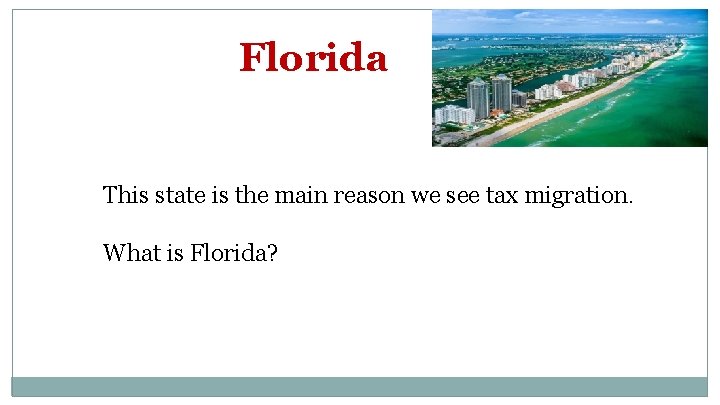
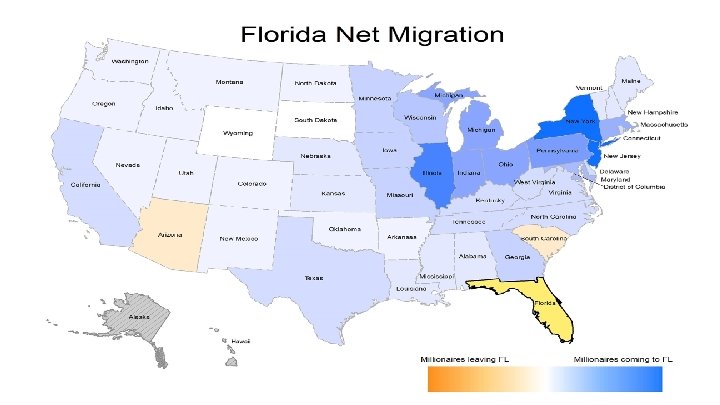
Florida This state is the main reason we see tax migration. What is Florida?
Florida This state is the main reason we see tax migration. What is Florida?
Florida This state is the main reason we see tax migration. What is Florida? or luxury resort?
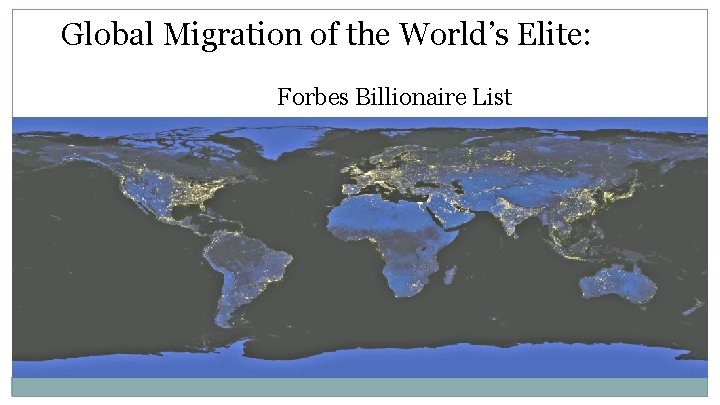
Global Migration of the World’s Elite: Forbes Billionaire List
2010 world billionaires: 1, 010 individuals with net worth of $1 b 84% live in their country of birth 16% live “abroad”
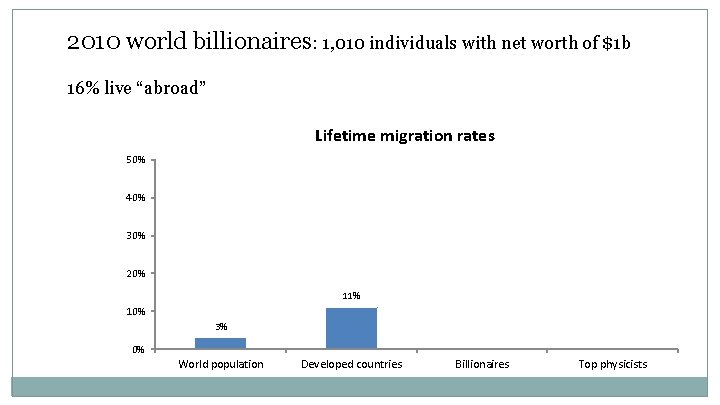
2010 world billionaires: 1, 010 individuals with net worth of $1 b 16% live “abroad” Lifetime migration rates 50% 40% 30% 20% 11% 10% 3% 0% World population Developed countries Billionaires Top physicists
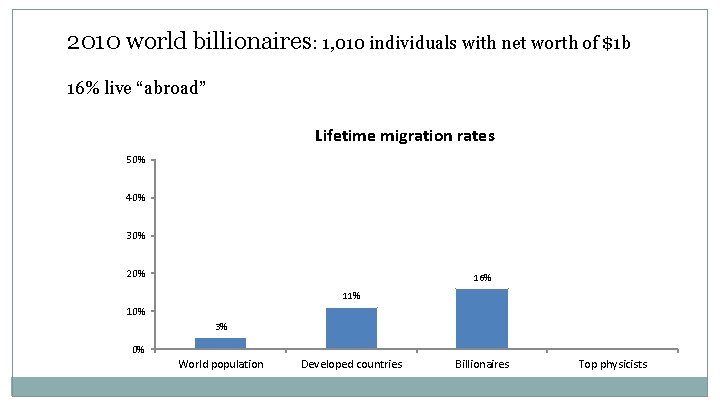
2010 world billionaires: 1, 010 individuals with net worth of $1 b 16% live “abroad” Lifetime migration rates 50% 40% 30% 20% 16% 11% 10% 3% 0% World population Developed countries Billionaires Top physicists
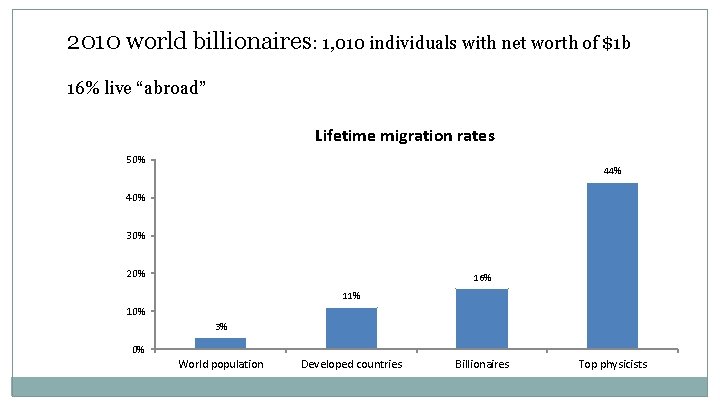
2010 world billionaires: 1, 010 individuals with net worth of $1 b 16% live “abroad” Lifetime migration rates 50% 44% 40% 30% 20% 16% 11% 10% 3% 0% World population Developed countries Billionaires Top physicists
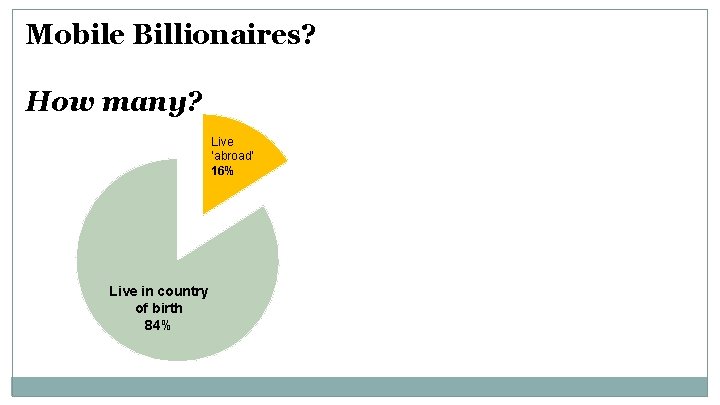
Mobile Billionaires? How many? Live ‘abroad’ 16% Live in country of birth 84%
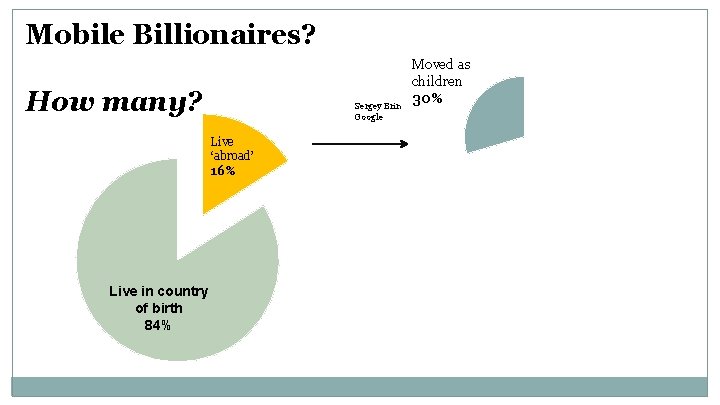
Mobile Billionaires? How many? Sergey Brin Google Live ‘abroad’ 16% Live in country of birth 84% Moved as children 30%
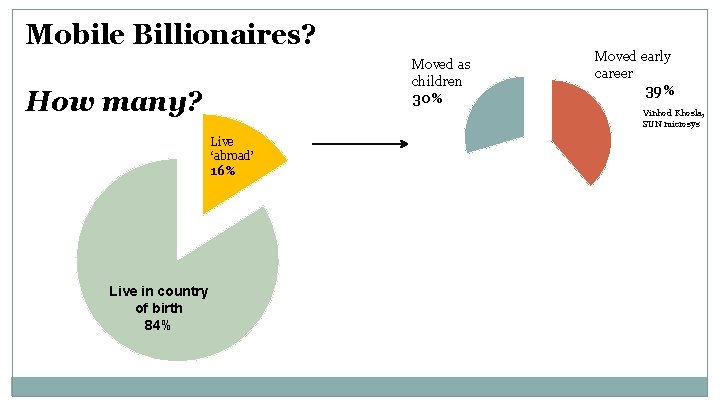
Mobile Billionaires? Moved as children 30% How many? Vinhod Khosla, SUN microsys Live ‘abroad’ 16% Live in country of birth 84% Moved early career 39%
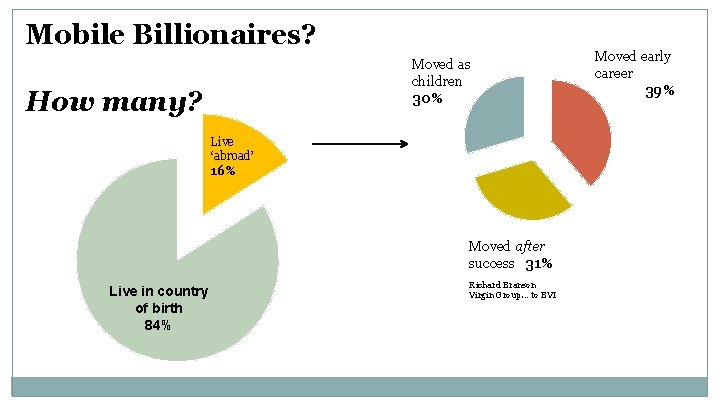
Mobile Billionaires? Moved as children 30% How many? Live ‘abroad’ 16% Moved after success 31% Live in country of birth 84% Richard Branson Virgin Group… to BVI Moved early career 39%
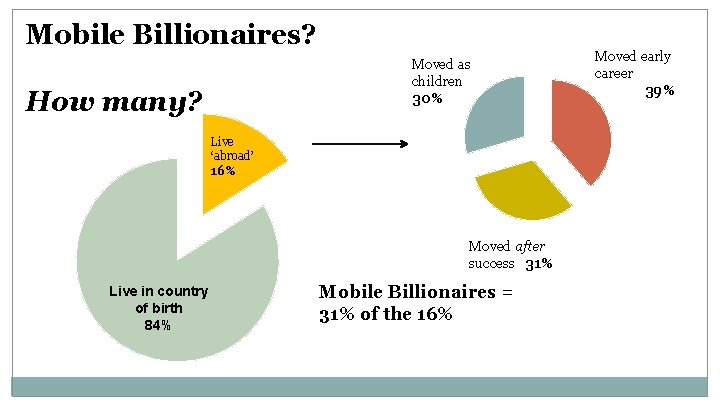
Mobile Billionaires? Moved as children 30% How many? Live ‘abroad’ 16% Moved after success 31% Live in country of birth 84% Mobile Billionaires = 31% of the 16% Moved early career 39%
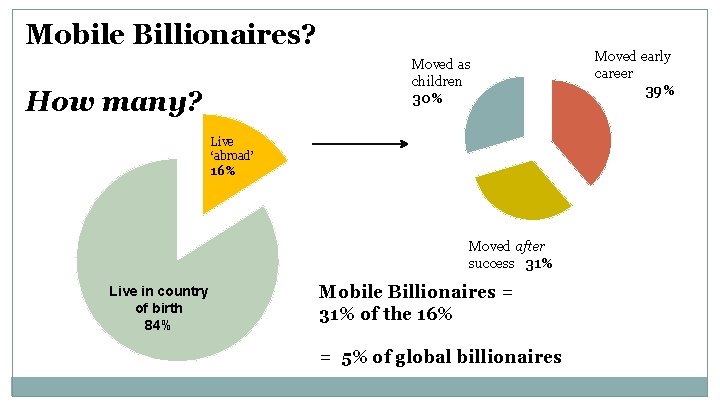
Mobile Billionaires? Moved as children 30% How many? Live ‘abroad’ 16% Moved after success 31% Live in country of birth 84% Mobile Billionaires = 31% of the 16% = 5% of global billionaires Moved early career 39%
Retention of Billionaires by Country and Tax Rate, 2010 Note: Countries are weighted by the number of billionaires born in each country (as indicated by the size of circle for each country).
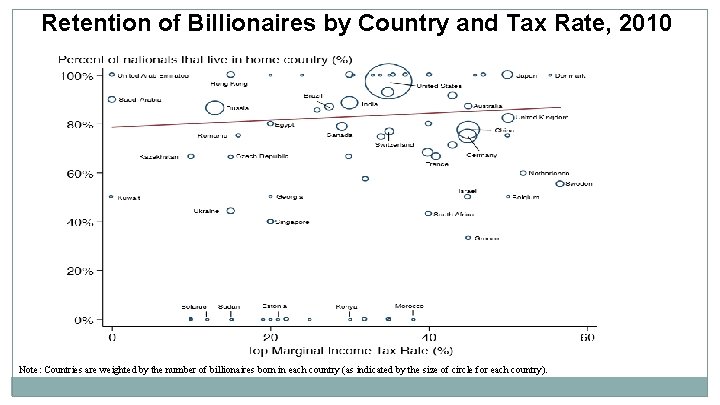
Retention of Billionaires by Country and Tax Rate, 2010 Note: Countries are weighted by the number of billionaires born in each country (as indicated by the size of circle for each country).
5% of world billionaires are the “globals” – unplugged from their nation states, traversing the world for a cosmopolitan lifestyle and low taxes.
5% of world billionaires are the “globals” – unplugged from their nation states, traversing the world for a cosmopolitan lifestyle and low taxes. The other 95% of billionaires live where they were born or where they launched their careers
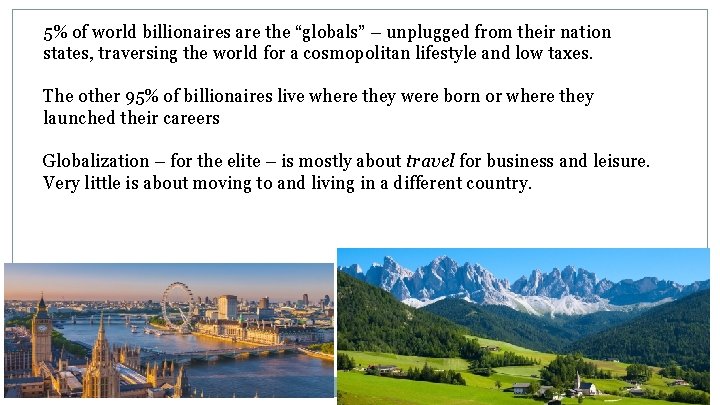
5% of world billionaires are the “globals” – unplugged from their nation states, traversing the world for a cosmopolitan lifestyle and low taxes. The other 95% of billionaires live where they were born or where they launched their careers Globalization – for the elite – is mostly about travel for business and leisure. Very little is about moving to and living in a different country.
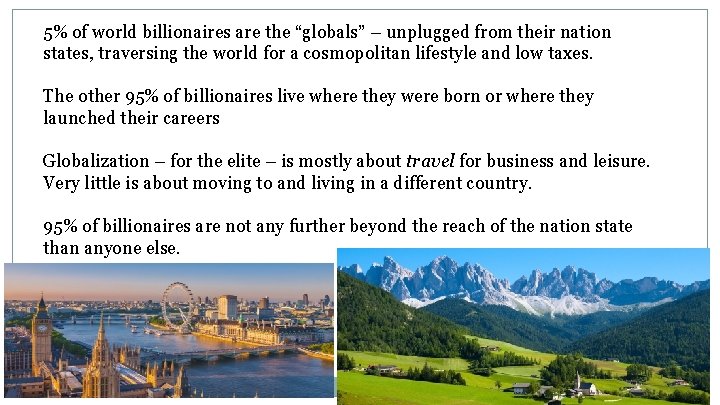
5% of world billionaires are the “globals” – unplugged from their nation states, traversing the world for a cosmopolitan lifestyle and low taxes. The other 95% of billionaires live where they were born or where they launched their careers Globalization – for the elite – is mostly about travel for business and leisure. Very little is about moving to and living in a different country. 95% of billionaires are not any further beyond the reach of the nation state than anyone else.
Should States Tax Millionaires?
Should States Tax Millionaires?
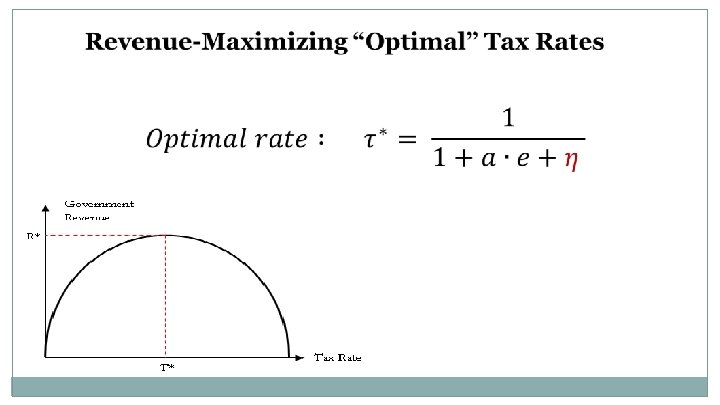
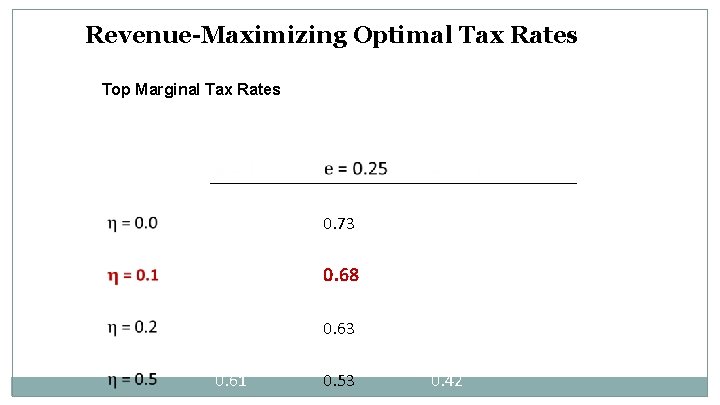
Revenue-Maximizing Optimal Tax Rates Top Marginal Tax Rates 0. 87 0. 73 0. 53 0. 80 0. 68 0. 50 0. 74 0. 63 0. 48 0. 61 0. 53 0. 42
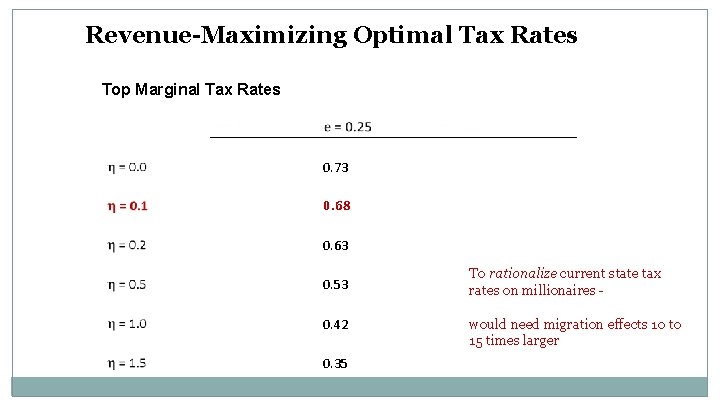
Revenue-Maximizing Optimal Tax Rates Top Marginal Tax Rates 0. 87 0. 73 0. 53 0. 80 0. 68 0. 50 0. 74 0. 63 0. 48 0. 61 0. 53 To rationalize current state tax 0. 42 rates on millionaires - 0. 47 0. 42 0. 34 would need migration effects 10 to 15 times larger 0. 38 0. 35 0. 29
Millionaire tax flight does sometimes occur. The magnitude is small has little impact on the stock of millionaires in a state Too small to matter for current tax policy
Why was the intuition about millionaire migration so wrong? Places are sticky. As people advance in their careers, they accumulate a lot of things that tie them to place: Marriages Children Businesses Place-specific social capital

Q 5. The Puzzle of Education & Income for Migration
Migration Rates by Age, for different education groups Migration Rate American Community Survey, 2005 -2014. N = 23, 429, 725. 14% 12% 10% 8% 6% 4% 2% 0% 18 -24 25 -29 Young adult 30 -34 35 -39 40 -44 45 -49 Middle age 50 -54 55 -59 60 -64 65+ Retirement age
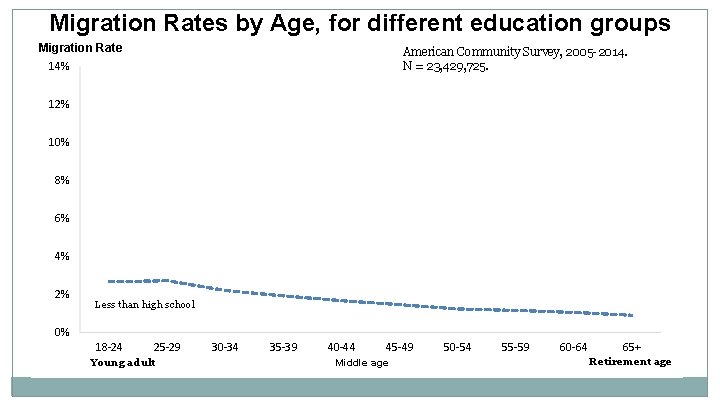
Migration Rates by Age, for different education groups Migration Rate American Community Survey, 2005 -2014. N = 23, 429, 725. 14% 12% 10% 8% 6% 4% 2% Less than high school 0% 18 -24 25 -29 Young adult 30 -34 35 -39 40 -44 45 -49 Middle age 50 -54 55 -59 60 -64 65+ Retirement age
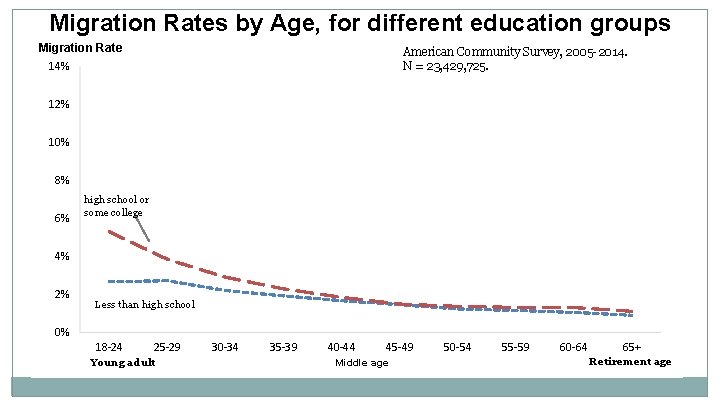
Migration Rates by Age, for different education groups Migration Rate American Community Survey, 2005 -2014. N = 23, 429, 725. 14% 12% 10% 8% 6% high school or some college 4% 2% Less than high school 0% 18 -24 25 -29 Young adult 30 -34 35 -39 40 -44 45 -49 Middle age 50 -54 55 -59 60 -64 65+ Retirement age
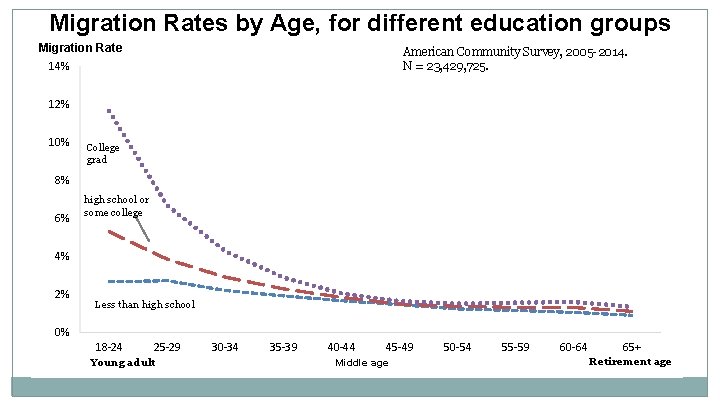
Migration Rates by Age, for different education groups Migration Rate American Community Survey, 2005 -2014. N = 23, 429, 725. 14% 12% 10% College grad 8% 6% high school or some college 4% 2% Less than high school 0% 18 -24 25 -29 Young adult 30 -34 35 -39 40 -44 45 -49 Middle age 50 -54 55 -59 60 -64 65+ Retirement age
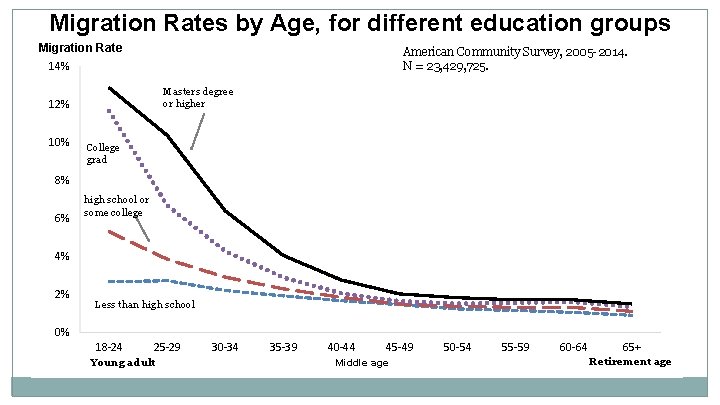
Migration Rates by Age, for different education groups Migration Rate American Community Survey, 2005 -2014. N = 23, 429, 725. 14% Masters degree or higher 12% 10% College grad 8% 6% high school or some college 4% 2% Less than high school 0% 18 -24 25 -29 Young adult 30 -34 35 -39 40 -44 45 -49 Middle age 50 -54 55 -59 60 -64 65+ Retirement age
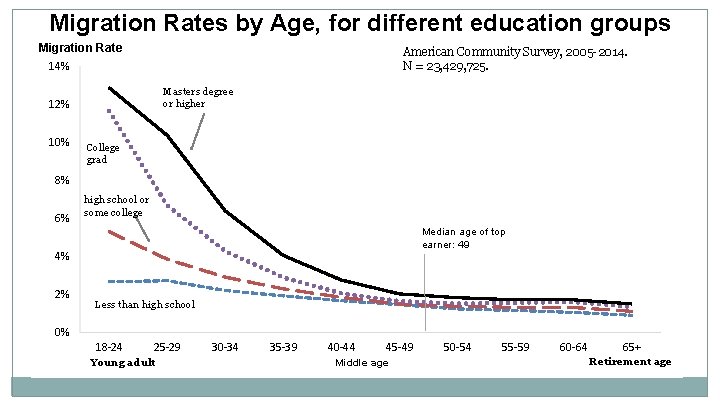
Migration Rates by Age, for different education groups Migration Rate American Community Survey, 2005 -2014. N = 23, 429, 725. 14% Masters degree or higher 12% 10% College grad 8% 6% high school or some college Median age of top earner: 49 4% 2% Less than high school 0% 18 -24 25 -29 Young adult 30 -34 35 -39 40 -44 45 -49 Middle age 50 -54 55 -59 60 -64 65+ Retirement age
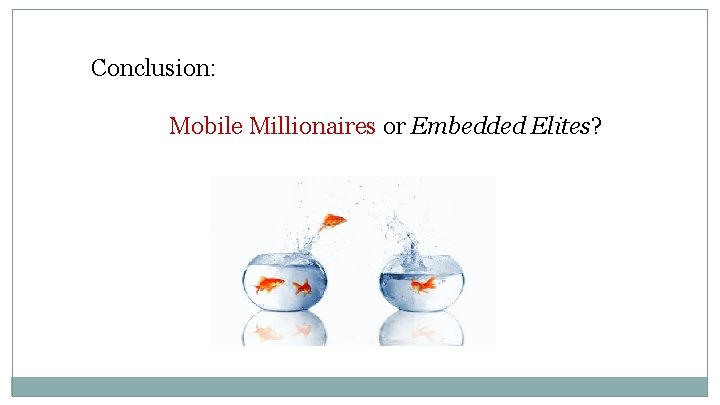
Conclusion: Mobile Millionaires or Embedded Elites? Millionaires move to Florida, but not to other low-tax states. In the border regions, there is weak evidence that high tax areas have fewer millionaire residents. The magnitudes of these effects are small.

Thank you! Comments: cristobal. young@stanford. edu
- Slides: 76