Credit Stress Testing What Examiners Expect and Steps


")


 Net Interest Income “Core”")


 Credit Stress Test")


 506 -8752")
- Slides: 62
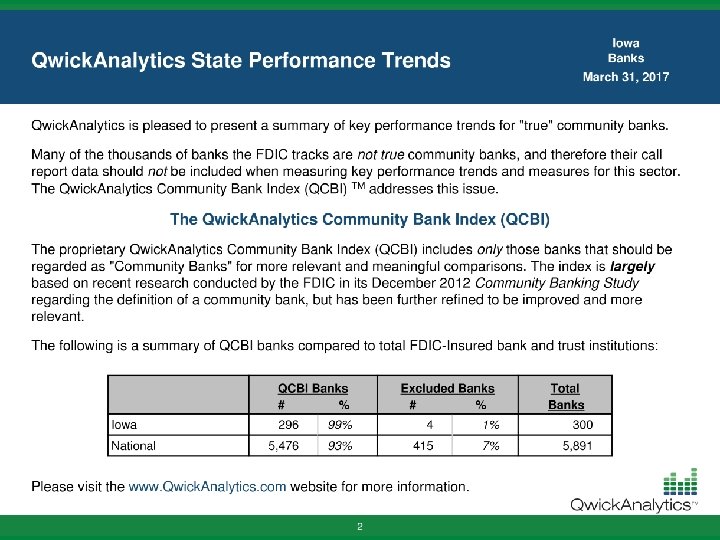
Credit Stress Testing: What Examiners Expect and Steps to Deliver Community Bankers of Iowa Peer Connection Forum June 1 st, 2017
Community Bank Stress Testing Do I Really Need To Do This? Yes (sorry)
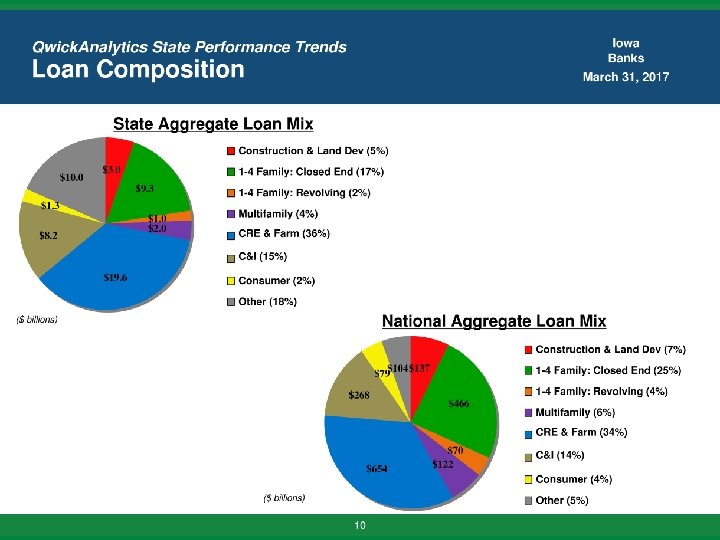
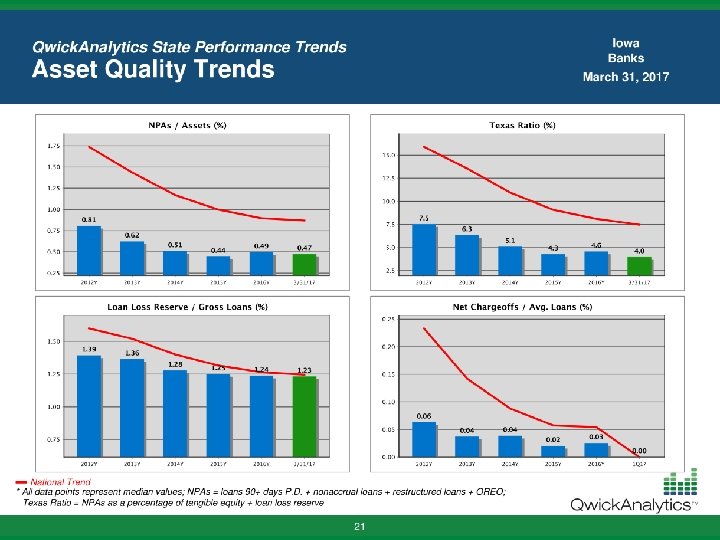
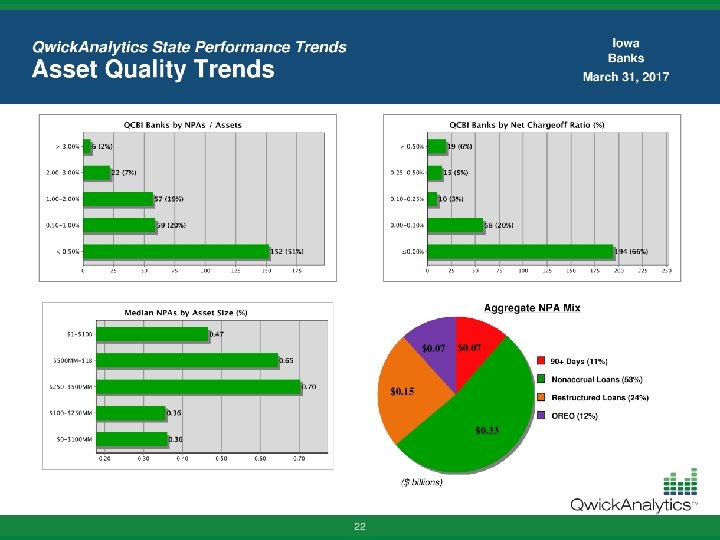
. . , but there is no Community Bank Stress? NPAs under 1% for QCBI banks NCOs almost negligible for QCBI banks 17
Why Are You Being Asked to Stress Test? § Do You Know What Would Happen To Your Borrowers if? • Rates increased 100 or 200 bps? • Commodity prices dropped significantly? • Capitalization rates changed? § How would any of these changes impact your borrowers?
Oversight – Risk Management § What are regulators looking to learn from you and your Bank? – How do you educate/inform your Board? – How do you identify and discuss risks? – Are you sensitive to or aware of concentration/correlation risks? – How do you compare to your peers? – Can you effectively manage what you do not measure? – What is your Strategic/Capital planning process?
Oversight – Risk Management Does the Bank Understand their Risk Profile?
Community Bank Stress Testing Post Crisis: What should have been the regulator’s response to what happened during the crisis? Was nothing an acceptable answer?
Why Are You Being asked to Stress Test? § I have no idea why! § Failed Bank autopsies – Boards & Management not on § § same page You should know more about the largest component of risk on your Balance Sheet! Next step
. . , because the Next Step is a Capital Plan § Every Bank needs one! § During the Crisis troubled bank’s Capital Plans were non§ existent or ineffective Credit Stress Test identifies when Capital might be necessary
6 Critical Tips for your Credit Stress Test 1. Know Your Responsibilities 2. 3. 4. 5. 6. 24 Know The Regs Around The Credit Stress Test Start Relatively Simply Get Good Data Don’t Forget Basel III Make It Useful to Your Board
6 Critical Tips 1. Know Your Responsibilities 2. Know The Regs Around The Credit Stress Test 3. 4. 5. 6. 25 Start Relatively Simply Get Good Data Don’t Forget Basel III Make It Useful to Your Board
The DFAST Bank Testing Banks $10 billion to $50 billion: 19 pages of instructions 27 different macroeconomic variables Mandatory templates with over 100 line item outputs 26
Divining Regulatory Expectations Statement to Clarify Supervisory Expectations for Stress Testing by Community Banks Issued Jointly By the Federal Reserve, OCC and FDIC May 14, 2012 27 “Community banks are not required or expected to conduct the types of stress testing specifically articulated in the initiatives…directed at larger organizations. In particular, community banks are not required or expected to conduct the enterprise-wide stress tests required of larger organizations under the …Dodd-Frank Act. ”
Divining Regulatory Expectations Statement to Clarify Supervisory Expectations for Stress Testing by | Community Banks Issued Jointly By the Federal Reserve, OCC and FDIC May 14, 2012 28 The agencies continue to emphasize that… “all banking organizations, regardless of size, should have the capacity to analyze the potential impact of adverse outcomes on their financial condition. ”
6 Critical Tips 1. Know Your Responsibilities 2. Know The Regs Around The Credit Stress Test 3. Start Relatively Simply 4. Get Good Data 5. Don’t Forget Basel III 6. Make It Useful to Your Board 29
Risk Management The best way to demonstrate risk management is to practice risk management!
Stress Test Methods Test Should Reflect Community Bank “A community bank’s approach to stress testing should fit its unique loan portfolio strategy, size, loan types, composition, operations and management. Given the smaller scale and lesser complexity of most community banks, assessing portfolio risk and capital vulnerability can be relatively simple. ” Concentration, Especially in CRE, May Merit Further Analysis “In some cases, a bottom-up, loan-by-loan analysis may help. . . For more complex portfolios … management may link commercial mortgages to debt service coverage and long-to-value ratios to project potential loss under possible adverse circumstances. Construction loans may be sensitive to particular variables such as selling rates, leasing activity, or oversupply. ” 31
Stress Test Methods Method Description Community Banks? Transaction stress testing Individual loan level analysis, borrower ability to pay analysis No Enterprise-level stress testing Multiple variable, environmental risk No Portfolio stress testing Loan category analysis against peer and historical loss experiences YES Reverse stress testing What stress level of losses “breaks the bank”? YES
Beyond the Portfolio Test? The regulators have NOT provided guidance around WHEN a bank may need more sophisticated, transaction-level analyses. However, reading the tea leaves… If your bank has very high concentrations in certain loan categories 1. – E. g. 300% Investor CRE / capital If your bank has experienced loan losses well above your peers 2. – E. g. in the 80 th percentile of your peer group 3. If you are growing loans quickly If you are a larger, more sophisticated bank 4. – E. g. trending closer to the $10 billion Dodd-Frank limit 33
Punchline! Regardless of the testing method used, an effective stress test has common elements that a community bank should include: 1 Asking plausible “what if” questions about key vulnerabilities (primarily loan losses for community banks); 2 Making a reasonable determination of how much impact the stress event or factor might have on earnings and capital; and OCC Supervisory Guidance October 18, 2012 34 3 Incorporating the resulting analysis into the overall risk management, asset/liability, and strategic and capital planning processes.
The Regulators’ 3 Tests Test 1 Test 2 Test 3 Peer Group Loss Experience Bank Historical Loss Experience Reverse Stress Test The bank’s Peer Group Loss Experience has been gathered, evaluated and applied to the subject bank’s loan portfolio under varying scenarios of stress. The bank’s actual Historical Loss Experience has been gathered, evaluated and applied to the bank’s current loan portfolio under varying scenarios of stress. The “Reverse Stress Test” has been applied to the bank’s own balance sheet, calculating the losses required to reduce the bank’s capital to critically undercapitalized levels. 35
6 Critical Tips 1. Know Your Responsibilities 2. Know The Regs Around The Credit Stress Test 3. Start Relatively Simply 4. Get Good Data 5. Don’t Forget Basel III 6. Make It Useful to Your Board 36
Basic Portfolio Stress Test Framework Step 1: Estimate Loan Portfolio Losses Calculate potential stressed losses over 2 -year period for entire portfolio 1. Loan Categories 1. 2. Period End Balances 3. Stress Loss Rates 2. 4. Stress Losses 3. 4. 37 Step 2: Estimate Earnings Offset / Impact Step 3: Estimate Impact on Capital Levels Calculate earnings available to fund losses Apply net impact to capital levels Core Operating Earnings (PTPC) Provisions required to (a) fund losses and (b) maintain ALLL levels Taxes and other items Net Income 1. 2. PF Impact to Tier 1 & Total Capital Calculate and compare relevant capital ratios
Core Operating Earnings: What? (a. k. a. Pre-Tax Pre-Provision, enhanced) Net Interest Income “Core” Non-Interest Income Excludes: • Securities G/L • OREO Costs 38 “Core” Non-Interest Expense Excludes: • Goodwill Write-offs Core Operating Earnings
Sorry! § § I know the following slides will be hard to see/read. I will send you a copy of your Bank’s Credit Stress Test. I will also send a copy of the revised presentation. If I don’t have your email address, please give me a card and I will send when I am back in the office.
2 -Year Projection of Earnings Historical Financials & Base Projections Income Statement Net Interest Income Net Interest Margin 2012 2013 2014 Assumed 2 -Year Base Projection LTM 09/30/2016 2015 $1, 673 3. 68% $1, 685 3. 75% $1, 729 3. 89% $1, 697 3. 85% $1, 850 4. 28% $3, 700 $77 $81 $156 $228 $250 $500 ($1, 049) ($1, 124) ($1, 240) ($1, 309) ($1, 318) ($2, 636) $701 $642 $645 $616 $782 $1, 564 as % of avg. assets 1. 33% 1. 30% 1. 25% 1. 62% Loan Loss Provision ($268) ($211) ($62) ($98) ($113) (Loss)/gain on Sale OREO $0 $0 $0 Other Non-Recurring Items ($107) ($105) ($107) $326 $324 $476 $413 $562 Taxes ($113) ($106) ($129) ($136) ($232) Tax Rate 34. 7% 32. 7% 27. 1% 32. 9% 41. 3% Extraordinary items, net of tax $0 $0 $0 Income attrib. to minority interest $0 $0 $0 $213 $218 $347 $277 $330 Recurring Noninterest Income Recurring Noninterest Expense Pretax, Pre-Provision Recurring Income Pretax Income Bank Net Income Net Loss Experience (Net Chargeoffs)/Recoveries 41. 3% ($294) ($230) ($59) ($97) ($57) Balance Sheet Total Assets $49, 651 $49, 371 $50, 169 $48, 060 $50, 215 Gross Loans HFI, net of unearned inc. $27, 376 $28, 031 $29, 810 $31, 234 $33, 922 $310 $291 $294 $271 $316 1. 13% 1. 04% 0. 99% 0. 87% 0. 93% $200 $230 $275 $300 $265 $530 $0 Loan Loss Reserve/Gross Loans Common Dividends Paid Preferred Dividends Paid $0 $0 $0 Tangible Common Equity $3, 807 $3, 886 $4, 068 $4, 150 $4, 369 Regulatory Capital Regulatory Tangible Equity $3, 950 $4, 008 $4, 152 $4, 241 $4, 372 NA NA NA $4, 241 $4, 372 Tier 1 Capital $3, 950 $4, 008 $4, 152 $4, 241 $4, 372 Total Risk-Based Capital $4, 260 $4, 299 $4, 446 $4, 512 $4, 688 Risk-Weighted Assets $27, 223 $27, 965 $30, 249 $31, 929 $33, 530 Total Assets for Leverage Ratio $47, 335 Common Equity Tier 1 Capital $48, 725 $45, 109 $48, 588 $44, 966 $47, 367 Reg. Tangible Equity/Total Assets 7. 96% 8. 12% 8. 28% 8. 82% 8. 71% Tier 1 Leverage Ratio 8. 11% 8. 89% 8. 55% 9. 43% 9. 23% NA NA NA 13. 28% 13. 04% Tier 1 Ratio 14. 51% 14. 33% 13. 73% 13. 28% 13. 04% Total Risk-Based Ratio 15. 65% 15. 37% 14. 70% 14. 13% 13. 98% Common Equity Tier 1 Ratio
Determining Your Loss Rates § Utilize Call Report Categories § Identify Historical Loss Rates § Multiply Call Report Loan Balances by Loss Rates for each category in each scenario • . . , don’t overthink this! • Keep it very straightforward! • The objective is to give you goal posts.
3 Loss Scenario for Historical & Peer Tests § Baseline Scenario • Your Historical Experience Your loss rates for the 4 most recent quarters • Peer Loss Test – Average losses for the most 4 recent quarters § Adverse Scenario • Your Historical Experience – Average of 2 worst years of losses • Peer Loss Test – 75 th percentile of peer losses § Severely Adverse Scenario • Your Historical Test – Your Worst year of losses • Peer Loss Test – 90 th percentile of peer losses
Peer Loss Rate Example Credit Stress Test Severely Adverse Stress Loss Assumptions Call Report Categories 3 “Stress Years” Peer Group Historical Loss Rates (90 th Percentile) Severely Adverse Stress Loss Scenario 2009 2010 2011 Average Construction & Development: 1 -4 Family Construction 0. 00% Other Construction & Land (13. 64%) (3. 22%) (12. 36%) (9. 74%) Secured by Farmland 0. 00% Residential 1 -4 Family: Home Equity Loans 0. 00% (1. 55%) (0. 52%) as % of loan-type avg. balance 1 -4 Family Non-Revolving (0. 70%) (0. 91%) (0. 84%) Multifamily Loans 0. 00% Nonfarm Nonresidential: Owner / Occupied 0. 00% (0. 12%) 0. 00% (0. 04%) 0. 00% Commercial and Industrial Loans (5. 81%) (3. 55%) (3. 80%) (4. 39%) Consumer: Credit Card Loans (5. 45%) (7. 86%) (3. 95%) (5. 75%) Other Loans to Individuals (2. 80%) (2. 90%) (1. 34%) (2. 35%) All Other Loans & Leases (3. 68%) (5. 01%) (0. 59%) (3. 10%) Total Net (Loss)/Recovery / Avg Loans (Loss)/gain on Sale OREO/Avg Assets Loan Loss Reserve/Gross Loans (2. 32%) (0. 04%) 2. 90% (1. 79%) (0. 04%) 3. 29% (1. 78%) (0. 13%) 3. 27% (0. 07%) 3. 27% Investor Agricultural Loans
Estimate Portfolio Losses for Each Scenario Credit Stress Test Applying Peer Loss Experience to Bank Loan Portfolio Composition Current Balances 09/30/2016 Baseline Scenario Adverse Stress Loss Scenario Severely Adverse Stress Loss Scenario 2 -Year Pro Forma Losses % Construction & Development: 1 -4 Family Construction Other Construction & Land Secured by Farmland Residential 1 -4 Family: Home Equity Loans 1 -4 Family Non-Revolving Multifamily Loans Nonfarm Nonresidential: Owner / Occupied Investor Agricultural Loans Commercial and Industrial Loans Consumer: Credit Card Loans Other Loans to Individuals All Other Loans & Leases Total Loans (Loss)/gain on Sale of OREO Indicated Loan Loss Reserve $ % $428 $70 $4, 288 $0 $0 $0 0. 00% (0. 05%) 0. 00% $0 ($5) $0 $0 (0. 05%) 0. 00% (0. 05%) ($1) $0 $0 ($1) $0 $3, 903 $53 (0. 56%) (0. 19%) (0. 72%) $33, 922 $0 $316 (0. 04%) 0. 00% 1. 48% 0. 00% (19. 48%) 0. 00% $0 ($14) $0 0. 00% (0. 12%) 0. 00% $0 ($12) $0 (1. 03%) (1. 68%) 0. 00% ($3) ($159) $0 0. 00% (1. 75%) $0 $0 $0 ($34) 0. 00% (0. 08%) 0. 00% (8. 78%) $0 ($5) $0 ($168) $0 ($7) $0 (2. 30%) (1. 68%) 0. 00% $0 ($66) $0 (11. 51%) (4. 69%) (6. 19%) $0 ($183) ($15) $1 $501 (0. 33%) 0. 00% 2. 25% ($111) $0 $760 (1. 58%) (0. 14%) 3. 27% ($536) ($71) $1, 091 $ 0. 00% $2, 041 $6, 831 $3, 612 $1, 914 % 0. 00% $285 $9, 504 $993 $
2 Year Cumulative Pro Forma Earnings Impact (Losses +Projected Core Earnings) Credit Stress Test Pro Forma Earnings Impact: Applying Estimated Stressed Losses Against Projected Core Earnings 2 -Year Cumulative Pro Forma Earnings Impact Pro Forma Income Statement Net Interest Income Baseline Scenario Adverse Stress Loss Severely Adverse Scenario Stress Loss Scenario $3, 704 $3, 700 $3, 682 $500 ($2, 636) $1, 568 $1, 564 $1, 546 ($15) ($111) ($536) Provision to achieve adequate ALLL ($185) ($444) ($775) Total Loan Loss Provision Expense ($200) ($555) ($1, 311) $1 $0 ($71) Pretax Income $1, 369 $1, 009 $164 Income Taxes ($565) ($417) ($68) $804 $592 $96 $33, 922 $33, 826 $33, 401 $501 $760 $1, 091 1. 48% 2. 25% 3. 27% Other Recurring Noninterest Income Recurring Noninterest Expense Pretax, Pre-Provision Recurring Income Provision to cover 2 -year Net Loan Losses (Loss)/gain on Sale OREO 2 -Year Net Income Pro Forma Balance Sheet Items Gross Loans HFI, net of unearned inc. Loan Loss Reserve/Gross Loans
Apply Losses to Capital Credit Stress Test Pro Forma Capital Impact: How Stressed Losses and Earnings Impact Capital 2 -Year Pro Forma Projection Capital Impact Current Balances 09/30/2016 Baseline Scenario Adverse Stress Loss Scenario Severely Adverse Stress Loss Scenario Changes to Equity 2 -Year Net Income/(Loss) $804 $592 $96 Less: Dividends Paid $530 $391 $64 Capital Levels Tangible Common Equity Regulatory Tangible Equity $4, 369 $4, 372 $4, 643 $4, 614 $4, 571 $4, 542 $4, 402 $4, 373 Common Equity Tier 1 Capital $4, 372 $4, 614 $4, 542 $4, 373 Total Risk-Based Capital $4, 688 $5, 033 $4, 960 $4, 785 Regulatory Capital Ratios Reg. Tangible Equity/Total Assets 8. 71% 9. 19% 9. 06% 8. 80% Tier 1 Leverage Ratio 9. 23% 9. 75% 9. 61% 9. 34% Common Equity Tier 1 Ratio 13. 04% 13. 76% 13. 58% 13. 25% Total Risk-Based Ratio 13. 98% 15. 01% 14. 83% 14. 50% Pro Forma Increase/(Decrease) Reg. Tangible Equity/Total Assets 0. 48% 0. 36% 0. 09% Tier 1 Leverage Ratio 0. 52% 0. 38% 0. 11% Common Equity Tier 1 Ratio 0. 72% 0. 55% 0. 21% Total Risk-Based Ratio 1. 03% 0. 85% 0. 52% Memo Total Assets $50, 215 $50, 119 $49, 694 Total Assets for Leverage Ratio $47, 335 $47, 239 $46, 814 Risk-Weighted Assets $33, 530 $33, 434 $33, 009
Review of Methodology 2 Years of Earnings 47 2 Year Estimate of Credit Losses for each scenario Add/(Subtract) After Tax Earnings/(Losses) from Existing Capital Calculate Pro Forma Capital Ratios
What Level of Losses Will it Take to “Break the Bank? ” What Losses Will It Take to "Break" the Bank? 2 -Year Pro Forma Reverse Stress Test Regulatory Capital Ratio Minimums Tangible Equity/Total Assets threshold Tier 1 Leverage Ratio Common Equity Tier 1 Ratio Total Risk-Based Ratio 2 -Year Pro Forma Regulatory Capital Balances Tangible Common Equity Regulatory Tangible Equity Common Equity Tier 1 Capital Total Risk-Based Capital Earnings & Loss Requirements to Breach Thresholds 2 -Year net income/(loss) required to breach threshold 2 -Year pretax income/(loss) Offsetting pretax, preprovision recurring income Total provision & OREO (losses)/gains Less: Portion of provision to achieve required ALLL Well Capitalized Min -5. 00% 6. 50% 8. 00% 10. 00% Adequately Capitalized Bank 5. 59% 5. 97% 8. 75% 10. 00% Min -4. 00% 4. 50% 6. 00% 8. 00% Critically Under- Capitalized Bank 4. 28% 4. 57% 6. 75% 8. 00% Min 2% ----- Bank 2. 00% 2. 06% 3. 09% 4. 34% $2, 614 $2, 585 $2, 955 $1, 981 $1, 952 $2, 314 $884 $887 $855 $1, 200 ($1, 755) ($2, 988) $1, 394 ($4, 382) ($200) ($2, 388) ($4, 067) $1, 367 ($5, 434) ($460) ($3, 485) ($5, 936) $1, 312 ($7, 248) ($580) Total loan & OREO (losses)/gains required to breach threshold ($4, 182) ($4, 974) ($6, 668) % of current loans % of current assets Other Assumptions Required Loan Loss Reserve Gross Loans Total Assets for Leverage Ratio Risk-Weighted Assets (12. 33%) (8. 33%) (14. 66%) (9. 91%) (19. 66%) (13. 28%) 1. 60% $29, 938 $46, 231 $43, 319 $29, 546 2. 50% $29, 311 $45, 604 $42, 692 $28, 919 3. 00% $28, 035 $44, 328 $41, 416 $27, 643
6 Critical Tips 1. 2. 3. 4. Know Your Responsibilities Know The Regs Around The Credit Stress Test Start Relatively Simply Get Good Data 5. Don’t Forget Basel III 6. Make It Useful to Your Board 49
The Impact of Basel III 1. Higher Overall Levels of Common Equity Required ü Leverage & Tier 1 capital creativity is frowned upon 2. New enforcement powers: restrictive rules around shareholder distributions, buybacks and bonuses, all limited by capital levels ü Capital Conservation Buffer Common Equity = KING 3. More detailed and conservative approach to weighting the risk of assets (administratively burdensome) ü Larger denominator = MORE CAPITAL RESULT 50 More Capital & More Administration
Basel III: Phase-Ins Not only are there new ratios… …but also a phase-in mechanism. 51
Basel III: More Phase-Ins Capital Conservation Buffers are Even More Important to Plan for. 52
Restrictions Under Basel III Restricted Freedom of Action • Make tax distributions for S-Corps • Pay dividends for C-Corps • Buy back shares • Pay management bonuses, etc. 53
6 Critical Tips 1. 2. 3. 4. 5. Know Your Responsibilities Know The Regs Around The Credit Stress Test Start Relatively Simply Get Good Data Don’t Forget Basel III 6. Make It Useful to Your Board 54
Regulatory Expectations Stress Testing and Capital Planning If the results of a stress test indicate that capital ratios could fall below the level needed to adequately support the bank’s overall risk profile, the bank’s board and management should take appropriate steps to protect the bank from such an occurrence. This may include establishing a plan that requires closer monitoring of market information, adjusting strategic and capital plans to mitigate risk, changing risk appetite and risk tolerance levels, limiting or stopping loan growth or adjusting the portfolio mix, adjusting underwriting standards, raising more capital, and selling or hedging loans to reduce the potential impact from such stress events. John C. Lyons Jr. Senior Deputy Comptroller and Chief National Bank Examiner October 2012 55 The Board Must Get Involved
Display Digestible Data § Comprehensible: summarize the results in graph form § Actionable: make implications of results easy to understand § Credible: provide detailed assumptions behind summaries if needed § Consistent: be able to replicate annually at least
Tie Results to Capital Planning § Action Plan: incorporate stress testing results into capital planning § Up-To-Date: ensure future capital rations include all levels of Basel III phase-ins § Document: provide evidence of proactive planning in “file”
Final Thoughts Basel III tells you how much capital you need to operate your bank; the Credit Stress Test tells you how much capital you need to survive another crisis!
Return of Capital §Bank Shareholders today are worried equally about the Return of their Capital as they are about the Return on their Capital!
Complimentary Credit Stress Test Regulatory and Compliance Bank & Peer Performance Exceed examiner expectations effortlessly. Easily create peer benchmarking and competitive analysis. • Credit Stress Test • Basel III Capital Planning • Reg F Snapshot • • • Bank Performance Report Card Peer. Watch Trends Peer. Watch Liquidity Risk Report Reg F Snapshot Complimentary Credit Stress Test For Your Bank Please email Ricki or Melissa if I don’t have your email address. Ricki ricki. dagosta@qwickrate. com 61 Melissa melissa. wallace@qwickrate. com
Thank You For Attending! Greg Dingens Monroe Financial Partners gd@monroefp. com (312) 506 -8752 Shawn O’Brien Qwick. Rate shawn. obrien@qwickrate. com (815) 468 -3445 62