
Credit Scoring is becoming increasing important because of

Credit Scoring is becoming increasing important because of the forces shaping the business environment that are creating greater complexity BIG DATA DEMANDS BIG INSIGHT: Companies must sift through huge quantities of data to arrive at actionable insight GROWING GLOBALIZATION: Information is massively connected, created and consumed everywhere PROLONGED ECONOMIC UNCERTAINTY: Continued uncertain financial outlook is forcing businesses to do more with less DISRUPTIVE TECHNOLOGICAL CHANGE: Businesses must embrace new but quickly adopted social, mobile, local and cloud technologies 1
Credit Scoring also help Risk Managers with many of the day to day challenges they are faced with • • • In today’s fast-paced business environment, managing risk and improving cash flow are more challenging than ever before. You are at greater risk from incurring potential bad debt due to bankruptcy and fraud. You need to increase cash flow at a time when economic pressure is causing companies to use you as a source of funding by paying you slower. You are under pressure to make your credit function more efficient without increased risk. You must comply with increased regulation, such as the Sarbanes. Oxley Act, which requires financial executives and credit practitioners to better understand risk in their portfolios. You need to do all of the above very well … while maximizing your company’s sales by approving all reasonable requests for credit. 2
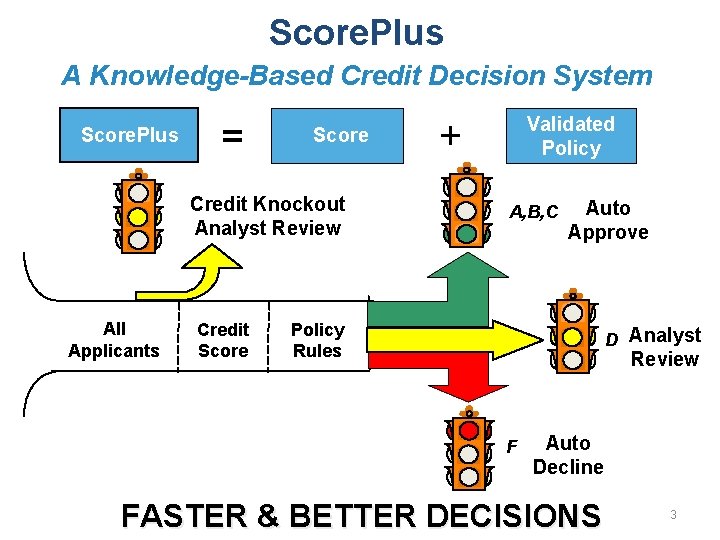
Score. Plus A Knowledge-Based Credit Decision System Score. Plus = Score Credit Knockout Analyst Review All Applicants Credit Score Validated Policy + A, B, C Auto Approve Policy Rules D Analyst Review F Auto Decline FASTER & BETTER DECISIONS 3
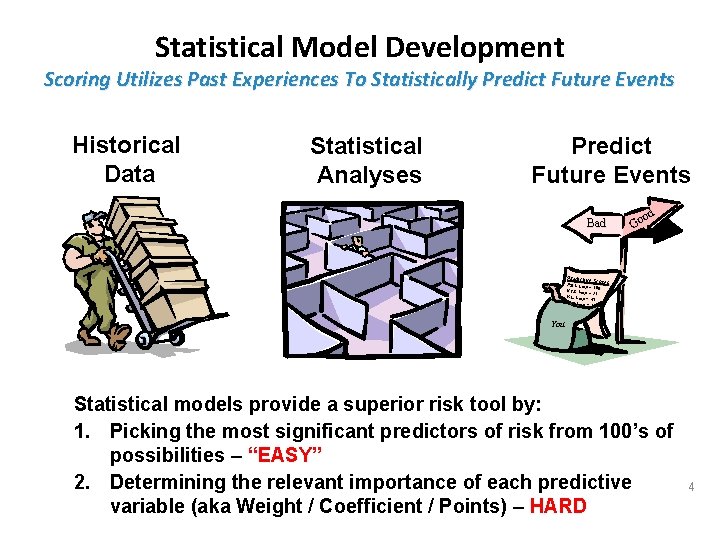
Statistical Model Development Scoring Utilizes Past Experiences To Statistically Predict Future Events 11 Historical Data Statistical Analyses Predict Future Events Bad od Go Predictive Sc ores ABC Corp = 100 XYZ Corp = 71 JKL Corp = 45 DEF Corp = 23 You Statistical models provide a superior risk tool by: 1. Picking the most significant predictors of risk from 100’s of possibilities – “EASY” 2. Determining the relevant importance of each predictive variable (aka Weight / Coefficient / Points) – HARD 4
Key Data Elements “Round Up The Usual List of Suspects…” Ø Generic Scores / Ratings Ø Trade Data ü Company Specific ü Industry Specific ü General Trade Ø Business Age Ø Business Size Ø Financial Ø Public Records Ø Industry Specific Data 5

NACM National Trade Database Scoring Model Update VERIFY, VALIDATE, AND UPDATE 6
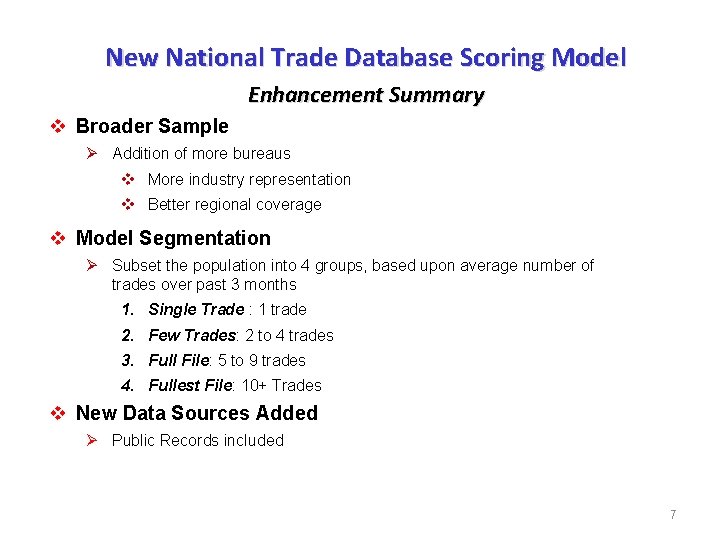
New National Trade Database Scoring Model Enhancement Summary v Broader Sample Ø Addition of more bureaus v More industry representation v Better regional coverage v Model Segmentation Ø Subset the population into 4 groups, based upon average number of trades over past 3 months 1. Single Trade : 1 trade 2. Few Trades: 2 to 4 trades 3. Full File: 5 to 9 trades 4. Fullest File: 10+ Trades v New Data Sources Added Ø Public Records included 7

Model Performance – CIC File Distribution by Risk Class Distribution of Firms and Balances 45% 42. 9% 40% 35% Firms 32. 7% $ Balance 30% 24. 0% 25% 20. 0% 19. 7% 21. 4% 15% 9. 8% 10% 3. 5% 5% 9. 1% 8. 7% 5. 3% 3. 0% 0% 1 2 3 4 A 4 B 5 Score Class 8
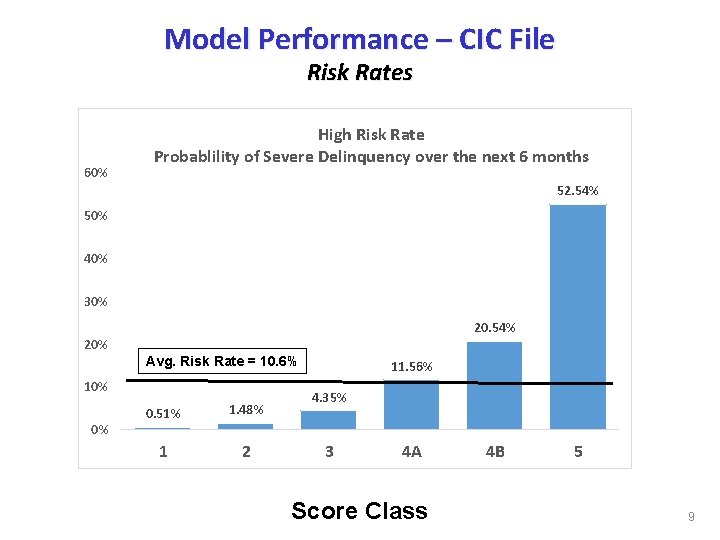
Model Performance – CIC File Risk Rates 60% High Risk Rate Probablility of Severe Delinquency over the next 6 months 52. 54% 50% 40% 30% 20. 54% 20% Avg. Risk Rate = 10. 6% 10% 0% 0. 51% 1. 48% 1 2 11. 56% 4. 35% 3 4 A Score Class 4 B 5 9

Portfolio Risk Management Benefit Strategic Risk Management Tool § Valuable tool for senior credit management to identify account level credit issues and overall portfolio risk § Validate predictive power of score on your customer base to help make informed credit decisions § Identify trends in both portfolio to “act” rather than “react” § Query risk rated accounts for special targeted treatment, increase / reduce credit line, prioritize collection efforts, workout, … § Better leverage resources based upon the 20 / 80 Pareto rule, focusing skilled personnel on high exposure accounts § “Hands on” tool for the experienced credit professionals to track the portfolio and leverage experience to minimize credit “oops” Move from “doing deals” to managing a portfolio of risk 10
Intro to dun&bradstreet Scoring Model Summary VERIFY, VALIDATE, AND UPDATE 11 11
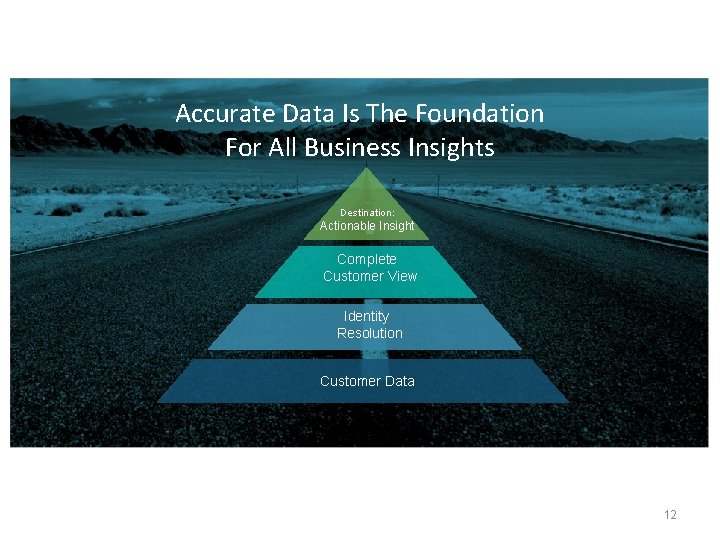
Accurate Data Is The Foundation For All Business Insights Destination: Actionable Insight Complete Customer View Identity Resolution Customer Data 12
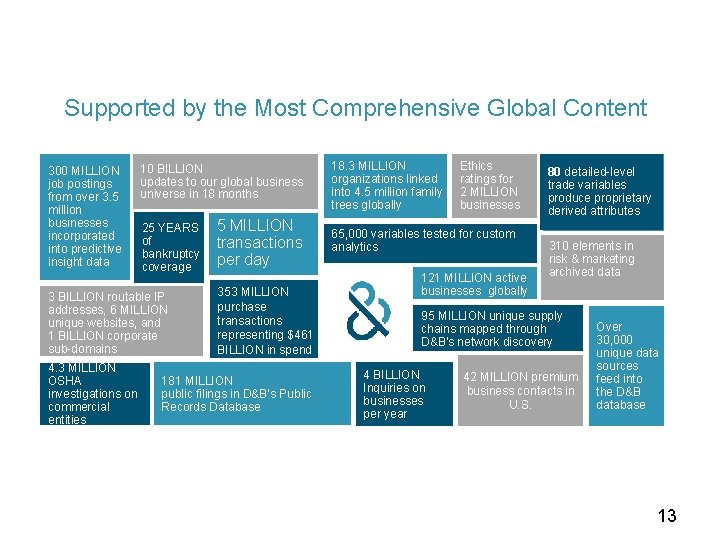
Supported by the Most Comprehensive Global Content 300 MILLION job postings from over 3. 5 million businesses incorporated into predictive insight data 10 BILLION updates to our global business universe in 18 months 25 YEARS of bankruptcy coverage 3 BILLION routable IP addresses, 6 MILLION unique websites, and 1 BILLION corporate sub-domains 4. 3 MILLION OSHA investigations on commercial entities 5 MILLION transactions per day 353 MILLION purchase transactions representing $461 BILLION in spend 181 MILLION public filings in D&B’s Public Records Database 18. 3 MILLION organizations linked into 4. 5 million family trees globally Ethics ratings for 2 MILLION businesses 65, 000 variables tested for custom analytics 121 MILLION active businesses globally 80 detailed-level trade variables produce proprietary derived attributes 310 elements in risk & marketing archived data 95 MILLION unique supply chains mapped through D&B’s network discovery process 4 BILLION Inquiries on businesses per year 42 MILLION premium business contacts in U. S. Over 30, 000 unique data sources feed into the D&B database 13
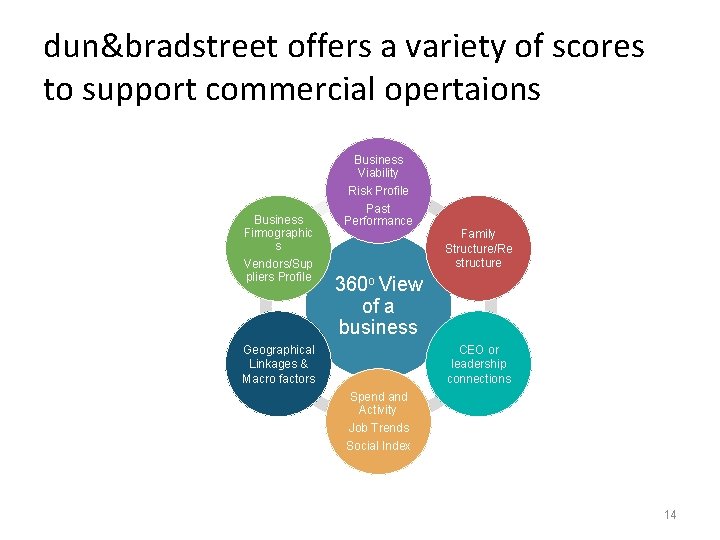
dun&bradstreet offers a variety of scores to support commercial opertaions Business Viability Business Firmographic s Vendors/Sup pliers Profile Risk Profile Past Performance Family Structure/Re structure 360 o View of a business Geographical Linkages & Macro factors CEO or leadership connections Spend and Activity Job Trends Social Index 14
dun&bradstreet predictive scoring suite for the Commercial Credit Manager • Viability • Commercial Credit Score (Delinquency Score) • Financial Stress Score 15
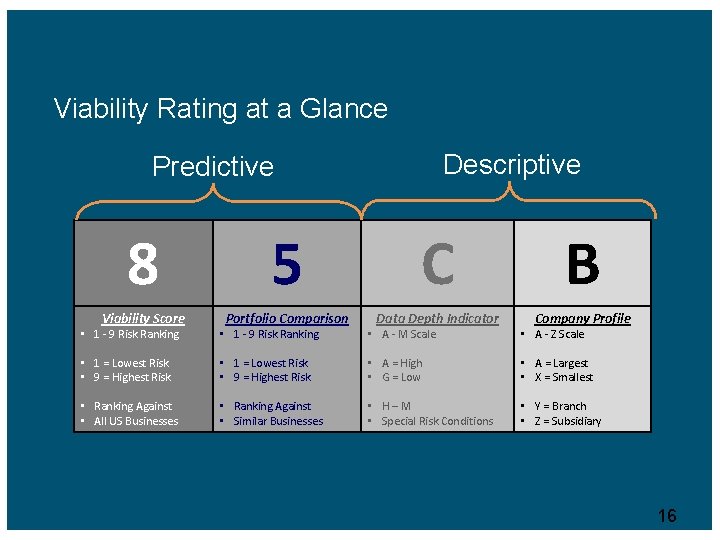
Viability Rating at a Glance Descriptive Predictive 8 5 C B Viability Score Portfolio Comparison Data Depth Indicator Company Profile • 1 - 9 Risk Ranking • A - M Scale • A - Z Scale • 1 = Lowest Risk • 9 = Highest Risk • A = High • G = Low • A = Largest • X = Smallest • Ranking Against • All US Businesses • Ranking Against • Similar Businesses • H–M • Special Risk Conditions • Y = Branch • Z = Subsidiary 16
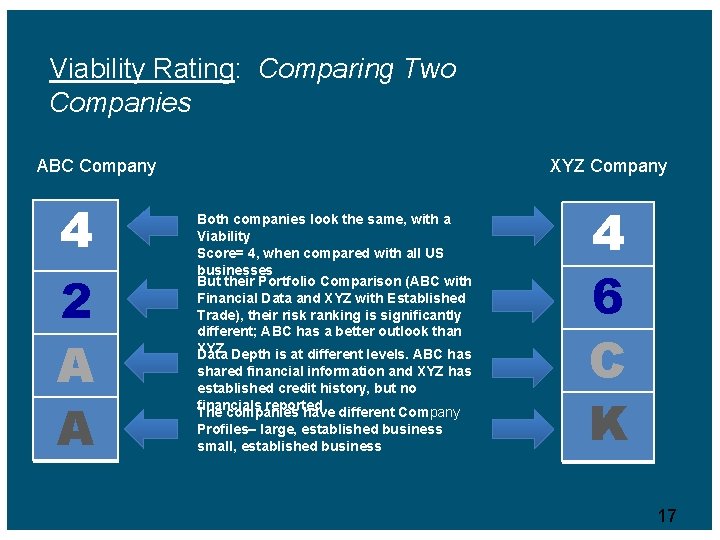
Viability Rating: Comparing Two Companies ABC Company 4 2 A A XYZ Company Both companies look the same, with a Viability Score= 4, when compared with all US businesses But their Portfolio Comparison (ABC with Financial Data and XYZ with Established Trade), their risk ranking is significantly different; ABC has a better outlook than XYZ Depth is at different levels. ABC has Data shared financial information and XYZ has established credit history, but no financials reported The companies have different Company Profiles– large, established business small, established business 4 6 C K 17
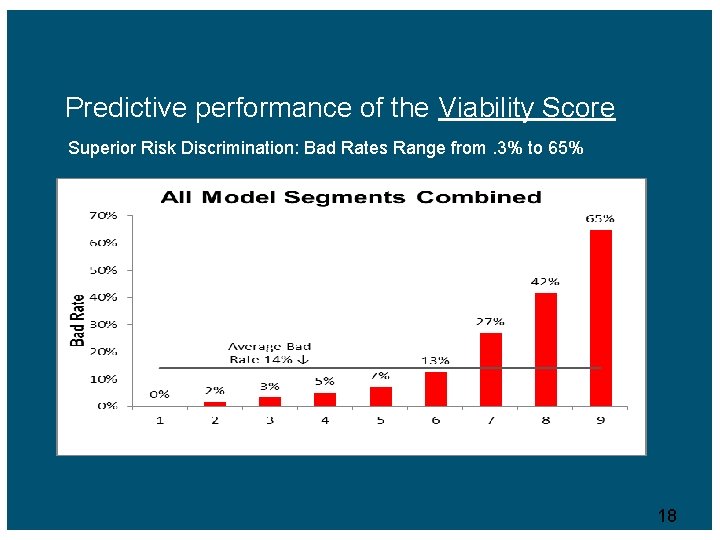
Predictive performance of the Viability Score Superior Risk Discrimination: Bad Rates Range from. 3% to 65% 18
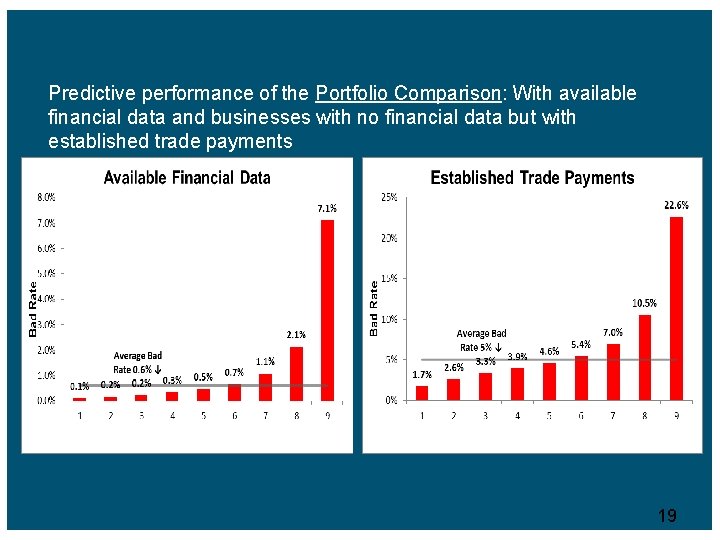
Predictive performance of the Portfolio Comparison: With available financial data and businesses with no financial data but with established trade payments 19
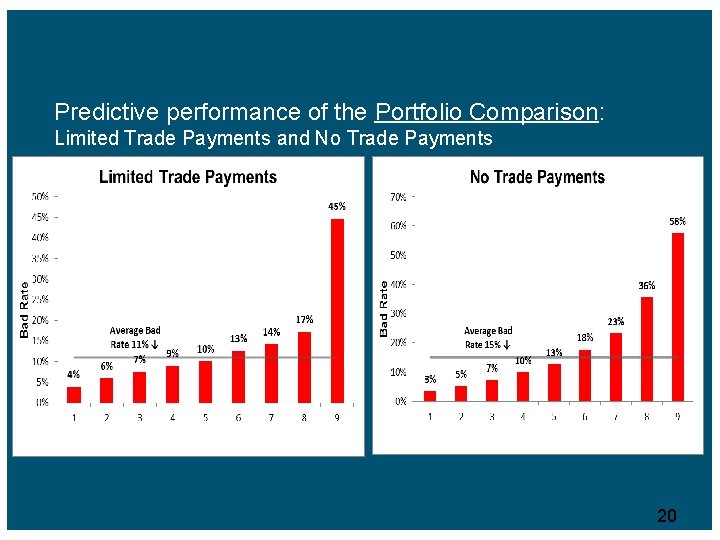
Predictive performance of the Portfolio Comparison: Limited Trade Payments and No Trade Payments 20
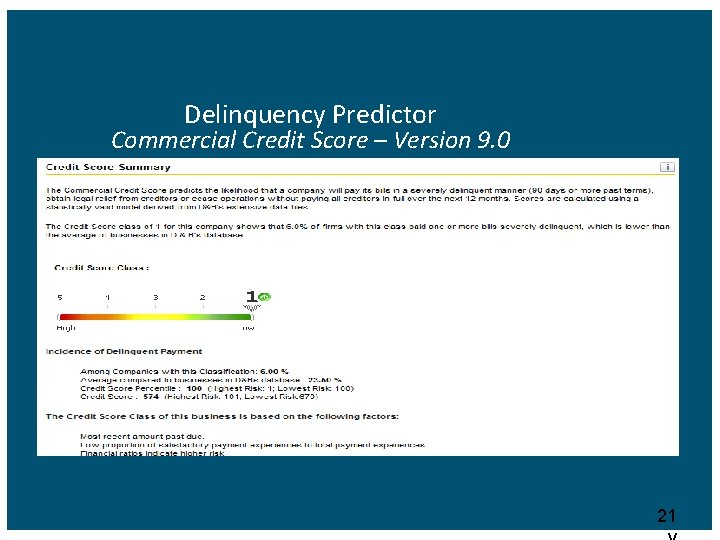
Delinquency Predictor Commercial Credit Score – Version 9. 0 21
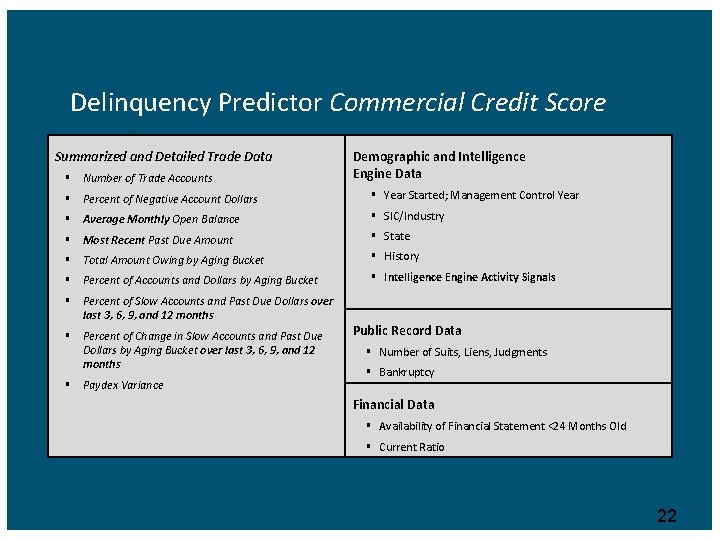
Delinquency Predictor Commercial Credit Score Summarized and Detailed Trade Data § Number of Trade Accounts Demographic and Intelligence Engine Data § Percent of Negative Account Dollars § Year Started; Management Control Year § Average Monthly Open Balance § SIC/Industry § Most Recent Past Due Amount § State § Total Amount Owing by Aging Bucket § History § Percent of Accounts and Dollars by Aging Bucket § Intelligence Engine Activity Signals § Percent of Slow Accounts and Past Due Dollars over last 3, 6, 9, and 12 months § Percent of Change in Slow Accounts and Past Due Dollars by Aging Bucket over last 3, 6, 9, and 12 months § Paydex Variance Public Record Data § Number of Suits, Liens, Judgments § Bankruptcy Financial Data § Availability of Financial Statement <24 Months Old § Current Ratio 22
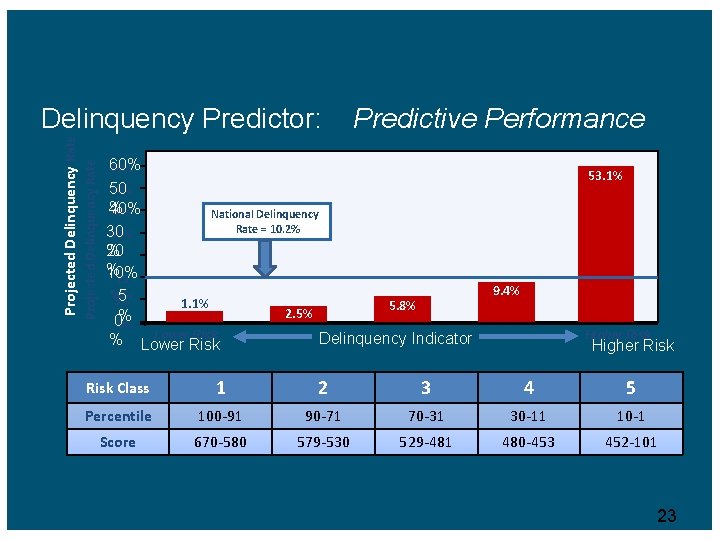
Projected Delinquency Rate Delinquency Predictor: Predictive Performance 60% 50% 50 % 4 0% 40% 30 30% 20 % % 115 0% 5 5% % 00% % 53. 1% National Delinquency Rate = 10. 2% 1. 1% 5. 8% 2. 5% Lower Risk 9. 4% Higher Risk Delinquency Indicator Risk Class 1 2 Delinquency 3 Predictor Percentile 100 -91 90 -71 Score 670 -580 579 -530 Higher Risk 4 5 70 -31 30 -11 10 -1 529 -481 480 -453 452 -101 23
U. S. Delinquency Predictor (Commercial Credit Score V 9) • The most recent validation of the Delinquency Predictor was conducted in June 2016. The validation results indicate that the score outperformed the rigorous performance standards that D&B sets for all of its statistical models. o Validation Sample: 733, 588 records o Observation Date: Dec. 2014 o Performance Window: Jan. 2015 – Dec. 2015 24
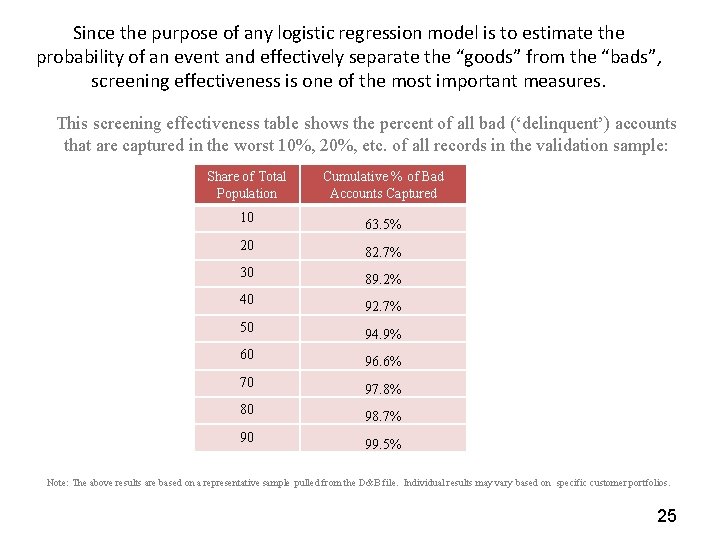
Since the purpose of any logistic regression model is to estimate the probability of an event and effectively separate the “goods” from the “bads”, screening effectiveness is one of the most important measures. This screening effectiveness table shows the percent of all bad (‘delinquent’) accounts that are captured in the worst 10%, 20%, etc. of all records in the validation sample: Share of Total Population 10 20 30 40 50 60 70 80 90 Cumulative % of Bad Accounts Captured 63. 5% 82. 7% 89. 2% 92. 7% 94. 9% 96. 6% 97. 8% 98. 7% 99. 5% Note: The above results are based on a representative sample pulled from the D&B file. Individual results may vary based on specific customer portfolios. 25
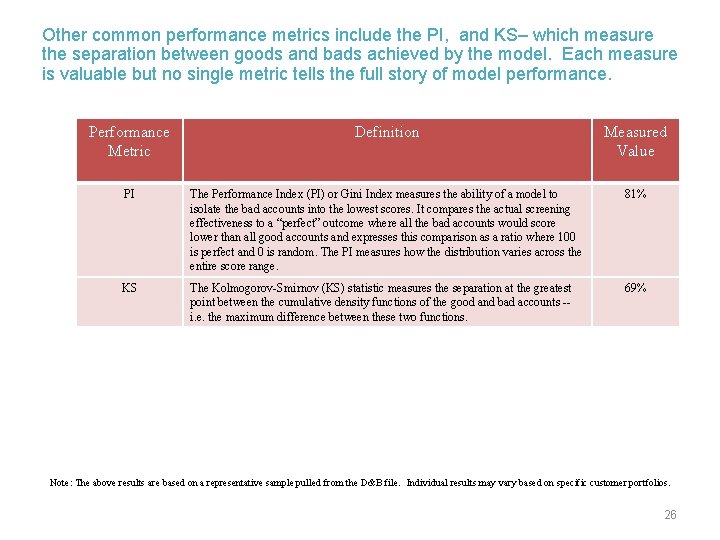
Other common performance metrics include the PI, and KS– which measure the separation between goods and bads achieved by the model. Each measure is valuable but no single metric tells the full story of model performance. Performance Metric Definition Measured Value PI The Performance Index (PI) or Gini Index measures the ability of a model to isolate the bad accounts into the lowest scores. It compares the actual screening effectiveness to a “perfect” outcome where all the bad accounts would score lower than all good accounts and expresses this comparison as a ratio where 100 is perfect and 0 is random. The PI measures how the distribution varies across the entire score range. 81% KS The Kolmogorov-Smirnov (KS) statistic measures the separation at the greatest point between the cumulative density functions of the good and bad accounts -i. e. the maximum difference between these two functions. 69% Note: The above results are based on a representative sample pulled from the D&B file. Individual results may vary based on specific customer portfolios. 26
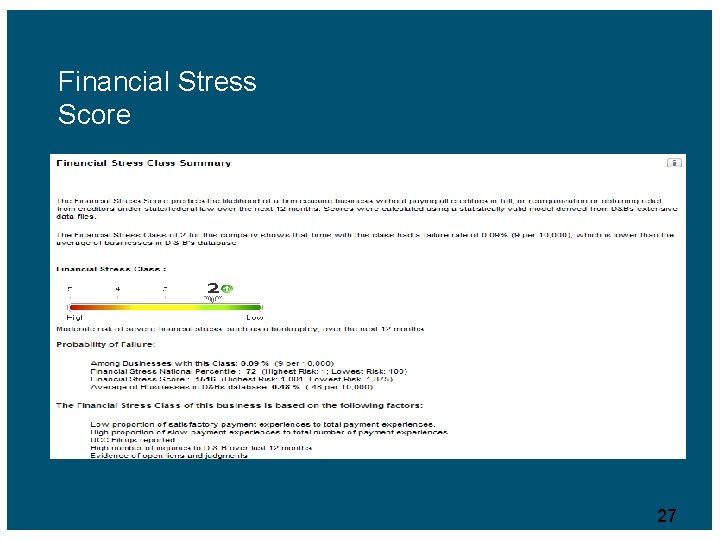
Financial Stress Score 27
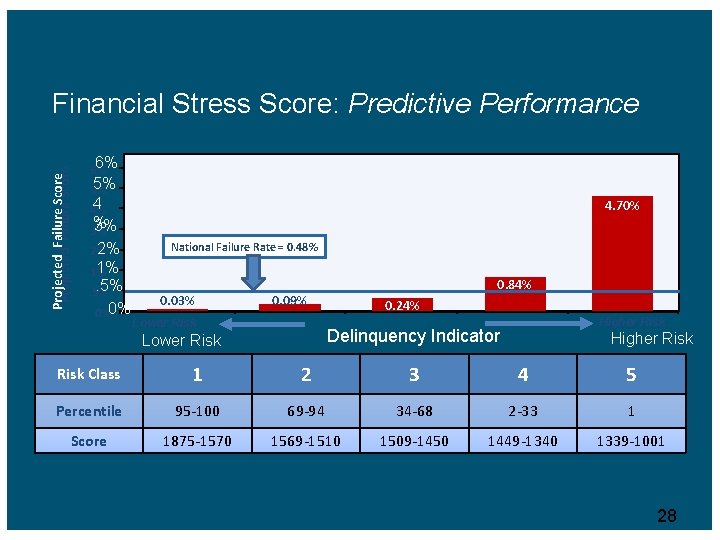
Projected. Failure. Score Financial Stress Score: Predictive Performance 6% 6% 5% 5% 4 4% 4. 70% % 3% 3% 2% 2% National Failure Rate = 0. 48% 1% 1% . 5% 0%0% 0. 03% 0. 84% 0. 09% Lower Risk 0. 24% Higher Risk Delinquency Indicator Lower Risk Higher Risk Class 1 2 3 4 5 Percentile 95 -100 69 -94 34 -68 2 -33 1 Score 1875 -1570 1569 -1510 1509 -1450 1449 -1340 1339 -1001 28
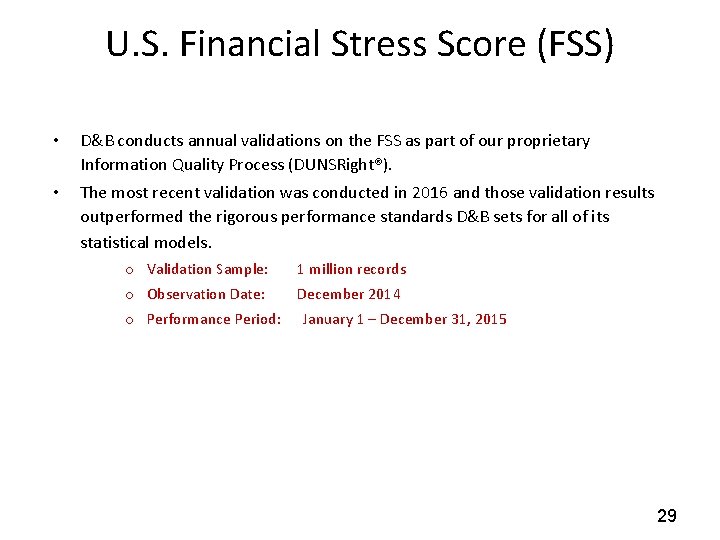
U. S. Financial Stress Score (FSS) • D&B conducts annual validations on the FSS as part of our proprietary Information Quality Process (DUNSRight®). • The most recent validation was conducted in 2016 and those validation results outperformed the rigorous performance standards D&B sets for all of its statistical models. o Validation Sample: 1 million records o Observation Date: December 2014 o Performance Period: January 1 – December 31, 2015 29
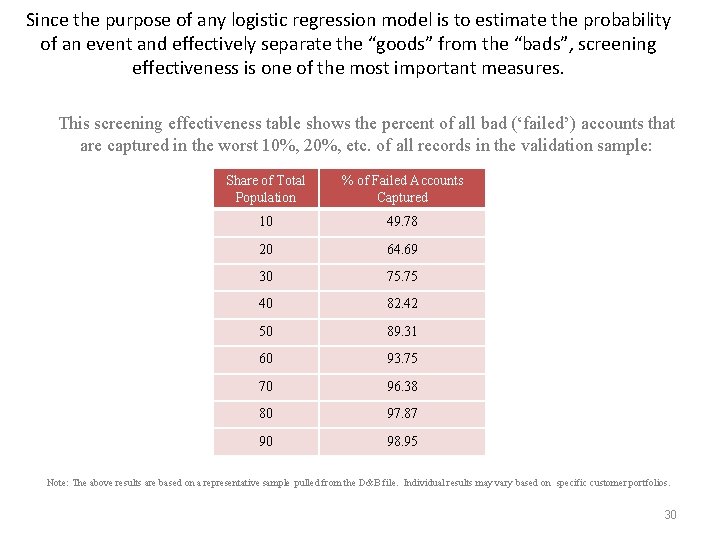
Since the purpose of any logistic regression model is to estimate the probability of an event and effectively separate the “goods” from the “bads”, screening effectiveness is one of the most important measures. This screening effectiveness table shows the percent of all bad (‘failed’) accounts that are captured in the worst 10%, 20%, etc. of all records in the validation sample: Share of Total Population % of Failed Accounts Captured 10 49. 78 20 64. 69 30 75. 75 40 82. 42 50 89. 31 60 93. 75 70 96. 38 80 97. 87 90 98. 95 Note: The above results are based on a representative sample pulled from the D&B file. Individual results may vary based on specific customer portfolios. 30
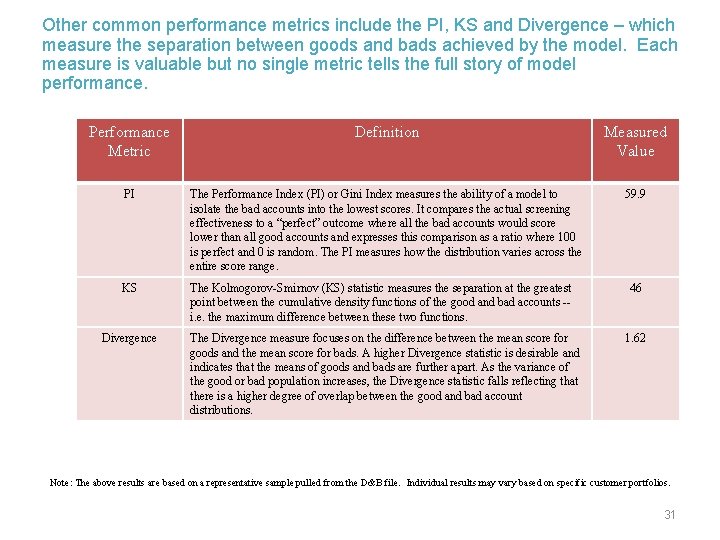
Other common performance metrics include the PI, KS and Divergence – which measure the separation between goods and bads achieved by the model. Each measure is valuable but no single metric tells the full story of model performance. Performance Metric Definition Measured Value PI The Performance Index (PI) or Gini Index measures the ability of a model to isolate the bad accounts into the lowest scores. It compares the actual screening effectiveness to a “perfect” outcome where all the bad accounts would score lower than all good accounts and expresses this comparison as a ratio where 100 is perfect and 0 is random. The PI measures how the distribution varies across the entire score range. 59. 9 KS The Kolmogorov-Smirnov (KS) statistic measures the separation at the greatest point between the cumulative density functions of the good and bad accounts -i. e. the maximum difference between these two functions. Divergence The Divergence measure focuses on the difference between the mean score for goods and the mean score for bads. A higher Divergence statistic is desirable and indicates that the means of goods and bads are further apart. As the variance of the good or bad population increases, the Divergence statistic falls reflecting that there is a higher degree of overlap between the good and bad account distributions. 46 1. 62 Note: The above results are based on a representative sample pulled from the D&B file. Individual results may vary based on specific customer portfolios. 31

Thank You – Q&A
- Slides: 32