Credit Derivatives Chapter 23 1 Credit Default Swaps


 90 bps per year Default Protection Buyer,")


 Conditional on no earlier default a reference entity has")
 Time (years) Default Probability 1 0.")
 Time (yrs) Survival Expected Discount")
 Time (yrs) Default")


 The payoff in the event of default is a")

 Example: European option to buy 5 year")
 Similar to a regular CDS except that several reference entities")

 Asset 1 Asset 2 Asset 3 Tranche 1 (equity)")
")
 Between 2000 and 2006")


 A cash CDO is an ABS where the")


 Quotes are")
 A popular approach is")


 Calculate compound correlation for each tranche Calculate")
 Tranche 0")
- Slides: 41
Credit Derivatives Chapter 23 1
Credit Default Swaps A huge market with over $40 trillion of notional principal Buyer of the instrument acquires protection from the seller against a default by a particular company or country (the reference entity) Example: Buyer pays a premium of 90 bps per year for $100 million of 5 -year protection against company X Premium is known as the credit default spread. It is paid for life of contract or until default If there is a default, the buyer has the right to sell bonds with a face value of $100 million issued by company X for $100 million (Several bonds are typically deliverable) 2
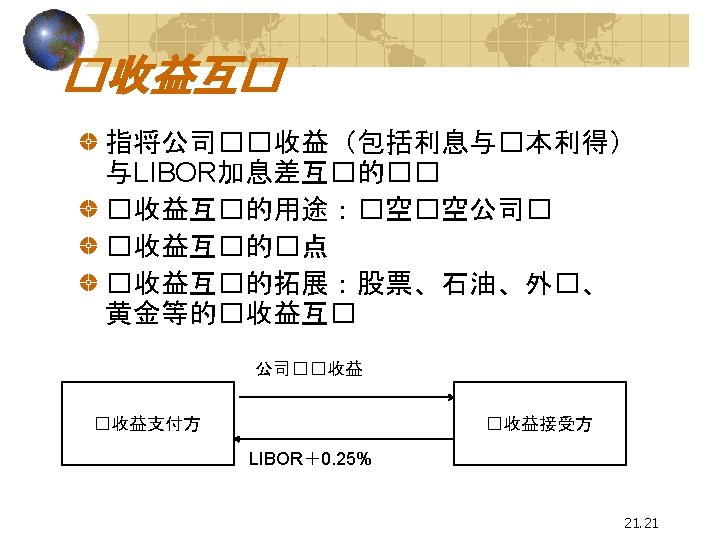
CDS Structure (Figure 23. 1, page 519) 90 bps per year Default Protection Buyer, A Payoff if there is a default by reference entity=100(1 -R) Default Protection Seller, B Recovery rate, R, is the ratio of the value of the bond issued by reference entity immediately after default to the face value of the bond 3
Other Details Payments are usually made quarterly in arrears In the event of default there is a final accrual payment by the buyer Settlement can be specified as delivery of the bonds or in cash Suppose payments are made quarterly in the example just considered. What are the cash flows if there is a default after 3 years and 1 month and recovery rate is 40%? 4
Attractions of the CDS Market Allows credit risks to be traded in the same way as market risks Can be used to transfer credit risks to a third party Can be used to diversify credit risks 5
Using a CDS to Hedge a Bond Portfolio consisting of a 5 -year par yield corporate bond that provides a yield of 6% and a long position in a 5 -year CDS costing 100 basis points per year is (approximately) a long position in a riskless instrument paying 5% per year 6
Valuation Example (page 520 -522) Conditional on no earlier default a reference entity has a (risk-neutral) probability of default of 2% in each of the next 5 years. (This is a default intensity) Assume payments are made annually in arrears, that defaults always happen half way through a year, and that the expected recovery rate is 40% Suppose that the breakeven CDS rate is s per dollar of notional principal 7
Unconditional Default and Survival Probabilities (Table 23. 1) Time (years) Default Probability 1 0. 0200 Survival Probability 0. 9800 2 0. 0196 0. 9604 3 0. 0192 0. 9412 4 0. 0188 0. 9224 5 0. 0184 0. 9039 8
Calculation of PV of Payments Table 23. 2 (Principal=$1) Time (yrs) Survival Expected Discount PV of Prob Paymt Factor Exp Pmt 1 0. 9800 s 0. 9512 0. 9322 s 2 0. 9604 s 0. 9048 0. 8690 s 3 0. 9412 s 0. 8607 0. 8101 s 4 0. 9224 s 0. 8187 0. 7552 s 5 0. 9039 s 0. 7788 0. 7040 s Total 4. 0704 s 9
Present Value of Expected Payoff (Table 23. 3; Principal = $1) Time (yrs) Default Rec. Expected Discount PV of Exp. Probab. Rate Payoff Factor Payoff 0. 5 0. 0200 0. 4 0. 0120 0. 9753 0. 0117 1. 5 0. 0196 0. 4 0. 0118 0. 9277 0. 0109 2. 5 0. 0192 0. 4 0. 0115 0. 8825 0. 0102 3. 5 0. 0188 0. 4 0. 0113 0. 8395 0. 0095 4. 5 0. 0184 0. 0111 0. 7985 0. 0088 Total 0. 0511 10
PV of Accrual Payment Made in Event of a Default. (Table 23. 4; Principal = $1) Time Default Prob Expected Accr Pmt Disc Factor PV of Pmt 0. 5 0. 0200 0. 0100 s 0. 9753 0. 0097 s 1. 5 0. 0196 0. 0098 s 0. 9277 0. 0091 s 2. 5 0. 0192 0. 0096 s 0. 8825 0. 0085 s 3. 5 0. 0188 0. 0094 s 0. 8395 0. 0079 s 4. 5 0. 0184 0. 0092 s 0. 7985 0. 0074 s Total 0. 0426 s 11
Putting it all together PV of expected payments is 4. 0704 s+0. 0426 s = 4. 1130 s The breakeven CDS spread is given by 4. 1130 s = 0. 0511 or s = 0. 0124 (124 bps) The value of a swap negotiated some time ago with a CDS spread of 150 bps would be 4. 1130× 0. 0150− 0. 0511 or 0. 0106 times the principal. 12
Implying Default Probabilities from CDS spreads Suppose that the mid market spread for a 5 year newly issued CDS is 100 bps per year We can reverse engineer our calculations to conclude that the default intensity is 1. 61% per year. If probabilities are implied from CDS spreads and then used to value another CDS the result is not sensitive to the recovery rate providing the same recovery rate is used throughout 13
14
15
Other Credit Derivatives Binary CDS First-to-default Basket CDS Total return swap Credit default option Collateralized debt obligation 16
Binary CDS (page 523 -24) The payoff in the event of default is a fixed cash amount In our example the PV of the expected payoff for a binary swap is 0. 0852 and the breakeven binary CDS spread is 207 bps 17
Credit Indices CDX NA IG is a portfolio of 125 investment grade companies in North America itraxx Europe is a portfolio of 125 European investment grade names The portfolios are updated on March 20 and Sept 20 each year The index can be thought of as the cost per name of buying protection against all 125 names The way the index is traded is more complicated (See Example 23. 1, page 526) 18
CDS Forwards and Options (page 526 -527) Example: European option to buy 5 year protection on Ford for 280 bps starting in one year. If Ford defaults during the one-year life of the option, the option is knocked out Depends on the volatility of CDS spreads 19
Basket CDS (page 527) Similar to a regular CDS except that several reference entities are specified In a first to default swap there is a payoff when the first entity defaults Second, third, and nth to default deals are defined similarly Why does pricing depends on default correlation? 20
Asset Backed Securities Security created from a portfolio of loans, bonds, credit card receivables, mortgages, auto loans, aircraft leases, music royalties, etc Usually the income from the assets is tranched A “waterfall” defines how income is first used to pay the promised return to the senior tranche, then to the next most senior tranche, and so on. 22
Possible Structure (Figure 23. 3) Asset 1 Asset 2 Asset 3 Tranche 1 (equity) Principal=$5 million Yield = 30% Tranche 2 (mezzanine) Principal=$20 million Yield = 10% Asset n Principal=$100 million SPV Tranche 3 (super senior) Principal=$75 million Yield = 6% 23
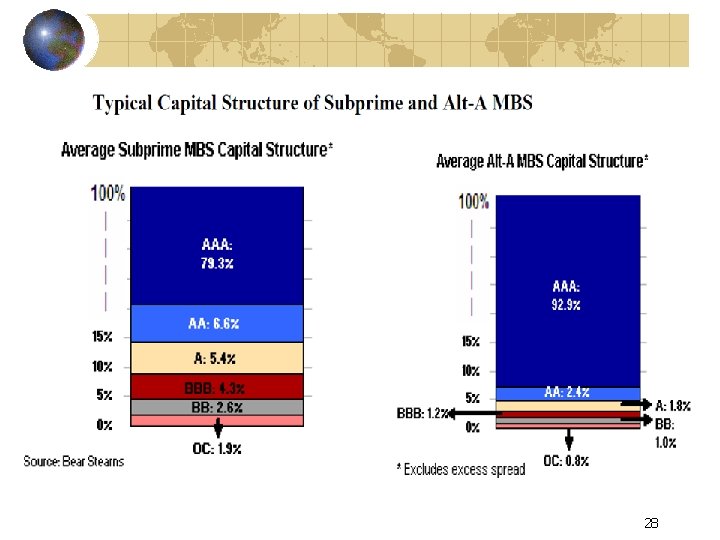
The Mezzanine Tranche is Most Difficult to Sell… Subprime Mortgage Portfolio Equity Tranche (5%) Not Rated The mezzanine tranche is repackaged with other similar mezzanine tranches Equity Tranche (5%) Mezzanine Tranche (20%) BBB Mezzanine Tranche (15%) BBB Super Senior Tranche (75%) AAA Super Senior Tranche (80%) AAA 24
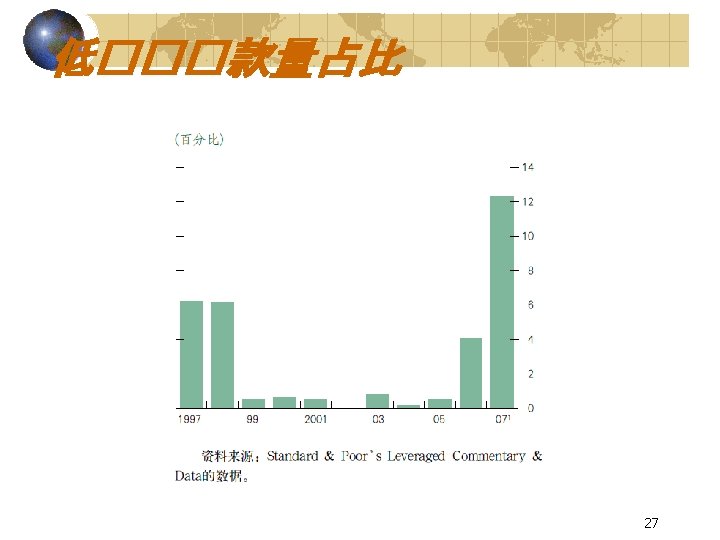
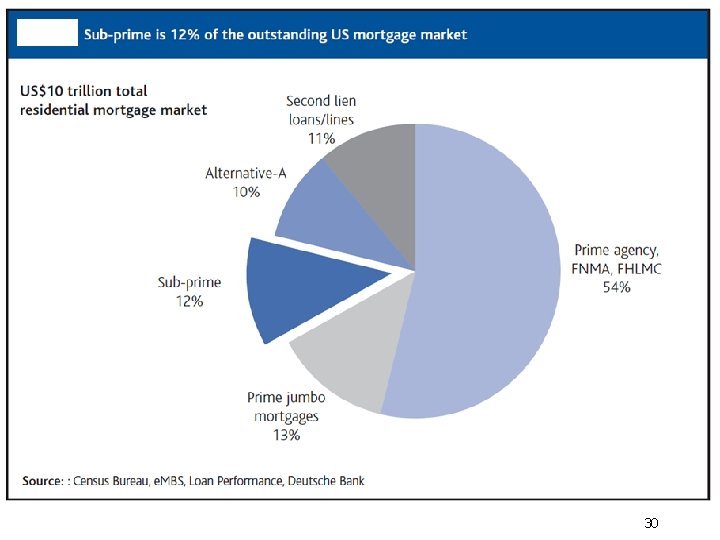
The Credit Crunch (see Business Snapshot 23. 3, page 531) Between 2000 and 2006 mortgage lenders in the U. S. relaxed standards (liar loans, NINJAs, ARMs) Interest rates were low Demand for mortgages increased fast Mortgages were securitized using ABSs and ABS CDOs In 2007 the bubble burst House prices started decreasing. Defaults and foreclosures, increased fast. 25
31
Collateralized Debt Obligations (Page 530 -32) A cash CDO is an ABS where the underlying assets are corporate debt issues A synthetic CDO involves forming a similar structure with short CDS contracts on the companies In a synthetic CDO most junior tranche bears losses first. After it has been wiped out, the second most junior tranche bears losses, and so on 32
Synthetic CDO Structure Tranche 1: 5% of principal Responsible for losses between 0% and 5% Earns 1500 bps CDS 1 CDS 2 CDS 3 CDS n Average Yield 8. 5% Trust Tranche 2: 10% of principal Responsible for losses between 5% and 15% Earns 200 bps Tranche 3: 10% of principal Responsible for losses between 15% and 25% Earns 40 bps Tranche 4: 75% of principal Responsible for losses between 25% and 75% Earns 10 bps 33
Synthetic CDO Details The bps of income is paid on the remaining tranche principal. Example: when losses have reached 7% of the principal underlying the CDSs, tranche 1 has been wiped out, tranche 2 earns the promised spread (200 basis points) on 80% of its principal 34
Single Tranche Trading This involves trading tranches of portfolios that are unfunded Cash flows are calculated as though the tranche were funded 35
Quotes for Standard Tranches of CDX and i. Traxx (Table 23. 6) Quotes are 30/360 in basis points per year except for the 03% tranche where the quote equals the percent of the tranche principal that must be paid upfront in addition to 500 bps per year. CDX NA IG (Mar 28, 2007): Tranche 0 -3% 3 -7% 7 -10% 10 -15% 15 -30% 30 -100% Quote 26. 85% 103. 8 20. 3 10. 3 4. 3 2 i. Traxx Europe (Mar 28, 2007) Tranche 0 -3% 3 -6% 6 -9% 9 -12% 12 -22% 22 -100% Quote 11. 25% 57. 7 14. 4 6. 4 2. 6 1. 2 36
Valuation of Synthetic CDOs and basket CDSs (page 534 -539) A popular approach is to use a factor-based Gaussian copula model to define correlations between times to default Often all pairwise correlations and all the unconditional default distributions are assumed to be the same Market likes to imply a pairwise correlations from market quotes. 37
Valuation of Synthetic CDOs and Basket CDOs continued (See equations 23. 5 to 23. 15, and examples 23. 2 and 23. 3) The probability of k defaults from n names by time t conditional on F is This enables cash flows conditional on F to be calculated. By integrating over F the unconditional distributions are obtained 38
Implied Correlations A compound correlation is the correlation that is implied from the price of an individual tranche using the one-factor Gaussian copula model A base correlation is correlation that prices the 0 to X% tranche consistently with the market where X% is a detachment point (the end point of a standard tranche) 39
Procedure for Calculating Base Correlation (page 539) Calculate compound correlation for each tranche Calculate PV of expected loss for each tranche Sum these to get PV of expected loss for base correlation tranches Calculate correlation parameter in one-factor gaussian copula model that is consistent with this expected loss 40
Implied Correlations for i. Traxx on March 28, 2007 (Table 23. 8) Tranche 0 -3% 3 -6% 6 -9% 9 -12% 12 -22% Compound Correlation 18. 3% 9. 3% 14. 3% 18. 2% 24. 1% Tranche 0 -3% 0 -6% 0 -9% 0 -12% 0 -22% Base Correlation 18. 3% 27. 3% 34. 9% 41. 4% 58. 1% 41