
Creative Thinker Effective Participator Independent Enquirer Reflective Learner




- Slides: 19
Creative Thinker Effective Participator Independent Enquirer Reflective Learner PLT Skills LESSON OBJECTIVES Self Manager Team Worker Which ones are you using? Always aim high! We are learning to: - Enhance Mathematical basic skills knowledge. (Which PLT skills? ) - Accurately draw cumulative frequency curves and box and whisker plots. (Grade B) Where are we in our journey? AUTHOR www. mistrymaths. co. uk Real life cross/curricular links?
Creative Thinker Effective Participator Independent Enquirer PLT Skills. LEARNING Reflective Learner JOURNEY Self Manager Team Worker Which ones are you using?
Creative Thinker Effective Participator PLT Skills Independent Enquirer Reflective Learner Self Manager Team Worker Which ones are you using? STARTER TASK th 1) Find the n term of: 3, 8, 13, 18, . . = 5 n - 2 4) = 3) 8 40 = = 1 5 = 5 6 + 30 30 35 100 = 11 30 as a %: = 35% = 7 12 21 21 8) Work = out: -6 – 9 + 6 = -9 EXTENSION Write 2 5 x 8 3 6) Find 5) 7) Write = 2) as a percentage. 14 70 = 20 = 100 = 70% 5 21 = 10 24 = of 1 min 5 = 12 of 60 seconds = 25 seconds 9) Work out: 2 3 x 32 ÷ 4 = 3 x 32 ÷ 16 =3 x 2 =6 5 12
Creative Thinker Effective Participator Independent Enquirer Reflective Learner PLT Skills. CUMULATIVE FREQUENCY EXAMPLE 1 Self Manager Team Worker Which ones are you using? A golf club has 200 members. Their ages are shown in the frequency table below. Draw a cumulative frequency curve to represent this information. Age (a years) Cumulative frequency Age (a years) Frequency 0 ≤ a < 10 88 8 10 ≤ a < 20 +26 26 34 20 ≤ a < 30 +32 32 66 30 ≤ a < 40 +45 45 111 40 ≤ a < 50 +37 37 148 50 ≤ a < 60 +29 29 177 60 ≤ a < 70 +16 16 193 70 ≤ a < 80 7+7 200
Creative Thinker Effective Participator Independent Enquirer Reflective Learner PLT Skills. CUMULATIVE FREQUENCY EXAMPLE 1 Self Manager Team Worker Which ones are you using? A golf club has 200 members. Their ages are shown in the frequency table below. Draw a cumulative frequency curve to represent this information. Age (a years) Cumulative frequency a < 10 8 a < 20 34 a < 30 66 a < 40 111 a < 50 148 a < 60 177 a < 70 193 a < 80 200
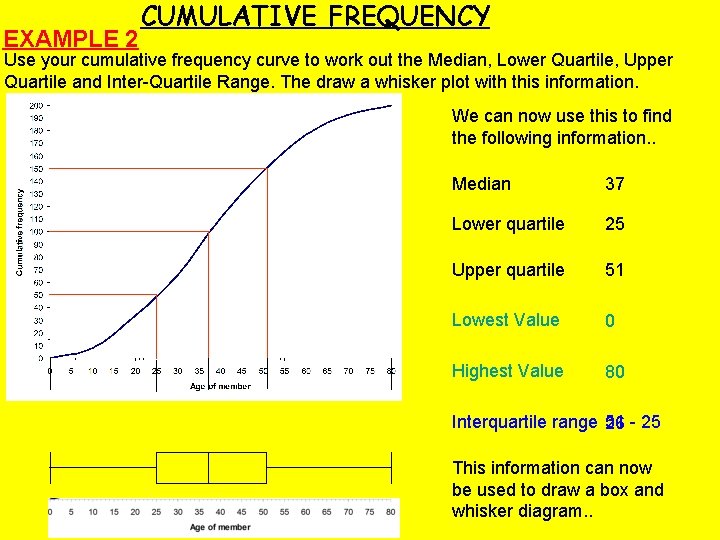
EXAMPLE 2 CUMULATIVE FREQUENCY Use your cumulative frequency curve to work out the Median, Lower Quartile, Upper Quartile and Inter-Quartile Range. The draw a whisker plot with this information. We can now use this to find the following information. . Median 37 Lower quartile 25 Upper quartile 51 Lowest Value 0 Highest Value 80 Interquartile range 26 51 - 25 This information can now be used to draw a box and whisker diagram. .
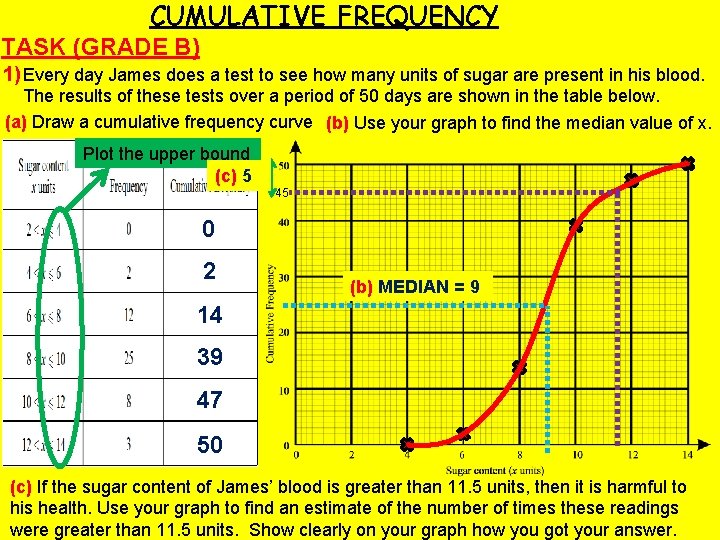
CUMULATIVE FREQUENCY TASK (GRADE B) 1) Every day James does a test to see how many units of sugar are present in his blood. The results of these tests over a period of 50 days are shown in the table below. (a) Draw a cumulative frequency curve (b) Use your graph to find the median value of x. Plot the upper bound (c) 5 45 0 2 (b) MEDIAN = 9 14 39 47 50 (c) If the sugar content of James’ blood is greater than 11. 5 units, then it is harmful to his health. Use your graph to find an estimate of the number of times these readings were greater than 11. 5 units. Show clearly on your graph how you got your answer.
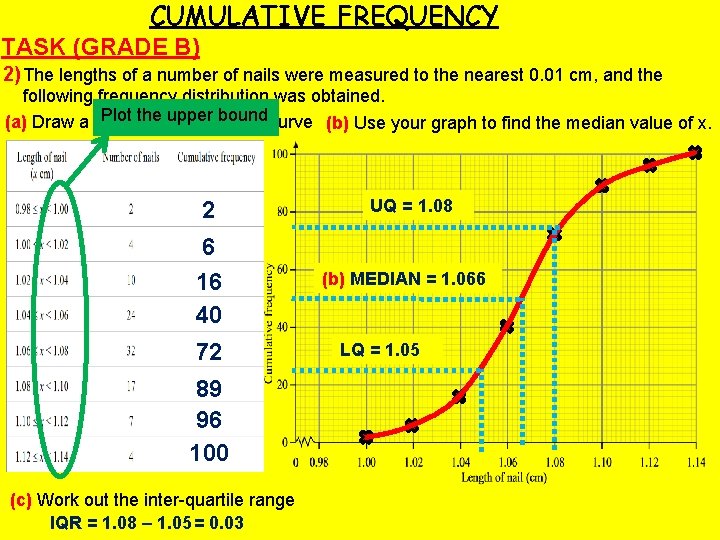
CUMULATIVE FREQUENCY TASK (GRADE B) 2) The lengths of a number of nails were measured to the nearest 0. 01 cm, and the following frequency distribution was obtained. Plot the upper bound curve (b) Use your graph to find the median value of x. (a) Draw a cumulative frequency 2 6 16 40 72 89 96 100 (c) Work out the inter-quartile range IQR = 1. 08 – 1. 05 = 0. 03 UQ = 1. 08 (b) MEDIAN = 1. 066 LQ = 1. 05
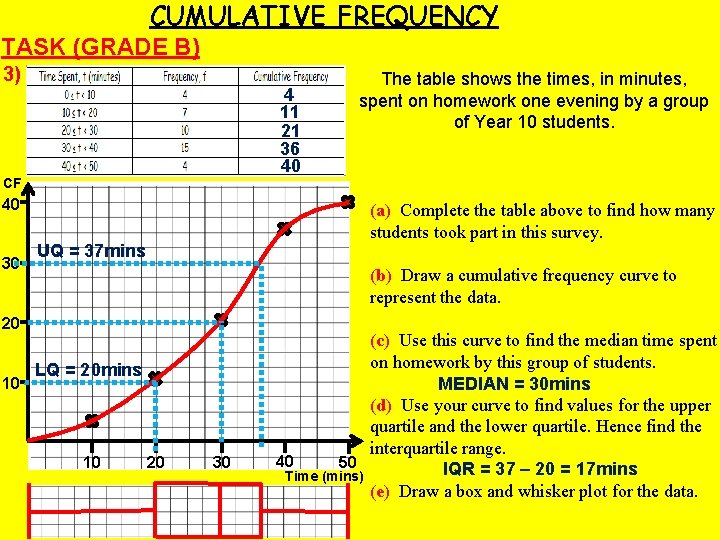
CUMULATIVE FREQUENCY TASK (GRADE B) 3) 4 11 21 36 40 CF 40 30 UQ = 37 mins 20 10 The table shows the times, in minutes, spent on homework one evening by a group of Year 10 students. LQ = 20 mins 10 20 30 (a) Complete the table above to find how many students took part in this survey. (b) Draw a cumulative frequency curve to represent the data. (c) Use this curve to find the median time spent on homework by this group of students. MEDIAN = 30 mins (d) Use your curve to find values for the upper quartile and the lower quartile. Hence find the interquartile range. 40 50 IQR = 37 – 20 = 17 mins Time (mins) (e) Draw a box and whisker plot for the data.
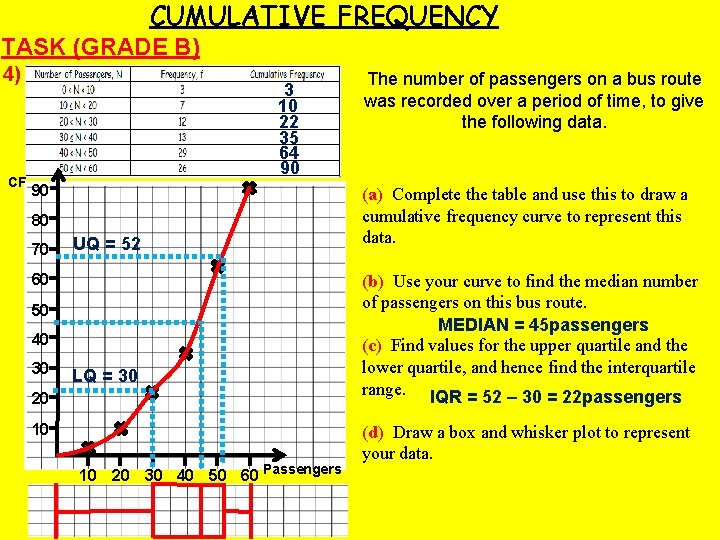
CUMULATIVE FREQUENCY TASK (GRADE B) 4) CF 3 10 22 35 64 90 90 80 70 UQ = 52 60 50 40 30 LQ = 30 20 10 10 20 30 40 50 60 Passengers The number of passengers on a bus route was recorded over a period of time, to give the following data. (a) Complete the table and use this to draw a cumulative frequency curve to represent this data. (b) Use your curve to find the median number of passengers on this bus route. MEDIAN = 45 passengers (c) Find values for the upper quartile and the lower quartile, and hence find the interquartile range. IQR = 52 – 30 = 22 passengers (d) Draw a box and whisker plot to represent your data.
Creative Thinker Effective Participator Independent Enquirer Reflective Learner Self Manager Team Worker Which ones are you PLT Skills. CUMULATIVE FREQUENCY using? EXTENSION (GRADE B) 1) Draw cumulative frequency curves and box and whiskers plots for each question below: (a) 8 20 35 55 73 85 95 100 2 5 20 38 63 80 92 100 (b) (c) 1 4 10 22 25 28 30
Creative Thinker PLT Skills Effective Participator Independent Enquirer DISCOVERY Reflective Learner Self Manager Team Worker Which ones are you using? LINK BACK TO OBJECTIVES - Accurately draw cumulative frequency curves and box and whisker plots. What grade are we working at?
Creative Thinker Effective Participator Independent Enquirer Reflective Learner Self Manager Team Worker Which ones are you PLT Skills. CUMULATIVE FREQUENCY using? PLENARY ACTIVITY – GRADE B EXAMINATION QUESTION The cumulative frequency diagram of the heights of 80 red kangaroos is shown below. Red Kangaroos The table below summarises the heights of 80 grey kangaroos. Grey Kangaroos UQ = 160 Lower Quartile Median Upper Quartile 85 cm 105 cm 120 cm Explain why the heights of the grey kangaroos are more consistent than the heights of the red kangaroos. You must show your working. LQ = 112 The smaller the IQR the more consistent IQR Grey = 120 – 85 = 35 kangaroos IQR Red = 160 – 112= 48 kangaroos As the IQR for grey kangaroos is 13 less, their heights are more consistent. (4 marks)
What have you learnt? Draw your brain In your brain, write or draw everything you can remember about cumulative frequency curves and box and whisker plots. It can be a skill or a reflection, or something else that might be prominent in your brain. Where are we in our journey? What grade are we working at?
Positive Thinker Creative Entrepreneur Independent Learner Reflective Learner Responsible Citizen Team Worker Which ones are you Enterprise Skills. SELF ASSESSMENT Plenary using? Activity How well do you understand the task? . I don’t understand I nearly understand www. mistrymaths. co. uk I fully understand
Positive Thinker Creative Entrepreneur Independent Learner Reflective Learner Enterprise Skills. SELF ASSESSMENT Plenary Activity WWW (What Went Well) EBI (Even Better If) On your post it notes… Think about how you can improve your work. www. mistrymaths. co. uk Responsible Citizen Team Worker Which ones are you using?
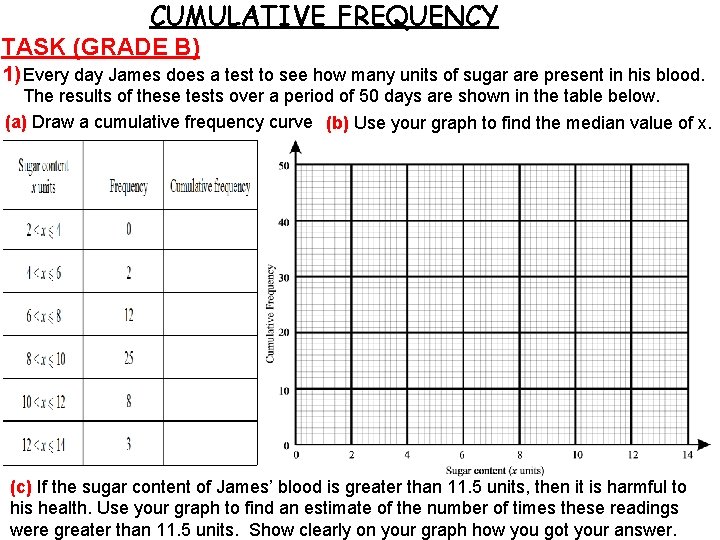
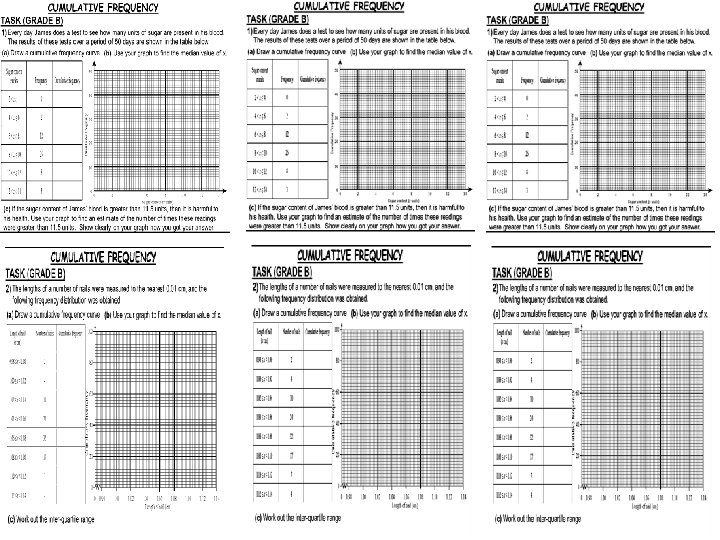
CUMULATIVE FREQUENCY TASK (GRADE B) 1) Every day James does a test to see how many units of sugar are present in his blood. The results of these tests over a period of 50 days are shown in the table below. (a) Draw a cumulative frequency curve (b) Use your graph to find the median value of x. (c) If the sugar content of James’ blood is greater than 11. 5 units, then it is harmful to his health. Use your graph to find an estimate of the number of times these readings were greater than 11. 5 units. Show clearly on your graph how you got your answer.
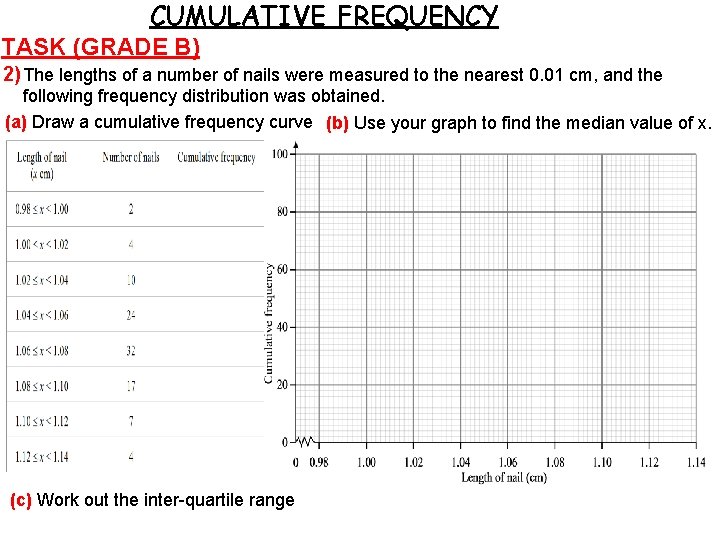
CUMULATIVE FREQUENCY TASK (GRADE B) 2) The lengths of a number of nails were measured to the nearest 0. 01 cm, and the following frequency distribution was obtained. (a) Draw a cumulative frequency curve (b) Use your graph to find the median value of x. (c) Work out the inter-quartile range