CREATING HIGH RESOLUTION SHADED SURFACE RELIEF MAPS USING


 to mosaic")


- Slides: 91
CREATING HIGH RESOLUTION SHADED SURFACE RELIEF MAPS USING ARCVIEW
DEM Mapping Acquiring DEM data
Directory Structure • Before downloading SDTS DEMs into Arc. View, a good thing to do is first build a directory structure. • A good format might be 75_minute_demMichigan (State_name) • Subdirectories will be created beneath state_name 75_minute_demMichiganevans_creek
On the Internet • Log into the USGS EROS DATA CENTER site at http: //edcwww. cr. usgs. gov/doc/edchome/nd cdb/ndcdb. html • This is the place to start acquiring high resolution DEM data for mapping applications
Click on Product Information
Click on Geo. Data
Click on 1: 24, 000 DEM
Click ftp via graphics
US map appears, select area of interest
Zoomed to area of interest, select area of interest again
7. 5’ minute USGS quadrangles appear, select quadrangle of interest
Click on quadrangle name
Click on file with. tar. gz extension
Click save file
Select directory in which to download file and change this filename to the example on next slide
Downloading files • When down loading a file it is best to rename it before actually downloading. The example file from the previous slide is 30. 1. 1. 1231106. tar. gz • We can actually rename this file evans_creek_MI. tar. gz • When you rename it be sure it has the. tar. gz extension on the end
NOTE: new name still has. tar. gz extension, but is more comprehensive than the original name
Tarred & Zipped • • The downloaded files are tarred and zipped Tar puts all the files together into one file Zip compresses the tarred file On the PC use a utility such as Winzip will unzipp and untar at the same time.
Arc. View • Once you have the files you want you can begin importing them into Arc. View. • One thing to be aware of is that the DEM files can be in meters or feet and they can be in 30 x 30 (most common) meter grids or 10 x 10 meter grids. • Differences in vertical units will cause some extra processing steps
Add grid directory to directory structure Using Windows explorer add a directory to put your Arc. View grid files in. I usually just call mine grid. 75_minute_demMichigangrid
USGS DEMs in Arc. View • Importing DEMs into Arcview. • Combining multiple DEMs in Arc. View (mosaic). • Generating shaded relief maps in Arcview. • Overlaying cultural data.
Open Arc. View
Double-Click views to open a new view
Click on import data source
Click on down arrow then select USGS SDTS DEM
Click OK
Select directory with SDTS DEMs then double click. ddf file
Select directory to store Arc. View grid theme and name Arc. View grid then click OK
Click yes
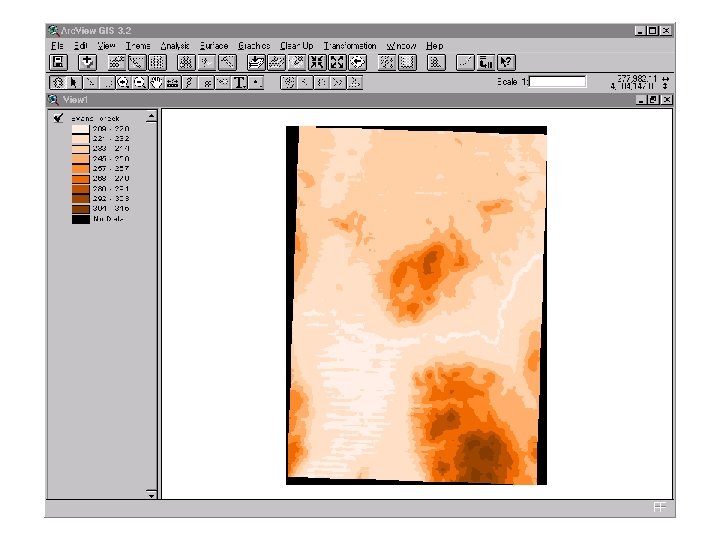
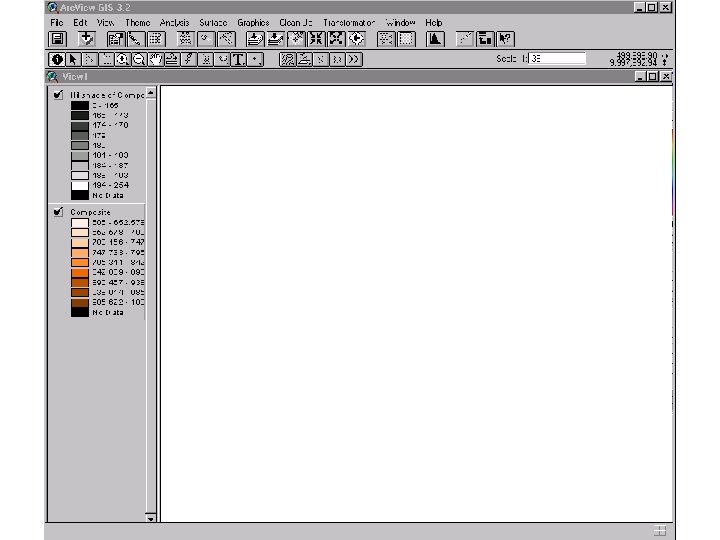
To display the DEM data you must click on the box beside theme name as shown in the next slide
Adding adjacent quadrangles • We have downloaded 4 adjacent quadrangles in the same fashion as the first • The next slide shows the 4 quadrangles displayed on the screen separately • We will eventually mosaic these tiles together to form one quadrangle map • Note on the following slide differences in the scale of the vertical units (meters & feet)
FEET Note differences in vertical scales METERS
Converting meters to feet • First we combine the quadrangles with meter units • We perform a calculator function to convert the grid data from meters to feet • Finally we combine all the grids with vertical units in feet
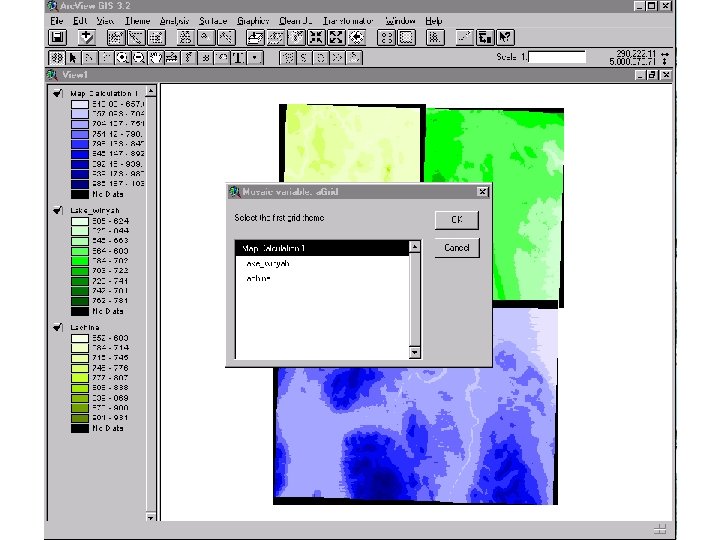
Select first grid theme to mosaic
Big_ravine selected
Select the other grid theme(s) to mosaic
New theme appears. Remember we have to check the box to the left of the name to get it to appear
Notice now that the bottom panel covers the previous two
Map Calculator • Now that we have the meter quadrangles spliced together we can perform a mathematical operation to convert from meters to feet
Click on Map Calculator
Double-click Mosaiced Grids of
Then click on the multiplication symbol and then 3. 28
Click on evaluate, then x in the upper right corner to get rid of Map Calculator box
Deleting unnecessary themes • Once we’ve checked to make sure our new theme is correct by adding it to the view, we can eliminate the precursory themes. • We do this by highlighting themes we want to delete. • To highlight one theme, click on it. To highlight multiple themes shift-click on them
Once we know our mosaic was successful we can now delete the precursory files by highlighting them and clicking Delete Temes in the Edit menu
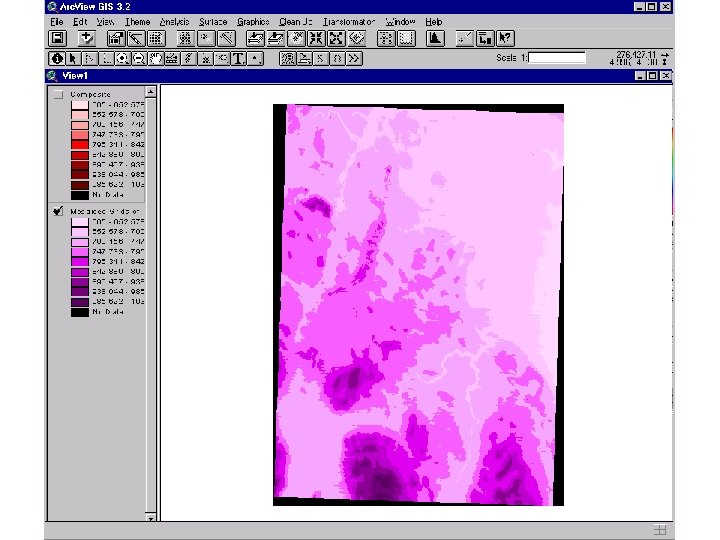
Combining the entire region • Now we have the entire region we started with in the same vertical units • We can now mosaic the files in feet together to get one continuous map. • This process is the same that we used before. • Transformation: Mosaic and then select the relevant files
NOTE: Here we have two other themes selected
Again, for the new combined theme to show up we must click the box left of its name
Now we have one continuous map from the original four maps
House Cleaning • Now we are in a position to create hill shaded relief maps. • First however we may want to do some house cleaning. • Our mosaic files are kept in a temporary file, arbitrarily named and are apt to get accidentally deleted. • We can move this file to a more permanent position using manage data sources
Where does my mosaiced file reside? • If you have set a working directory (File: Set Working Directory) it will save the file as grid 1 or grid 2 etc. in that directory. • If you delete this theme in a view, it will delete from the hard disk. • Highlight the mosaiced theme, then go to Theme: Properties and it will show you the files location. See next slide.
Highlighted grid file location
Click on Manage Data Sources
Select directory where temporary grid file resides This is found by highlighting theme and then going into Theme: Properties Click on down arrow then Select grid as source type
Click on Copy after selecting the file grid 2 Note: generic file name from Theme: Properties
Select location for renamed grid file New grid file name
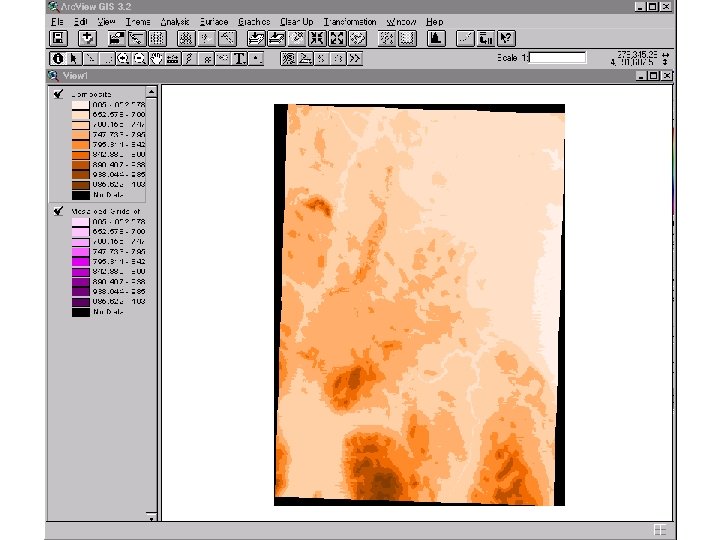
Now you must add theme to the view
Select the directory where the composite file was saved Select the composite file Select grid as data source type
We will now add our copied theme to our view. Click on Add Theme
Select the composite file we copied to previously Select grid data source Select the composite file directory
After deleting temporary file
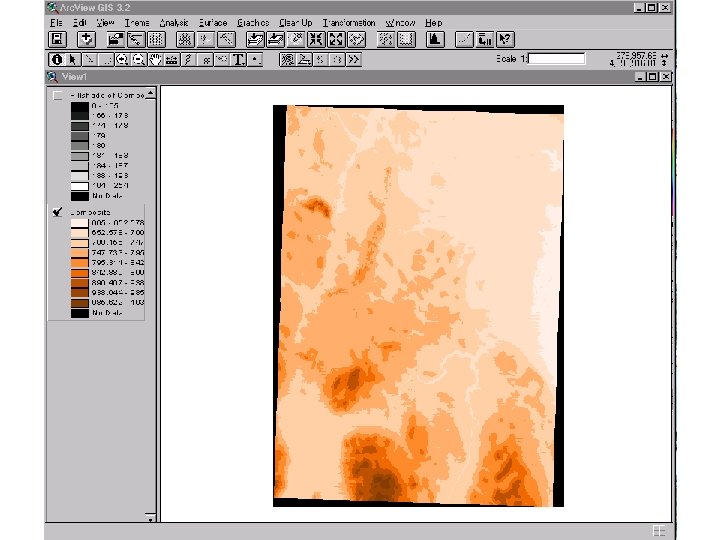
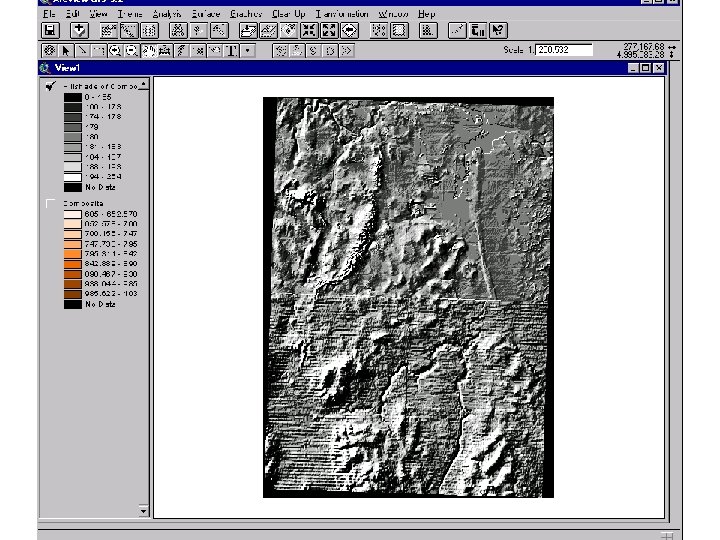
Hillshade Relief Map • Two components are required for a hillshaded relief map • One is Azimuth, which is the sun’s compass position relative to the map • Altitude is the sun’s position relative to the horizon.
Select Compute Hillshade
Click OK to compute hillshade Default Azimuth and Altitude are a good place to start.
NOTE: lines in bottom half of map are due to poor acquisition of the DEM data
Setting Projection Info • If not adding overlays in the same relative coordinates, we must tell Arc. View what projection the grid file is in, and then the only data it knows how to overlay (without using a conversion utility) is in latitude and longitude coordinates. • The next slide shows the DEM projection zones in Michigan. • Our data is in UTM Zone 17
Our data is from here
Click on Properties
Select Projection
Click the down arrow beside category
Select UTM NAD 1927, this is the projection the is in.
Select Zone 17 There are 60 UTM Zones 6 degrees of longitude each
Click on Full Extent and you can again view your map
To add cultural overlays click Add Theme and then add cultural data themes which are in latitude and longitude.
Select the directory where the shape files exist. A separate Power Point presentation shows where to get these files Be sure when trying to add shape files you have Feature Data Source selected You can select multiple shape files at one time by holding down the shift key and clicking each file you want with the left mouse button
Selected themes show up in the column to the left Again we have to click on the boxes to the left to get them to display Themes are overlayed in the order they appear. To change the order, simply drop and drag.
To change the properties of theme double click on theme and an edit box will appear.
Double click on Symbol and another edit window appears. Here we are changing color of the Wbd 26007 polygon fill (Water Boundaries for Alpena County, MI) Select new color from Color Palette Click Apply
NOTE: The color change in the lakes. To close the edit boxes just click on the Xs in the corners
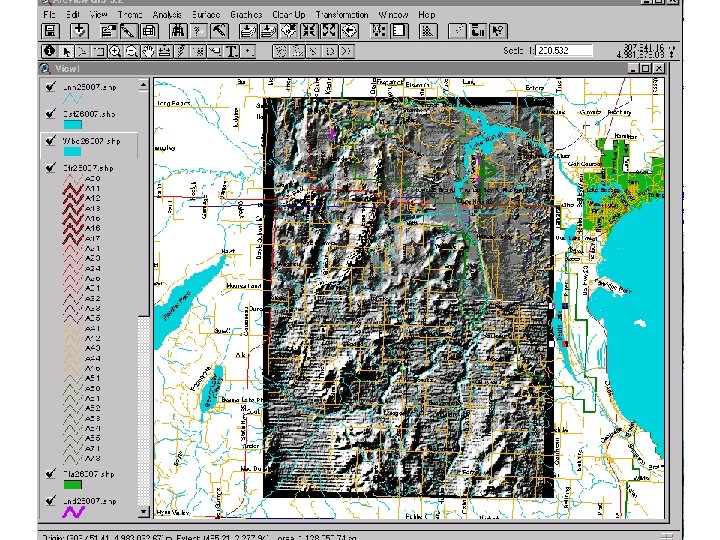
Our map with edited cultural overlays.
We can also label feautes. Click on theme to label, then Auto-label
Select what you want labeled and how you want them labeled then click OK
Font too big or too small • If the fonts are not what you want you can change them. • Go to Theme: Remove Labels • Go to Window: Show Symbol Window • This will pop up the edit window where you can select the font palette. • Change your font and do Theme: Auto-label until the desired results