CREATING AND GRAPHING IN 2 VARIABLES Standard MGSE

CREATING AND GRAPHING IN 2 VARIABLES Standard: MGSE 9 -12. A. CED. 2 Create linear, quadratic, and exponential equations in two or more variables to represent relationships between quantities; graph equations on coordinate axes with labels and scales. Essential Question: How can graphing equations help you make decisions?

Warm Up A cell phone company charges a $20 flat fee plus $0. 05 for every minute used for calls. 1. Make a table of values from 0 to 60 minutes in 10 -minute intervals that represent the total amount charged. 2. Write an algebraic equation that could be used to represent the situation. 3. What do the unknown values in your equation represent?

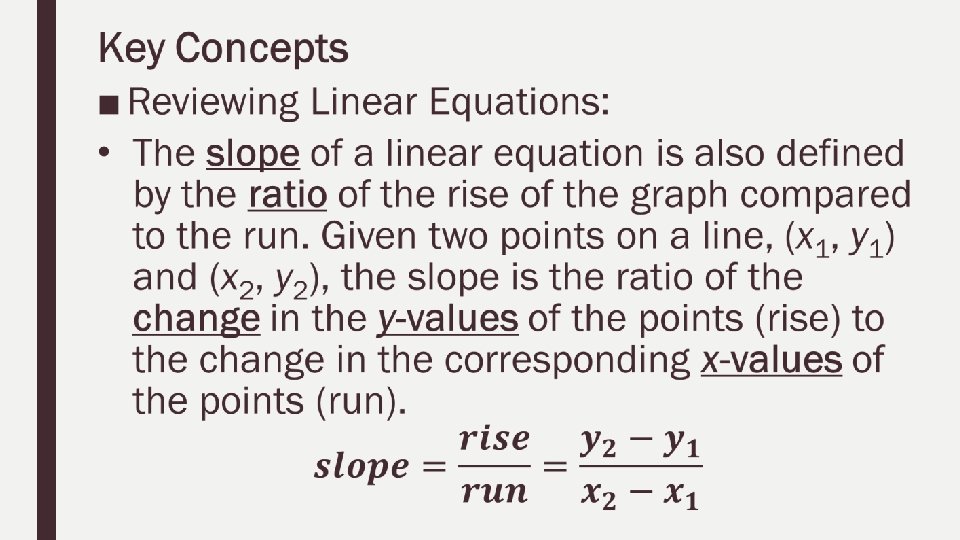
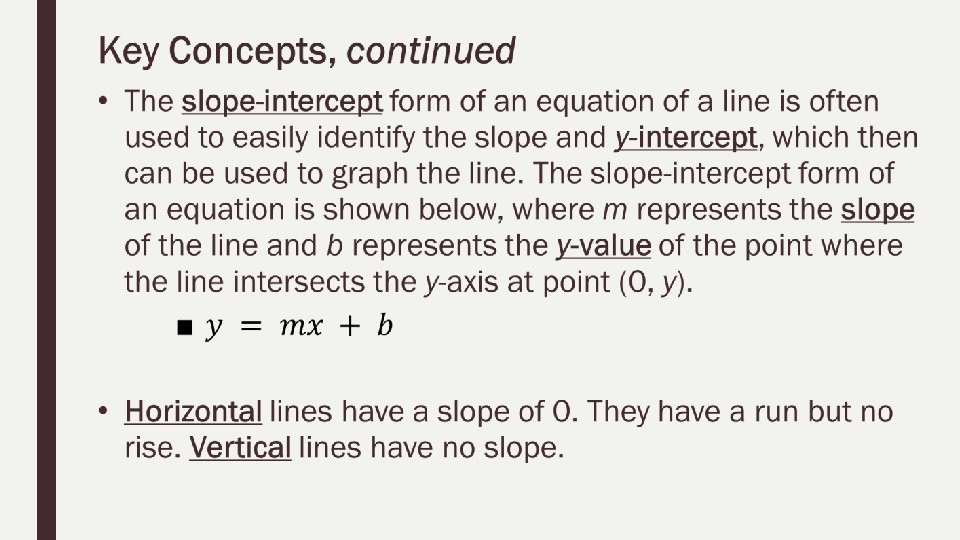
Introduction Many relationships can be represented by linear equations. Linear equations in two variables can be written in the form y = mx + b, where m is the slope and b is the yintercept. The slope of a linear graph is a measure of the rate of change of one variable with respect to another variable. The yintercept of the equation is the point at which the graph crosses the y-axis and the value of x is zero.

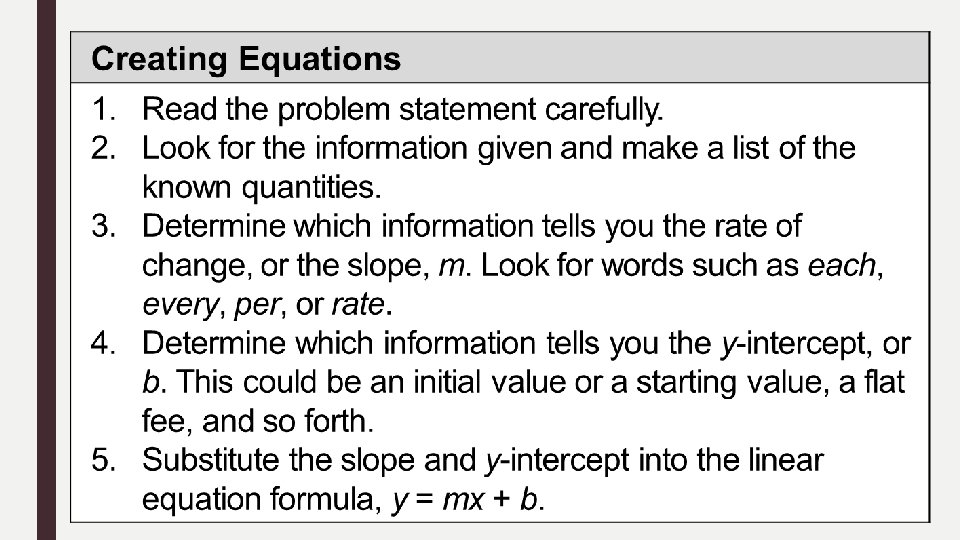
Introduction, continued Creating a linear equation in two variables from context follows the same procedure at first for creating an equation in one variable. Start by reading the problem carefully. Once you have created the equation, the equation can be graphed on the coordinate plane. The coordinate plane is a set of two number lines, called the axes, that intersect at right angles.

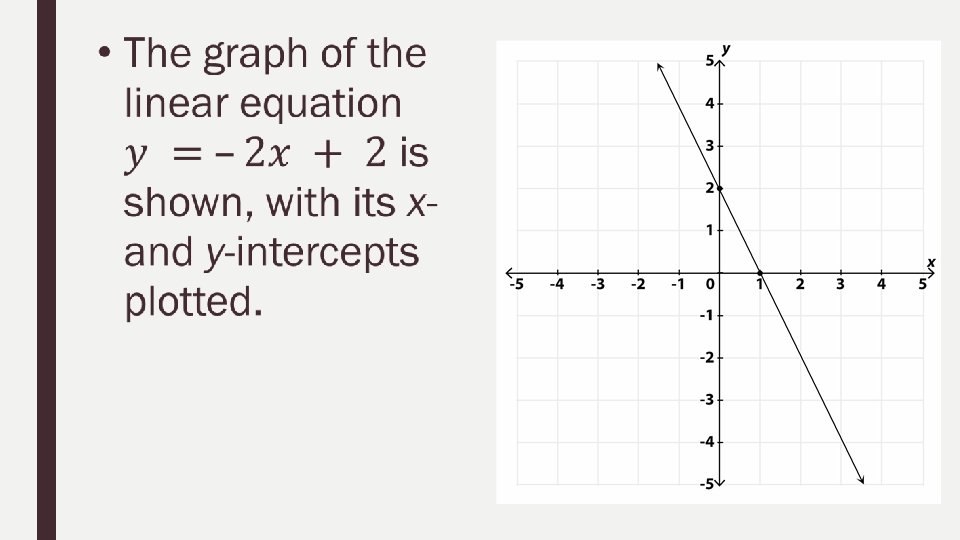
■ Key Concepts, continued • The x-intercept of a line is the point where the line intersects the x-axis at (x, 0). • If a point lies on a line, its coordinates make the equation true. • The graph of a line is the collection of all points that satisfy the equation.

■ Key Concepts, continued ■ Determining the Scale and Labels When Graphing: • If the slope has a rise and run between – 10 and the y-intercept is 10 or less, use a grid that has squares equal to 1 unit. • Adjust the units according to what you need. For example, if the y-intercept is 10, 000, each square might represent 2, 000 units on the y-axis. Be careful when plotting the slope to take into account the value each grid square represents.

■ Key Concepts, continued • Sometimes you need to skip values on the y-axis. It makes sense to do this if the y-intercept is very large (positive) or very small (negative). For example, if your y-intercept is 10, 000, you could start your y-axis numbering at 0 and “skip” to 10, 000 at the next y-axis number. Use a short, zigzag line starting at 0 to about the first grid line to show that you’ve skipped values. Then continue with the correct numbering for the rest of the axis.

■ Key Concepts, continued • Only use x- and y-values that make sense for the context of the problem. Ask yourself if negative values make sense for the x-axis and y-axis labels in terms of the context. If negative values don’t make sense (for example, time and distance can’t have negative values), only use positive values.

Key Concepts, continued • Determine the independent and dependent variables. • The independent variable will be labeled on the x-axis. The independent variable is the quantity that changes based on values you choose. • The dependent variable will be labeled on the y-axis. The dependent variable is the quantity that is based on the input values of the independent variable.

Graphing Equations Using the Slope and y-intercept

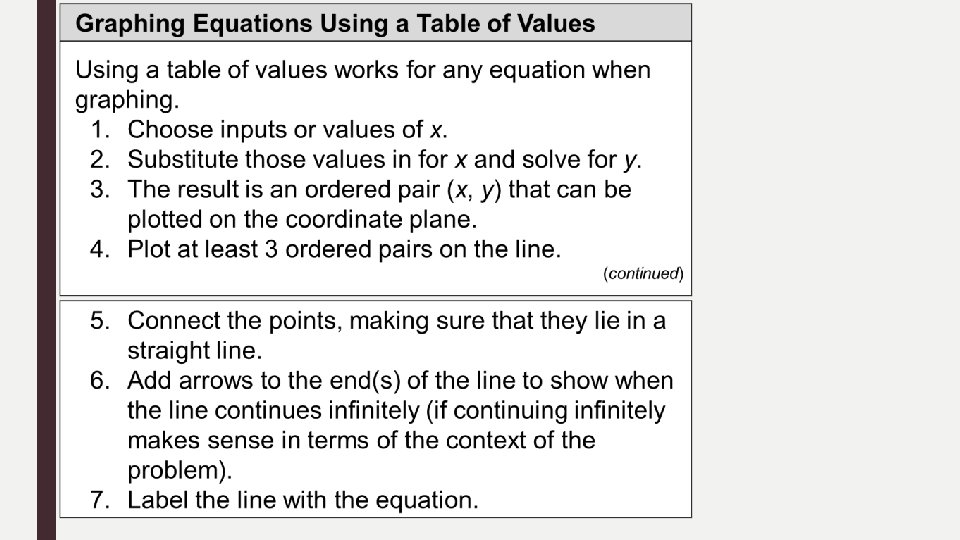
6. Connect the points and place arrows at one or both ends of the line when it makes sense to have arrows within the context of the problem. 7. Label the line with the equation.

Guided Practice Example 1 A local convenience store owner spent $10 on pencils to resell at the store. What is the equation of the store’s revenue if each pencil sells for $0. 50? Graph the equation.

Guided Practice Example 2 A taxi company in Atlanta charges $2. 50 per ride plus $2 for every mile driven. Write and graph the equation that models this scenario.

Guided Practice Example 3 Miranda gets paid $300 a week to deliver groceries. She also earns 5% commission on any orders she collects while out on her delivery run. Write an equation that represents her weekly pay and then graph the equation.
 of a ball thrown directly upward")
Guided Practice Example 4 The velocity (or speed) of a ball thrown directly upward can be modeled with the following equation: v = –gt + v 0 Here, v is the speed, g is the force of gravity, t is the elapsed time, and v 0 is the initial velocity at time 0. If the force of gravity is equal to 32 feet per second, and the initial velocity of the ball is 96 feet per second, what is the equation that represents the velocity of the ball? Graph the equation.

Guided Practice Example 5 A Boeing 747 starts out a long flight with about 57, 260 gallons of fuel in its tank. The airplane uses an average of 5 gallons of fuel per mile. Write an equation that models the amount of fuel in the tank and then graph the equation.

Problem Based Task: Phone Card Fine Print Write and graph the equation that models the following scenario. You can buy a 6 -hour phone card for $5, but the fine print says that each minute you talk actually costs you 1. 5 minutes of time. What is the equation that models the number of minutes left on the card compared with the number of minutes you actually talked? What is the graph of this equation?
- Slides: 22