
Created by Edraw Infographics Benefits of Smartphone Entertainment
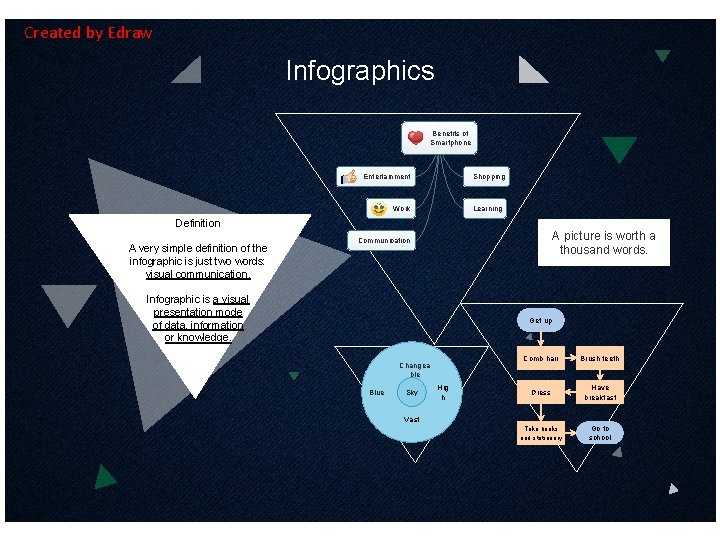
Created by Edraw Infographics Benefits of Smartphone Entertainment Shopping Work Learning Definition A very simple definition of the infographic is just two words: visual communication. A picture is worth a thousand words. Communication Infographic is a visual presentation mode of data, information or knowledge. Get up Changea ble Blue Sky Hig h Comb hair Brush teeth Dress Have breakfast Take books and stationery Go to school Vast
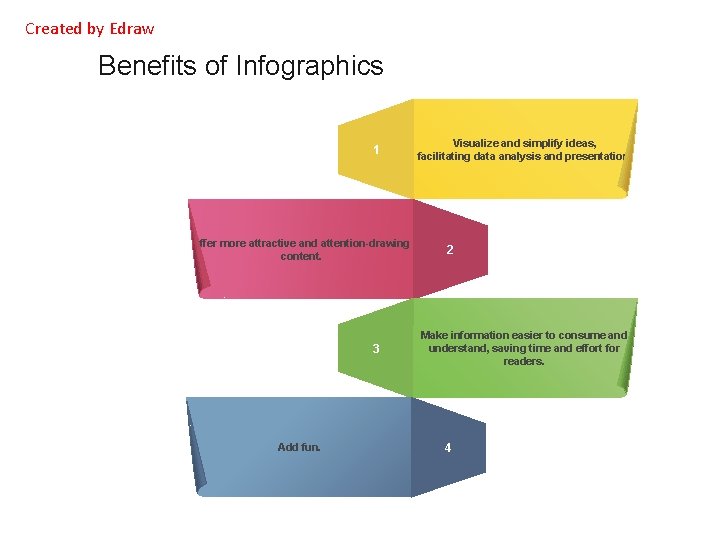
Created by Edraw Benefits of Infographics 1 offer more attractive and attention-drawing content. 3 Add fun. Visualize and simplify ideas, facilitating data analysis and presentation. 2 Make information easier to consume and understand, saving time and effort for readers. 4
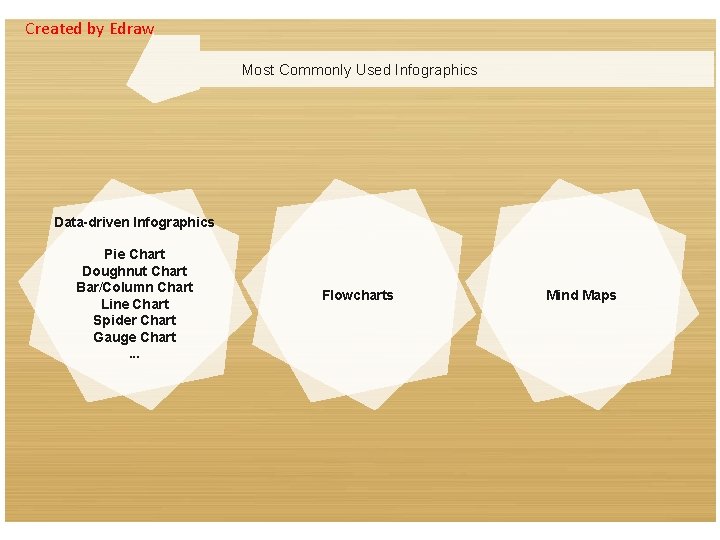
Created by Edraw Most Commonly Used Infographics Data-driven Infographics Pie Chart Doughnut Chart Bar/Column Chart Line Chart Spider Chart Gauge Chart. . . Flowcharts Mind Maps
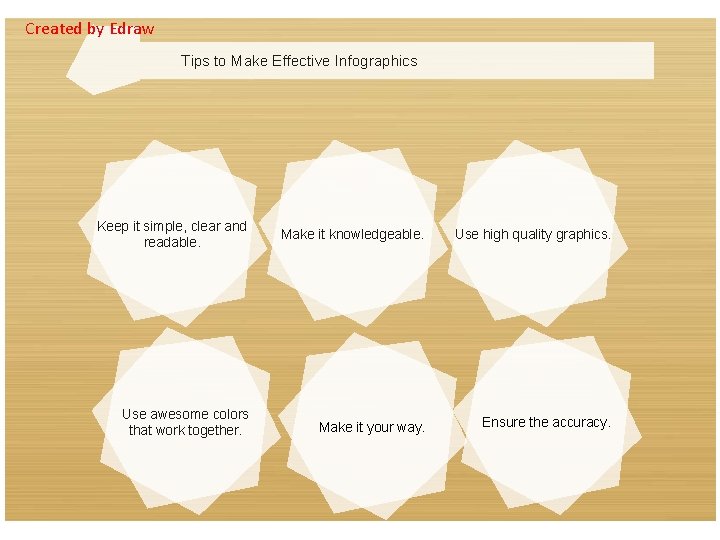
Created by Edraw Tips to Make Effective Infographics Keep it simple, clear and readable. Make it knowledgeable. Use high quality graphics. Use awesome colors that work together. Make it your way. Ensure the accuracy.
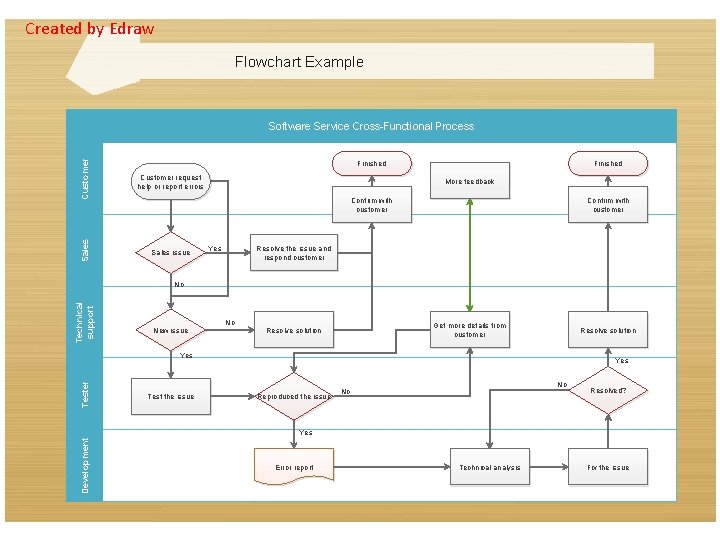
Created by Edraw Flowchart Example Customer request help or report errors Sales Software Service Cross-Functional Process Sales issue Finished More feedback Confirm with customer Yes Confirm with customer Resolve the issue and respond customer Technical support No New issue No Get more details from customer Resolve solution Tester Yes Test the issue Yes Reproduced the issue No No Resolved? Development Yes Error report Technical analysis Fix the issue
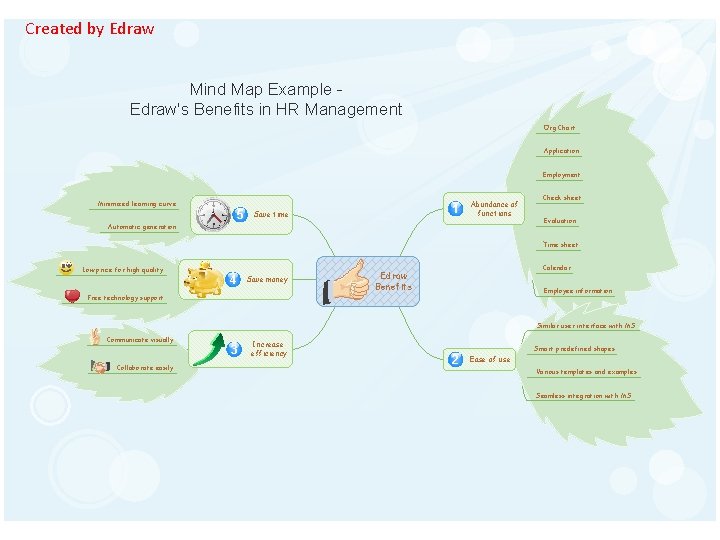
Created by Edraw Mind Map Example Edraw's Benefits in HR Management Org Chart Application Employment Minimized learning curve 5 1 Save time Abundance of functions Automatic generation Check sheet Evaluation Time sheet Low price for high quality 4 Save money Free technology support Calendar Edraw Benefits Employee information Similar user interface with MS Communicate visually Collaborate easily 3 Increase efficiency Smart predefined shapes 2 Ease of use Various templates and examples Seamless integration with MS
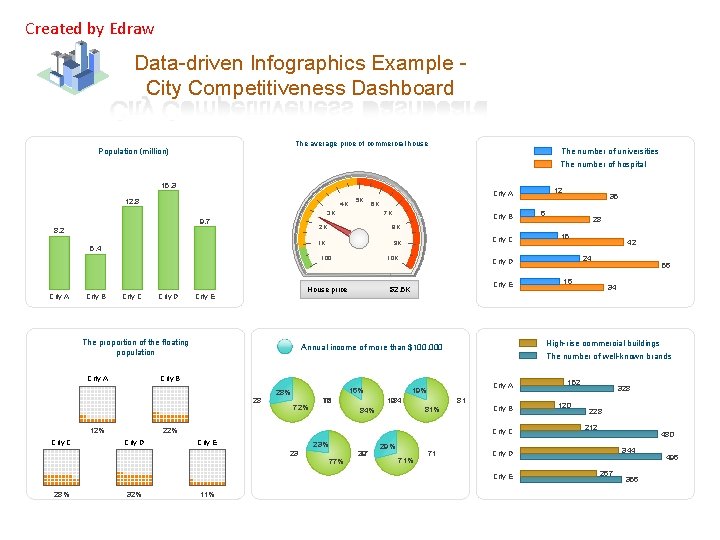
Created by Edraw Data-driven Infographics Example City Competitiveness Dashboard The average price of commercial house Population (million) The number of universities The number of hospital 15. 3 12. 8 4 K 5 K 3 K 9. 7 8. 2 5. 4 7 K City B City C City D 8 K 1 K 9 K The proportion of the floating population City A City E $2. 5 K 12% 16% 72 16 City A 1984 81 81% 84% City B City C City E 23% 77 29 23 77% 29% 71 32% 11% 15 42 24 56 16 34 152 120 328 212 480 344 City D City E 28% 28 High-rise commercial buildings 19% 22% City D 6 The number of well-known brands City B 28% 35 City D Annual income of more than $100, 000 28 City C 10 K House price City E City B 2 K 100 City A 12 City A 6 K 267 356 496
- Slides: 7