Crab Pulsar Scintillometry Xiaozheng Judy Xu Supervisor UeLi
 Xu Supervisor: Ue-Li Pen Collaborators: Robert Main, Martin van")
Crab Pulsar Scintillometry Xiaozheng (Judy) Xu Supervisor: Ue-Li Pen Collaborators: Robert Main, Martin van Kerkwijk Aug 18, 2016
")
Giant pulses from the crab (‘M 1’)

Nebula screen The crab pulsar in its nebula Effelsberg radio telescope (100 m in diameter) in Germany

Findings by Jim Cordes • Data recorded in 2002 at 1. 45 GHz using Arecibo radio telescope • Corde’s plot which shows how the frequency spectres of pulses decorrelate as they are separated more and more in time. He estimated a decorrelation time of 25 s. Figure 12 in Cordes’ paper: “The Brightest Pulses in the Universe: Multifrequency Observations of the Crab Pulsar’s Giant Pulses. ”
 network")
• Data is recorded with the European VLBI (Very long baseline interferometry) network of radio telescopes • Year: 2015 • Frequency: 1. 61 GHz EVN (European VLBI network)

Data processing

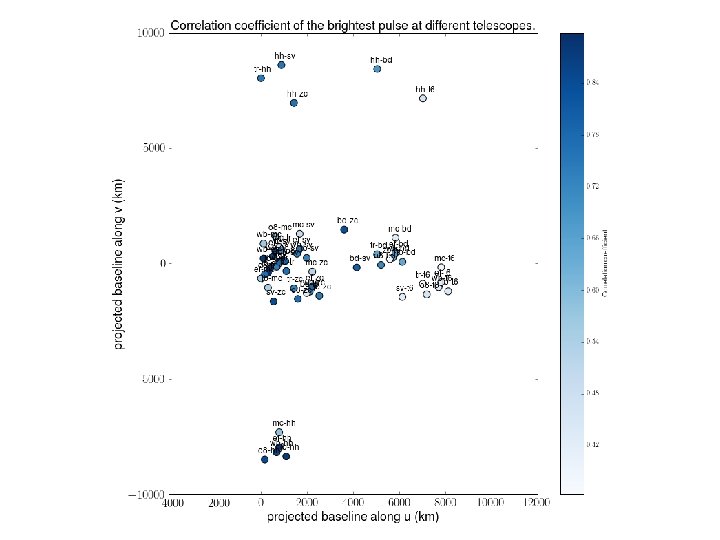
Finding a correlation coefficient

Results We were unable to reproduce Cordes’ results. There is no positive correlation even at short time lags

Closer pulses further to the left of the previous plot These two components of this double pulse is separated about 30 microseconds apart, however, they are only 0. 2 correlated.

Resolving the pulsar using its nebula screen •

Interpretation of results • The nebula environment has changed between 2002 and 2015. We have a longer scattering time of ~10µs while Cordes’ had ~1. 5 µs. • Pulses might not come from a singular location each time, but rather ‘bounces’ around in the pulsar’s magnetosphere on a scale larger than the nebula screen’s resolution. • Various models about the crab’s emission mechanisms have been proposed and debated. Knowing where the main pulses come from can support and refute these models. (See “Radio Emission Physics in the Crab Pulsar” by Eilek and Hankins in 2016 for details)

Thank you for listening Algonquin radio telescope, Photo credit to André.
- Slides: 13