Crab Pulsar Giant Radio Pulses An Investigation of

Crab Pulsar Giant Radio Pulses: An Investigation of Microsecondscale Structure and Dispersion Characteristics Jared Crossley Master of Physics Thesis Defense

The basic model of pulsars • Rotating neutron star • Dipolar magnetic field • Photons emerge from the open field line region • When the dipole moment points at us we see a pulse

Emission Models • High energy particles pulled from surface or made by pair creation • Particles move outward along field lines in a particle cascade • Outward moving plasma produces observed pulsed emission via • Curvature radiation, • Stimulated emission, or • Magnetic reconnection Lorimer & Kramer (2004)

The Crab Pulsar and Nebula FORS Team, m VLT, ESO From 8. 2 http: //chandra. harvard. edu

Main Pulse and Interpulse • Crab emits 2 pulses per rotation • One pulse from each magnetic pole

Dispersion • Radio wave propagation through ionized charges causes dispersion • Lower frequencies propagate slower • Dispersion removed by transforming to the frequency domain and applying inverse transfer function

Scattering • Propagation through turbulent plasma causes pulse scattering • Scattering produces multiple ray paths – With slightly different lengths; different arrival times • The most simple scattering model predicts pulse broadening

Observations • 53 days of observation between 1993 and 2007 • Data recorded with VLA and Arecibo telescopes using customized back-end recording instrumentation • Giant pulses are selectively recorded when the pulse energy exceeds a threshold • Records written to disk for offline dispersion removal and analysis

With this data I investigate… I. Microsecond-scale pulse structure II. Echoes in single pulses III. Dispersion in single pulses

Part I Microsecond-scale Pulse Structure

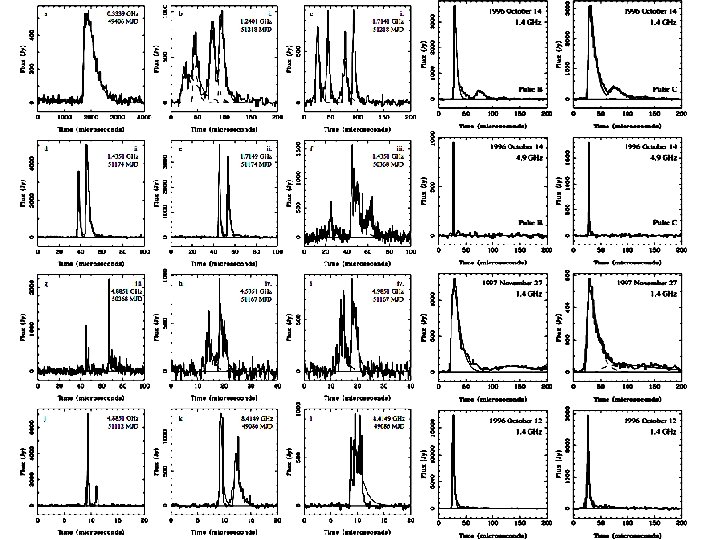
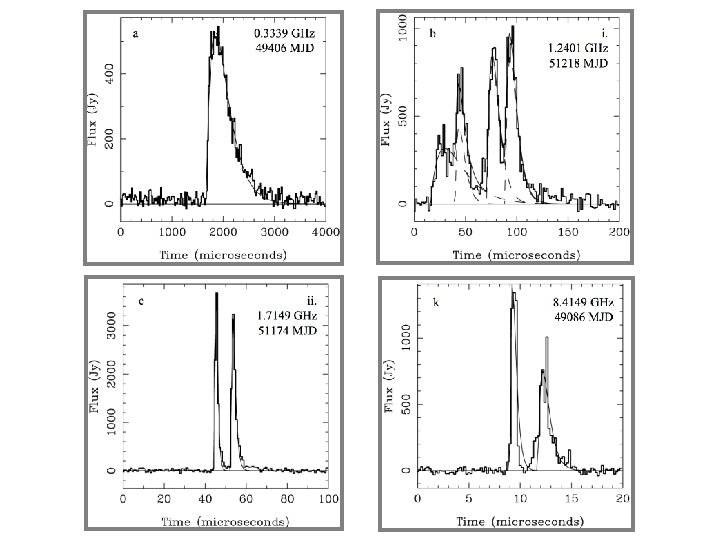
Crab Microbursts • Microburst = microsecond-scale structure visible in high-time-resolution pulses • I use main pulse data from the VLA to analyze Crab bursts • Observed frequencies: 0. 3 - 8. 4 GHz • 3000+ microbursts

Microburst fitting

0. 33 GHz 1. 66 - 1. 72 GHz Width • Bursts are broader than expected by interstellar scattering 1. 24 - 1. 41 GHz 1. 44 GHz 4. 54 - 4. 99 GHz 8. 41 GHz • Width variability occurs on short timescales • Suggests variability occurs in the magnetosphere or emission regions

0. 33 GHz 1. 66 - 1. 72 GHz Energy • Bursts inhabit a range of energies 1. 24 - 1. 41 GHz 4. 54 - 4. 99 GHz • Dashed line models constant energy in the emission frame. • Fewer high-energy bursts than expected by this model. 1. 44 GHz 8. 41 GHz • Weaker bursts are under-sampled.

0. 33 GHz 1. 66 - 1. 72 GHz Flux vs. Width • Flux is variable but flux centroid is steady 1. 24 - 1. 41 GHz 4. 54 - 4. 99 GHz • High-flux and highwidth cutoff is present in all data • Overlaid lines show constant energy curves 1. 44 GHz 8. 41 GHz • Cuttoff close but not quite constant energy

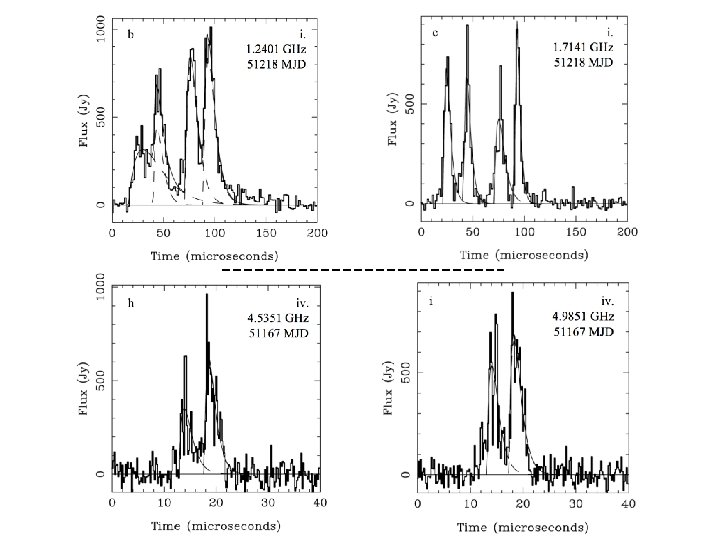
Simultaneous 2 -frequency Data • Some data recorded in two passbands • 192 microburst pairs are matched • No matches made for > 4 GHz ==> Implies microburst bandwidth < 4 GHz

Widths • Bursts wider at lower frequency y = -2. 2± 0. 9 y = -1. 6± 2. 1 y = -0. 8± 4. 7 y = -1. 8± 1. 8 • Compute width power law: • Power law index scatter is intrinsic to pulse • Power law indices do not agree with simple ISM scattering ( -4).

Energy • Energy larger at lower frequency = -1. 2± 1. 8 = -2. 4± 2. 4 = -4. 8± 8. 2 = -2. 7± 2. 0 • I measure the spectral index: • Index measurements agree with other observers

Microburst Conclusions • Flux, Width, and Energy are variable on short times, steady over long times • Energies vary both in the observed and emitted frame. • Energies may have an upper limit. • Microbursts have bandwidth < 4 GHz. • Scatter broadening power law is more shallow than interstellar scintillation. • Spectral indices vary greatly, but on average are equivalent to average profile measurements. All the above are relevant to developing new pulsar emission models.

Part II Microburst Echoes in Single Pulses

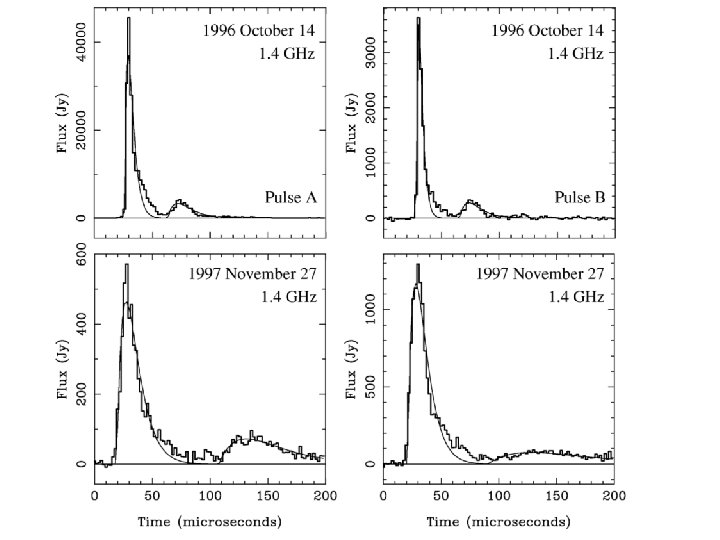
Microburst Echoes • We observed an echo-like microburst following the Crab main pulse. • The echo… • appears in many pulse periods, • lags behind the normal pulse component, • has characteristics that correlate well with the normal component.

• 16 echo events have been observed in average profiles • Attributed to refraction from transient Crab nebula filaments 150 days Crab Echo History echo Pulse period (33 ms) Dickerson 2003; Backer, Wong, & Valanju

Echo Observations Echoes present in two observing sessions: 1996 Oct 14 • Echoes at 1. 4 GHz • None at simultaneous 4. 9 GHz • None 2 days before and after 1997 Nov 26 • Echoes at 1. 4 GHz • None at 4. 9 GHz • Echo emission is frequency dependent • Shortest echo lifetime: < 4 days, in 1996

Echo Characteristics • Delay from primary to echo < 100 us – Not detectable in average profiles • Echoes widths are broader by factor ~3 – Likely a result of scattering • Echo properties do not evolve with time over ~3 hours

• Echo flux consistently 10% of primary flux • Also less energetic by factor ~3. 5 Energy and flux strongly correlate ==> Echoes not intrinsic to the star

Energy and Reflection • Enhanced scattering can account for lower flux, but not for lower energy • There are ways to lower energy in reflection: – Example: reflection from a curved surface Andrzej Szymczak • My energy ratio ==> radius of curvature = few pulsar-reflector distance

Filament Refraction? • The echo time lag and bandwidth places a limit on the system: • Nebular filaments do not satisfy this limit.

Nebular Wisps • Nebula “wisps” are more likely candidates for this echo reflection – Synchrotron emission analysis comes close to satisfying the R ne limit – Wisp size and velocity come close to < 4 day echo lifetime • Smaller and denser would satisfy both constraints http: //chandra. harvard. edu - NASA/HST/ASU/J. Hester et al.

Echo Conclusions • Echo energy and flux correlate well with primary: Echoes are not typical pulsar emission • Lower echo energy explained by refraction phenomena For example, a curved reflection surface • Frequency dependent: Echoes at 1. 4 GHz but not at 4. 8 GHz • Event lasted < 4 days • These constraints rule out reflection from nebula filaments • Nebular wisps are a potential reflection candidate

Part III Dispersion in Single Pulses

Dispersion in Single Pulses • Dispersion… • Delay arrival time for low frequencies • Must be removed to see high-time-resolution pulses • Tells us about the medium between pulsar and Earth • Measured using the time of arrival difference between pulses at two frequencies • DM = Dispersion Measure • My study includes: • 2 -frequency VLA data • Wide-bandwidth Arecibo data split into 2 passbands

Measuring Dispersion 1. Remove dispersion using avg-profile DM 2. Cross-correlate pulses 3. Measure the CCF-peak offset from zero-lag 4. Offset ==> true DM Offset typically < 1 µs

Analyzing Dispersion Main pulse Interpulse • Scatter is larger than single pulse uncertainty • Interpulse scatter is larger than main pulse scatter • No systematic variation with time or pulsar phase

• Giant pulse DM follows the same long-time-scale trend as average profile DM

• Main pulse DM is closer to the avg-profile DM • Interpulse DM is larger and more scattered Suggests interpulse has additional, variable dispersion

Main pulse Interpulse DM has a weak tendency to increase with frequency ==> suggests non-cold-plasma dispersion

Dispersion Location The magnetosphere: – Only medium with temporal variability on minute time scales – A relativistic environment: may provide non -cold-plasma dispersion

Measure Alternative Dispersion Law • Two dispersion sources: • Assume magnetosphere dispersion is power law: x = 2 for cold plasma • Measure x using interpulse data: Variability of single pulse DM data produces wide range of x.

Compare with Mag-sphere Model #1 • A strong radio wave ==> relativistic plasma motion ==> change in dispersion law • Index of refraction (Wu & Chian, 1995) convert to DM: B depends on magnetospheric conditions • Data shows no correlation between DM and flux • Correlation may be hidden by DM variability from some other phenomena • I measure an upper limit on B to constrain magnetospheric conditions.

Compare with Mag-sphere Model #2 • Strong magnetic field ==> change in particle motion ==> change dispersion law • Index of refraction (Lyutikov & Parikh, 2000) ==> DMmag • Result: DMmag < 0 for all radio frequencies • My data shows the opposite: DMmag = DMIP > 0 This dispersion model does not apply to my data.

Dispersion Conclusions Main Pulse Interpulse Less variable; consistent with DM larger and more variable average profile DM than main pulse No dependence on observing DM increases slightly with frequency increasing frequency • Additional, variable interpulse dispersion, likely from magnetosphere • Compare interpulse DM with mag-sphere dispersion models: –Strong radio waves: I find no correlation between DM and flux –Strong magnetic field: Predicts less DM, but I see more DM

The Big Picture 1 Time scale info shows • Variability in microbursts • Small delay echoes • Unexpected dispersion variability Frequency info shows • IP dispersion increases with frequency (new dispersion law!) • Microburst have finite bandwidth, < 4 GHz

The Big Picture 2 • Variability shows that something changes on short scales. • This something cannot be in the interstellar medium ==> something is changing in the star • Differences between main pulse and interpulse ==> variability does not affect all emission – It may be localized within the magnetosphere

Next Steps • Additional observations – Good spectral coverage • Further constrain microburst bandwidth • Confirm or refute magnetospheric dispersion – Extend microburst study to interpulses – Better quantify the microburst flux-width upper limit • Archival data may reveal additional pulse echo events • New theory is needed to explain – New information from microburst study – Magnetospheric dispersion

VOID Observations • VLA observations at frequencies 0. 3 - 8. 4 GHz • Observed between 1993 and 1999, for a sum total of 914 minutes. • 1, 610 Crab single giant main pulses • 3, 058 fitted microbursts • Simultaneous 2 -frequency observations constitute ~1/3 of this data

• Shortest echo delays yet observed • Not detectable in average profiles
- Slides: 50