Crab Plan Team May 2019 Bering Sea Crab

Crab Plan Team May 2019 Bering Sea Crab Ecosystem Indicators: Stock-specific ecosystem status report cards Erin Fedewa Alaska Fisheries Science Center-Shellfish Assessment

Ecosystem status reports and ecosystem report cards “Monitoring ecosystem indicators provides an early warning system for managers, signaling human or climate-induced changes that may warrant management action”

Talking Points for Today • Review of previous crab ecosystem efforts • Selected indicators for stock-specific report cards • Draft report cards: – Bristol Bay red king crab – Tanner crab (east and west) – EBS snow crab • Future indicator development & ongoing discussion • Next steps/moving forward

Where we are now and how we got here • Crab Ecosystem Considerations Chapter draft presented to CPT in 2014 by Liz Chilton • Pilot Bristol Bay Red King Crab report card draft presented to CPT in 2016 by Ben Daly
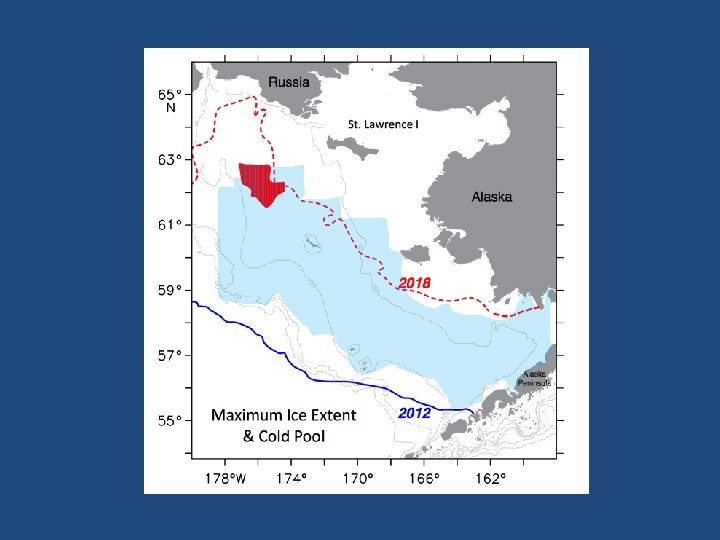
 Spatial extent of stock specific indicators")
Methodology for developing stock specific report cards 1) Spatial extent of stock specific indicators restricted to stock management boundaries 2) General indicators selected that are applicable to all 4 stocks

Selected indicators for BBRKC, tanner and snow crab draft report cards • • • Total crab biomass: All sizes + sexes Pre-recruit crab biomass: Males only CV (%) of pre-recruit biomass: (σ/µ) * 100 Total fishery removals: Total catch + bycatch estimates Bottom temperature: Summer temps from NOAA EBS BT survey Proportion cold pool: # of stock stations w/ bottom temps < 2°C total # of stock stations Benthic invert biomass (competitors): sea stars, hermits, urchins ect. Benthic forager biomass (predators): sculpin, flatfish, pcod, skate Pacific cod predation index: pcod abundance*proportion crab in diet Pelagic forager biomass (predators): pollock, herring, capelin ect.

Bristol Bay Red King Crab • The 2018 total BBRKC biomass was the lowest ever in the 39 -year time series • Pre-recruit biomass has also remained well below the long-term average 5 -year mean: within 1 sd of long-term mean 5 -year trend: decrease by 1 s. d.

Bristol Bay temperatures Summer bottom temperatures in Bristol Bay were above average during four of the past five years The cold pool did not extend into the Bristol Bay management area during these four warm years

Bristol Bay foraging guilds Survey biomass of competitors, benthic foragers, and pelagic foragers in Bristol Bay all increased in 2016 and since then, the overall trend in biomass is decreasing

Benthic invert biomass increases in 2016 primarily due to very high catches of purple-orange sea stars

Benthic forager biomass increases in 2016 primarily due to very high catches of yellowfin sole and northern rock sole. Increased flatfish and/or benthic invert competition potentially driving recent declines in RKC pre-recruit biomass?
 biomass has remained below")
Tanner Crab East • Pre-recruit (males 113 -124 mm CW) biomass has remained below the long-term average, with a decreasing trend in the past 5 years. • The CV of pre-recruit biomass indicates a decrease in spatial variability of tanner crab abundances east of 166 W over the past 5 years.

CV of Tanner crab pre-recruit biomass 2013 Tanner crab density 2017 Tanner crab density

Tanner Crab West • Summer bottom temperatures were above average in 2018, and the warmest in the 39 -year time series. • The cold pool extent was also one of the lowest on record in the west of 166°W management area.

Pacific cod predation on tanner crab has remained high since 2010

Snow crab The 2018 total snow crab biomass was well above the long-term average but what effects will warming and reduced sea ice have on snow crab?

2017 Pacific cod catches Catch > 1 KG/HA 2017 snow crab density

2018 Pacific cod catches 2018 snow crab density What will predation index look like for 2018? Data coming soon!

% Frequency of snow crab in Pacific cod stomachs 40% 35% % frequency 30% 25% EBS Domains: South Middle North 20% 15% 10% 5% 0% 0 10 20 30 40 50 60 C. opilio CW (mm) 70 80 90 100

Indicator development: Revisions to current indicators • Further refine species included in foraging guilds? • Predation index – Incorporate predator/prey lengths – Determine annual average Partial Fullness index (BF) values for crab prey by weighting by NOAA BT survey biomass estimates (Buckley et al. 2016) • CV of pre-recruit biomass: Likely not appropriate due to highly skewed biomass data – Instead, use standard deviation of log-transformed data (Litzow et al. 2013)

Ongoing discussion: Identify and develop additional indicators for each stock • Ben Daly indicator development efforts for BBRKC • Spatially refine additional indicators used in Ecosystem Considerations chapter? • Any additional crab-relevant time series? • Ongoing/future data collection for additional indicators

BBRKC ovigerous female dispersion indicator Extent of population relative to total abundance Loher and Armstrong 2005 ACWD (Average Central Weighted Distribution): Lat + Long weighted by RKC abundance, then averaged • Implications for larval advection, mating success, spatial overlap with predators, etc

Larval advection indicator • Impacts larval advection trajectories, settlement strength, recruitment OSCURS or ROMS model time series runs • Pick a spot, track advection for a set time span • Quantify distance traveled, direction, etc.

Larval crab abundance indicator • Potential indication of recruitment strength • Eco. Foci spring ichthyoplankton survey likely overlaps temporally with early life history stages of EBS crab stocks

Primary/secondary production indicator • Index for food availability for crab larvae • Phytoplankton- Chl a estimates • Zooplankton- Eco. Foci Rapid Zooplankton Assmt

Body condition indicator for crab stocks? Energetic condition of pollock prior to their first winter predicts their survival to age-1

Chionoecetes body condition indicator P<0. 001 P=0. 02 P=0. 25 Snow C. opilio Hybrid Tanner C. bairdi Snow and tanner crab showed a decrease in lipids (i. e. body condition) between 2012 (cold) and 2014 (warm) Copeman et al.

Benthic prey indicator? A significant positive correlation between snow crab energy density and stable δ 13 C isotope values suggests that energetic condition is improved with the use of benthic (i. e. algal and detrital-based) carbon sources

Next Steps • Continued empirical data collection – Indicator development and selection directly influenced by the extent of knowledge and available data • Develop additional indicators for each stock and produce report cards for remaining stocks -Indicator selection, threshold setting and evaluation • Long term vision: develop quantitative multivariate indicators for inclusion in stock assessment development and decision making during annual quota setting
")
New Direction: ESP’s A new standardized framework termed the ecosystem and socioeconomic profile (ESP) has recently been developed to serve as a proving ground for testing ecosystem and socioeconomic linkages within the stock assessment process (Shotwell et al. , In Prep).

Questions moving forward: • Additional indicators? • Priorities for ongoing/future empirical data collection? • Are these spatially explicit report cards of value to management decisions/quota setting? • Proceed with additional stocks or prioritize indicator development for current 4 stocks? • Adopt ESP framework for each stock moving forward? • Timeline: • Annual report cards and supporting documentation produced annually for May CPT meeting? • Update for September to include in SAFE chapters?
- Slides: 32