CPU CPU cat proccpuinfo Top Vmstat 2 3


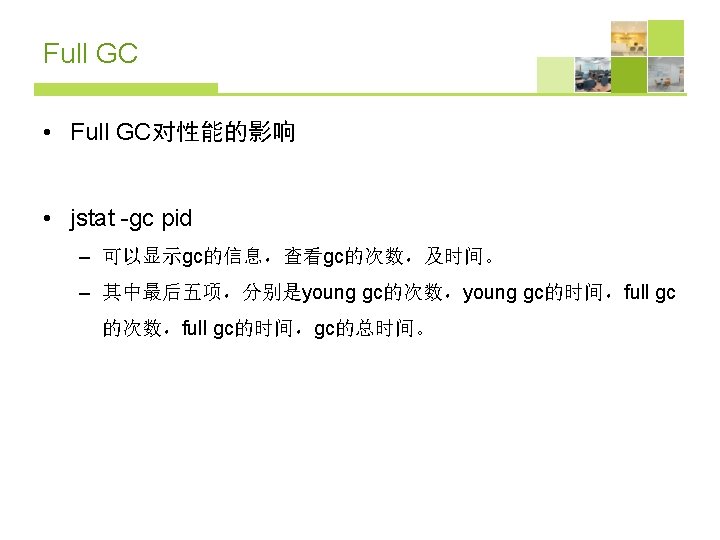
 – Java和进程管理->进程定义->Java虚拟机->运行时->详细垃圾回收( 确认后立即生效) – 在通用JVM参数输入框中添加:-Xverbosegclog:")


的free和used • Swap(si 、so)")


(3 x. Sun")


- Slides: 116
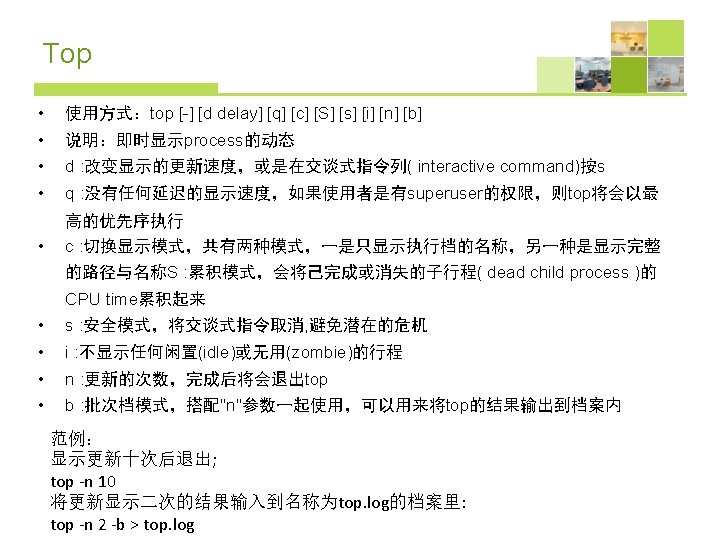
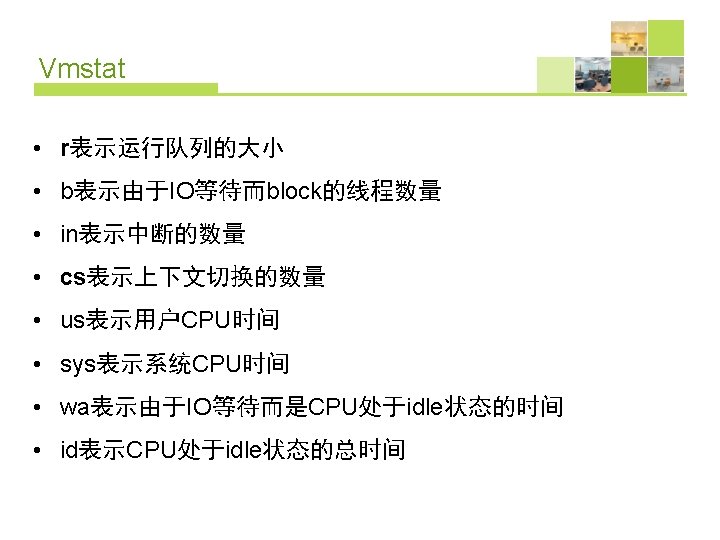
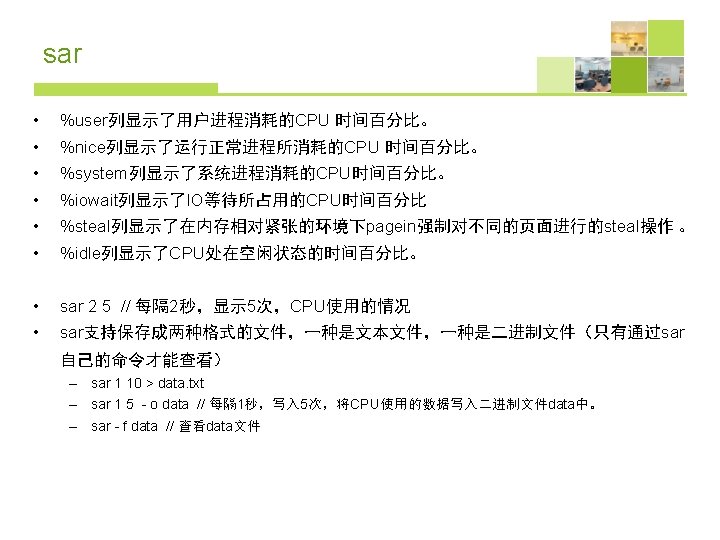
CPU性能监控 • 查看CPU信息: – cat /proc/cpuinfo • Top • Vmstat 2 3 • Dstat -cip 1 • Mpstat -P ALL 1 • Sar 1 10 • Pidstat -p <PID> 2 5
Mpstat • mpstat可以显示每个CPU的运行状况,比如系统有4个CPU。 我们可以看到: # mpstat –P ALL 1 Linux 2. 4. 21 -20. ELsmp (localhost. localdomain) 05/23/2006 05: 17: 31 PM CPU %user %nice %system %idle intr/s 05: 17: 32 PM all 0. 00 3. 19 96. 53 13. 27 05: 17: 32 PM 0 0. 00 100. 00 05: 17: 32 PM 1 1. 12 0. 00 12. 73 86. 15 13. 27 05: 17: 32 PM 2 0. 00 100. 00 05: 17: 32 PM 3 0. 00 100. 00
free • $ free -m total used free shared buffers cached Mem: 1002 769 232 0 62 421 -/+ buffers/cache: 286 715 Swap: 1153 0 1153 第二部分(-/+ buffers/cache): (-buffers/cache) used内存数: 286 M (指的 第一部分Mem行中的used - buffers - cached) (+buffers/cache) free内存数: 715 M (指的第 一部分Mem行中的free + buffers + cached) 第一部分Mem行: total 内存总数: 1002 M used 已经使用的内存数: 769 M free 空闲的内存数: 232 M shared 当前已经废弃不用,总是 0 buffers Buffer缓存内存数: 62 M 可见-buffers/cache反映的是被程序实实在 cached Page缓存内存数: 421 M 在吃掉的内存,而+buffers/cache反映的是 关系:total(1002 M) = used(769 M) + free(232 M) 可以挪用的内存总数。
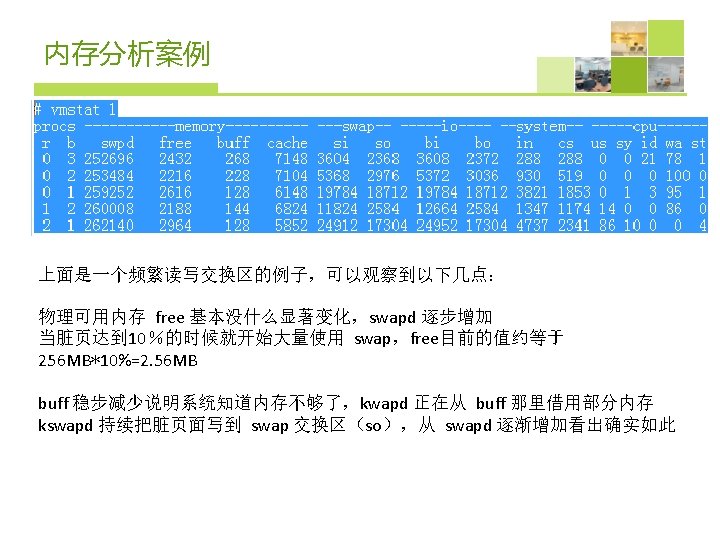
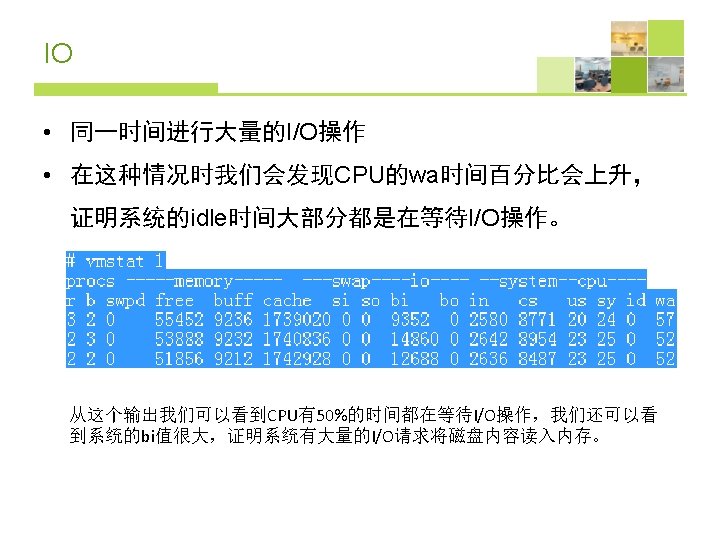
vmstat
磁盘性能监控 • df -hl. T • parted -l • Vmstat • iostat -d 2 3 • sar -d 2 3 • Iotop • pidstat • iodump
iostat
iotop
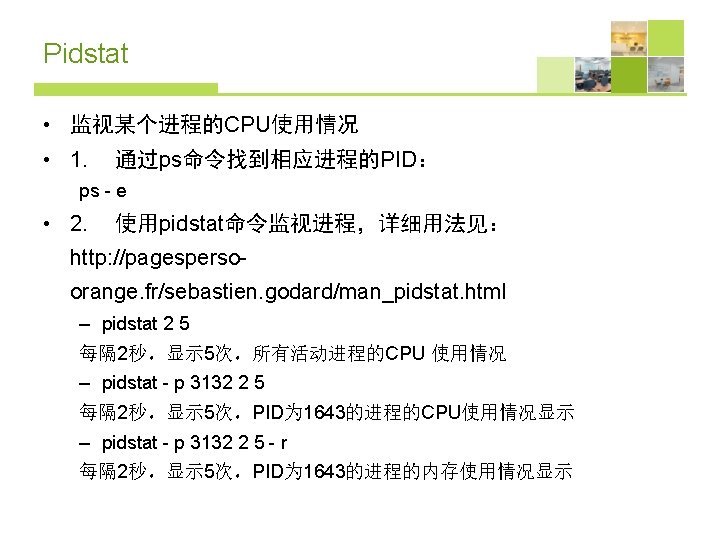
pidstat • pidstat -d 1 • pidstat -C test_io -t -d 1
iodump • wget http: //aspersa. googlecode. com/svn/trunk/iodump • echo 1 > /proc/sys/vm/block_dump root@kanga: ~# while true; do sleep 1; dmesg -c; done | perl iodump ^C# Caught SIGINT. TASK PID TOTAL READ WRITE DIRTY DEVICES firefox 4450 4538 251 4287 0 sda 4, sda 3 kjournald 2100 551 0 sda 4 firefox 28452 185 0 sda 4 kjournald 782 59 0 sda 3 pdflush 31 30 0 sda 4, sda 3 syslogd 2485 2 0 sda 3 firefox 28414 2 0 sda 4, sda 3 firefox 28413 1 0 sda 4 firefox 28410 1 0 sda 4 firefox 28307 1 0 sda 4 firefox 28451 1 0 sda 4
网络性能监控 • ping • Netstat -i • Sar -n DEV 1 3 • Sar -n SOCK 1 3 • if. Top、ip. Traf
if. Top
打开server-status监控 Load. Module status_modules/Apache. Module. Status. dll # Allow server status reports, with the URL of http: //servername/serverstatus # Change the ". your_domain. com" to match your domain to enable. <Location /server-status> Set. Handler server-status order deny, allow deny from allow from 127. 0. 0. 1 </Location>
状态监控页面 • Scoreboard Key: "_" Waiting for Connection, "S" Starting up, "R" Reading Request, "W" Sending Reply, "K" Keepalive (read), "D" DNS Lookup, "L" Logging, "G" Gracefully finishing, ". " Open slot with no current process
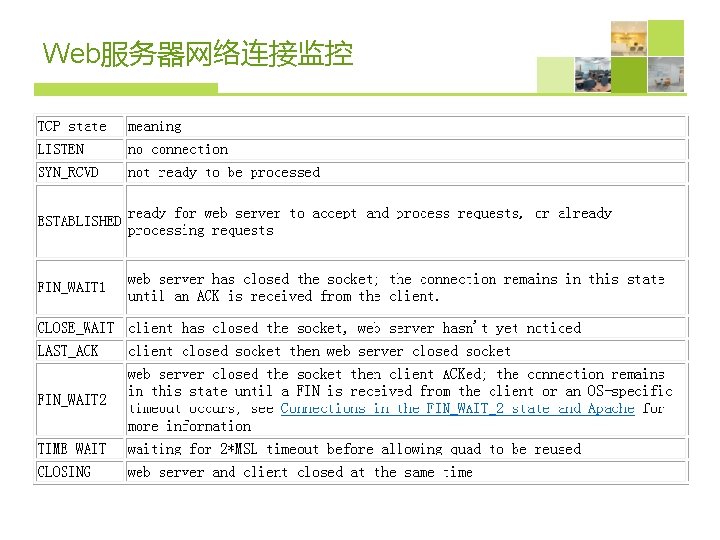
Web服务器网络连接监控 • Linux下实时检测httpd连接数 – watch -n 1 -d "pgrep httpd|wc -l“ • 查看TCP并发连接情况: – netstat -n | awk '/^tcp/ {++S[$NF]} END {for(a in S) print a, S[a]}'
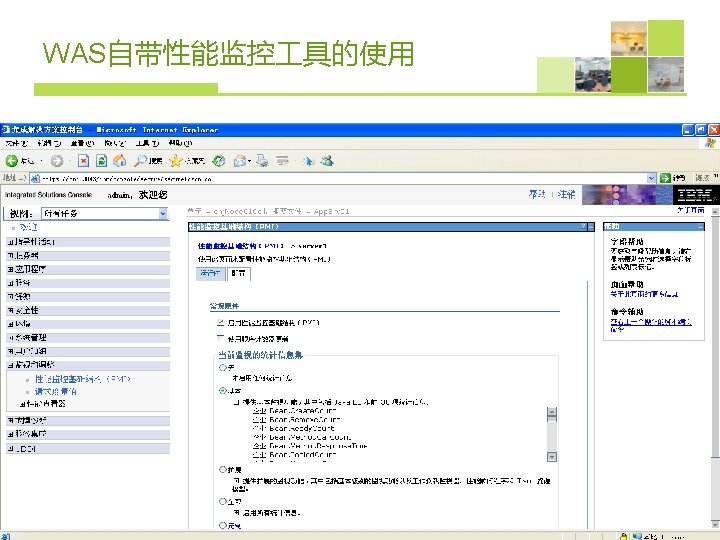
perf. Servlet. App的使用方法 • 部署Perf. Servlet. App. ear到Web. Sphere目录下
perf. Servlet. App的使用方法
Load. Runner监控WAS
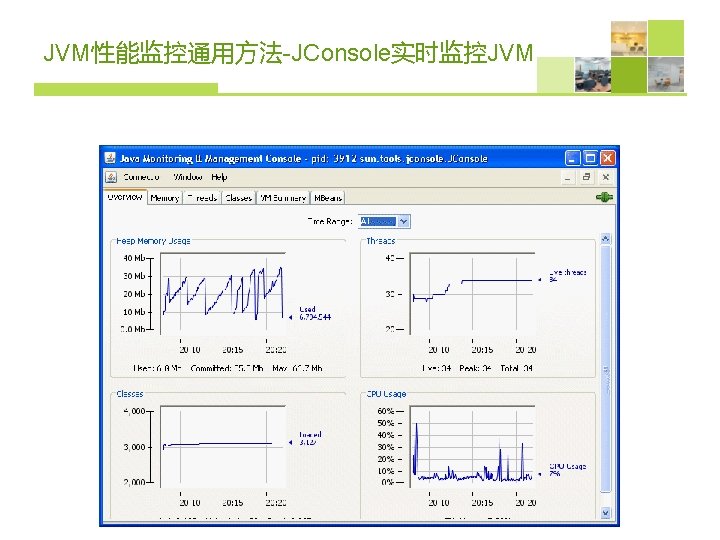
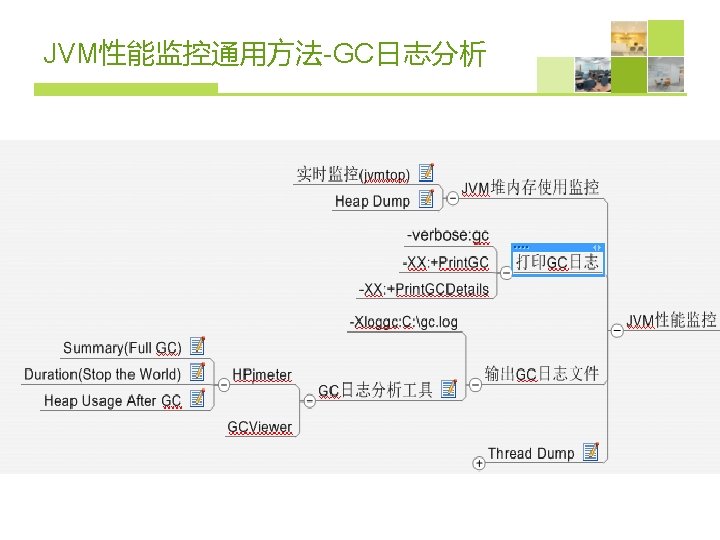
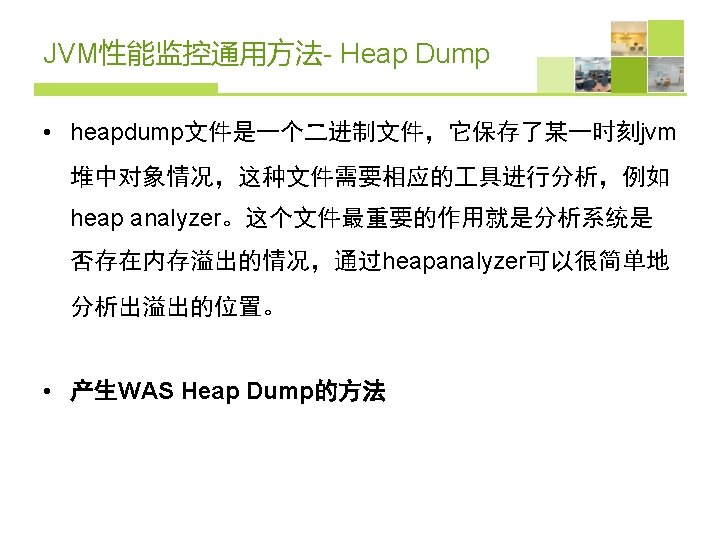
JVM性能监控通用方法 • JConsole实时监控JVM • GC日志分析 • Heap Dump • Thread Dump
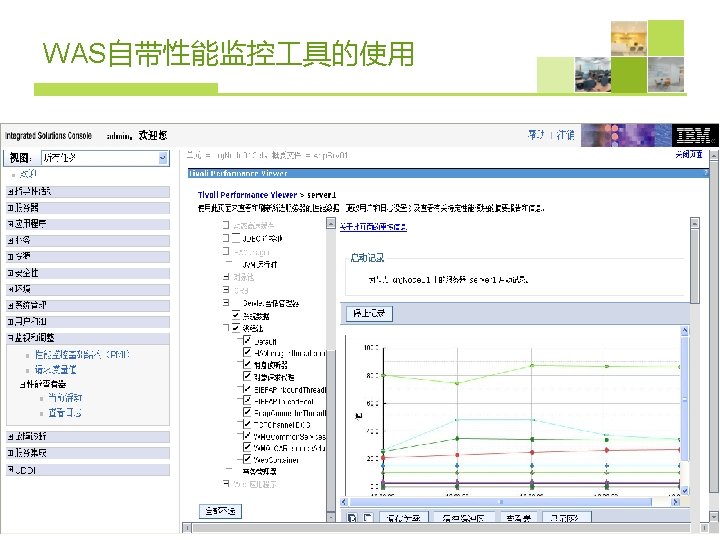
打开 WAS GC日志 • 打开WAS GC日志 – Java和进程管理->进程定义->Java虚拟机->详细垃圾回收(保存配置 后重新启动服务生效) – Java和进程管理->进程定义->Java虚拟机->运行时->详细垃圾回收( 确认后立即生效) – 在通用JVM参数输入框中添加:-Xverbosegclog: gc. log • JVM GC日志的保存目录 – WASHOME/profiles/yourprofile/logs/yourserver/native_stderr. log 和 native_stdout. log – C: Web. SphereApp. ServerprofilesApp. Srv 01gc. log
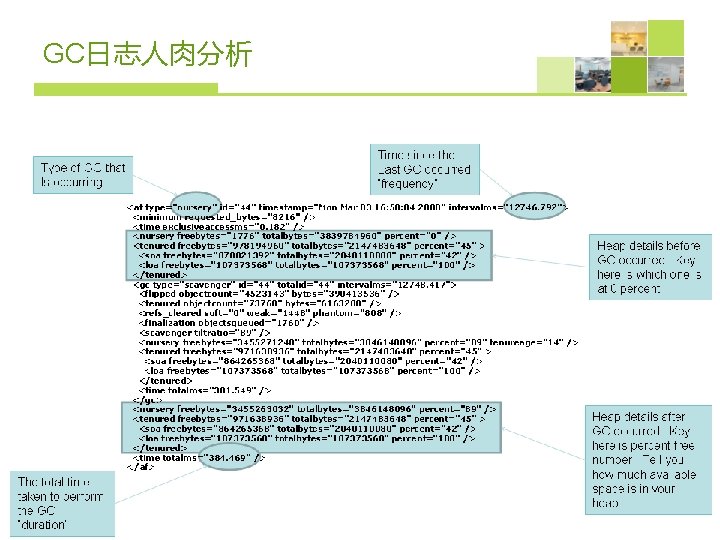
GC日志分析 具 • IBM Support Assistant - Garbage Collection and Memory Visualizer • IBM Pattern Modeling and Analysis Tool(PMAT) • GCViewer • …
JVM性能监控通用方法-Thread Dump
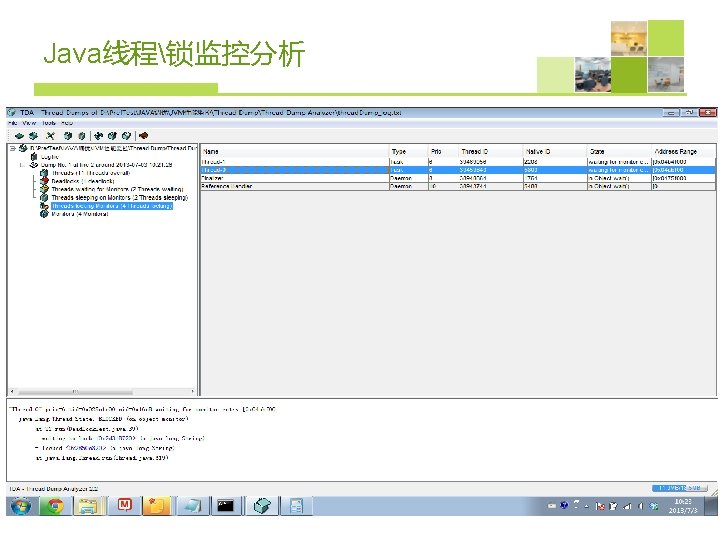
线程监控和分析 具 • Thread dump提供了当前活动的线程的快照. 它提供了 JVM中所有Java线程的栈跟踪信息 • 产生WAS Thread Dump的方法 • Jconsole Visual. VM JProfiler • Thread Dump Analyzer • IBM Thread and Monitor Dump Analyzer for Java
JVM远程监控 • Jstatd • Jconsolevisualvm • Jprofile
中间件性能监控与分析 具 • HP Diagnostics JProfiler JProbe Your. Kit App. Dynamics • Domain. Health Javamelody JAMON
App. Dynamics
JDBC性能分析 • P 6 spy + sqlprofiler • JDb. Monitor • JAMON
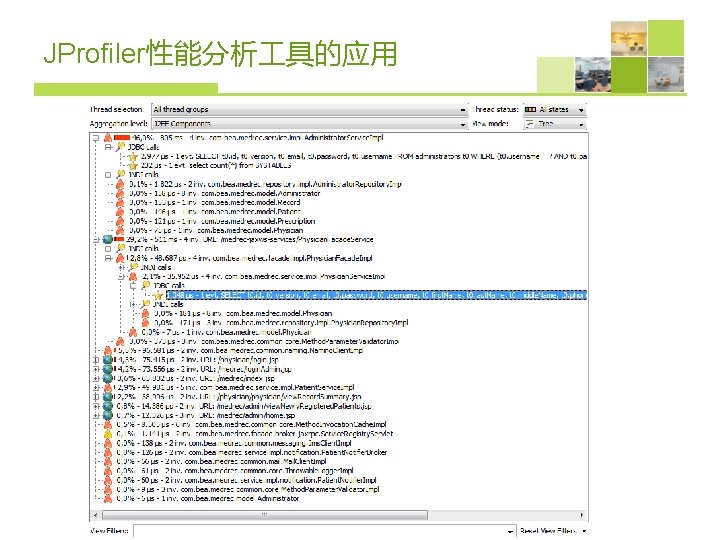
JProfiler监控JDBC
Linux系统性能诊断 �判�准 影响性能因素 好 坏 user% + sys%< 70% CPU user% + sys%= user% + sys% 85% >=90% 内存 Swap In(si)= 0 Per CPU with 10 More Swap In & Swap Out(so)= 0 page/s Swap Out 磁� iowait % < 20% iowait % =35% 糟糕 iowait % >= 50%
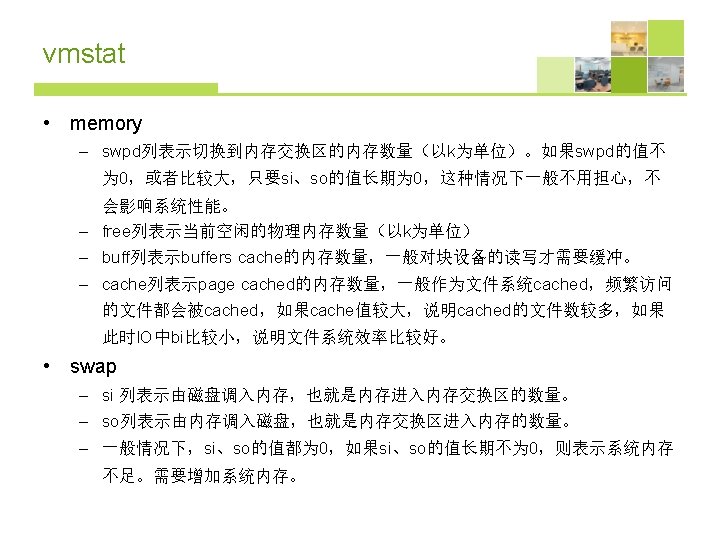
内存 • (-/+ buffers/cache)的free和used • Swap(si 、so)
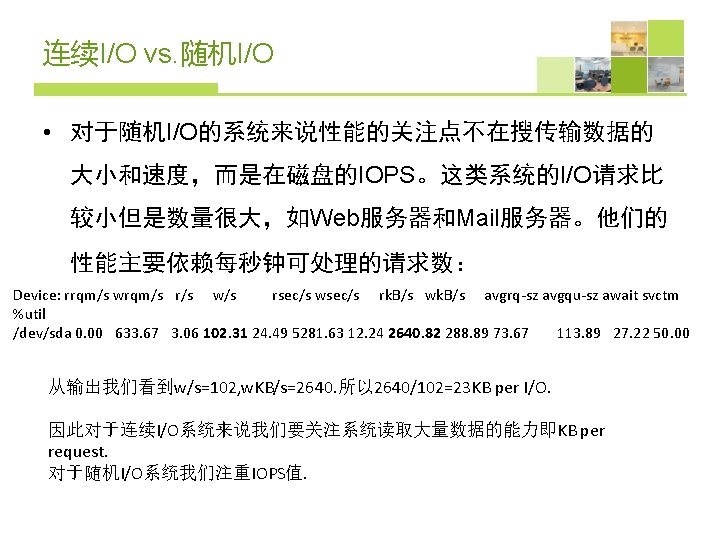
连续I/O vs. 随机I/O • 连续I/O常常出现在企业级数据库这样的应用中,需要连 续的读取大量数据。这种系统的性能依靠它读取和移动数 据的大小和快慢。我们用iostat来监控,会发现r. KB/s和 w. KB/s会很高。 Device: rrqm/s wrqm/s r/s w/s rsec/s wsec/s rk. B/s wk. B/s avgrq-sz avgqu-sz await svctm %util /dev/sda 0. 00 12891. 43 0. 00 105. 71 0. 00 106080. 00 53040. 00 1003. 46 1099. 43 3442. 43 26. 49 280. 00 从输出我们看到w/s=105, w. KB/s=53040. 所以 53040/105=505 KB per I/O.
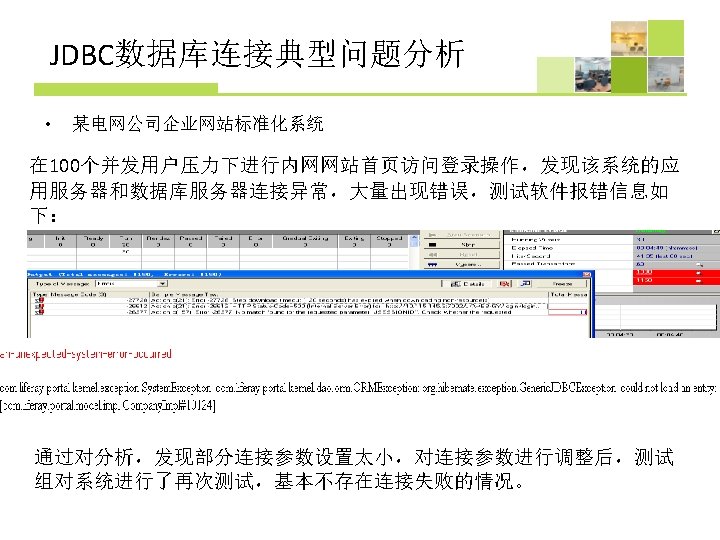
JDBC数据库连接典型问题分析 • 某电商网站 应用层攻击 Caused by: java. sql. SQLException: We are already in the process of making 11 connections and the number of simultaneous builds has been throttled to 10
Minor GC的过程
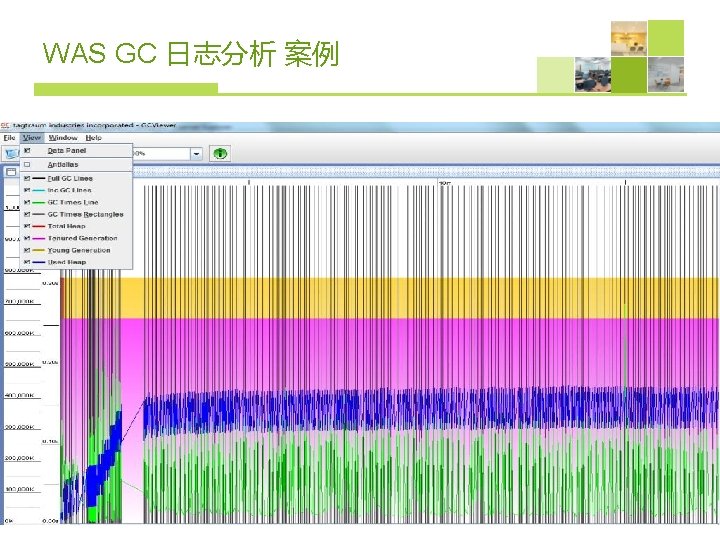
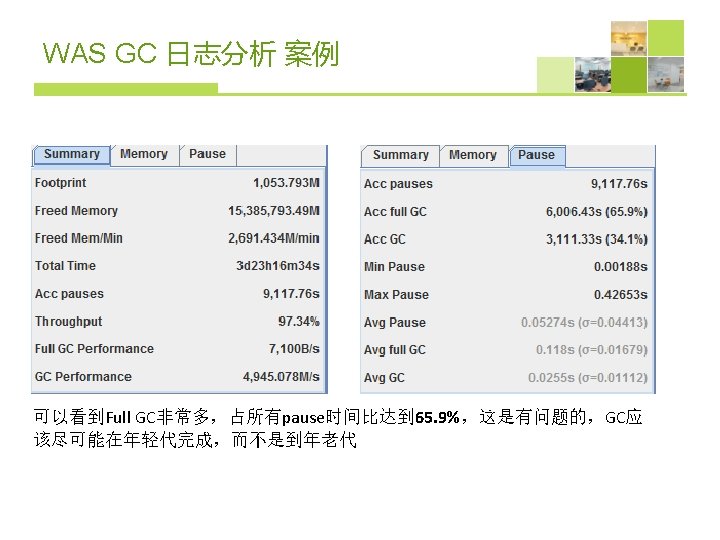
WAS GC日志分析 具 • 用PMAT分析GC日志 java -Xmx 512 m -jar ga 414. jar • GCViewer
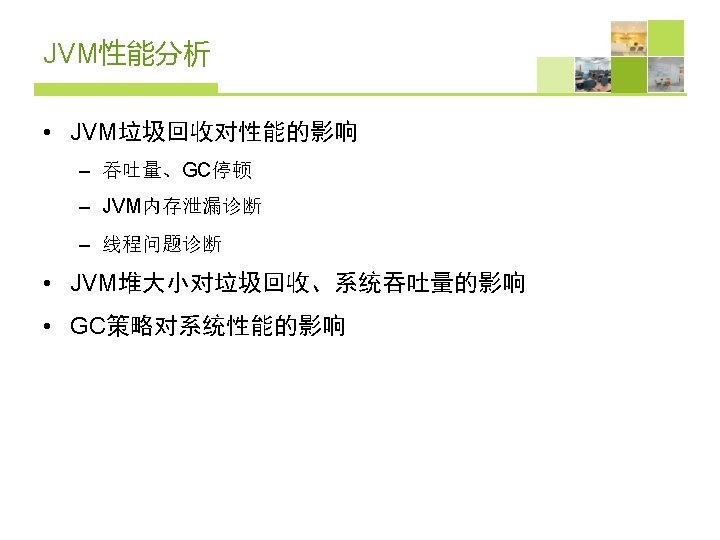
GC策略对系统性能的影响 • 新生代串行收集器 • 老年代串行收集器 • 并行收集器 • 新生代并行回收收集器 • 老年代并行回收收集器 • CMS(Concurrent Mark Sweep)收集器 -Xgcpolicy: optthruput -Xgcpolicy: optavgpause -Xgcpolicy: gencon -Xgcpolicy: balanced 案例 – Plants. By. Web. Sphere
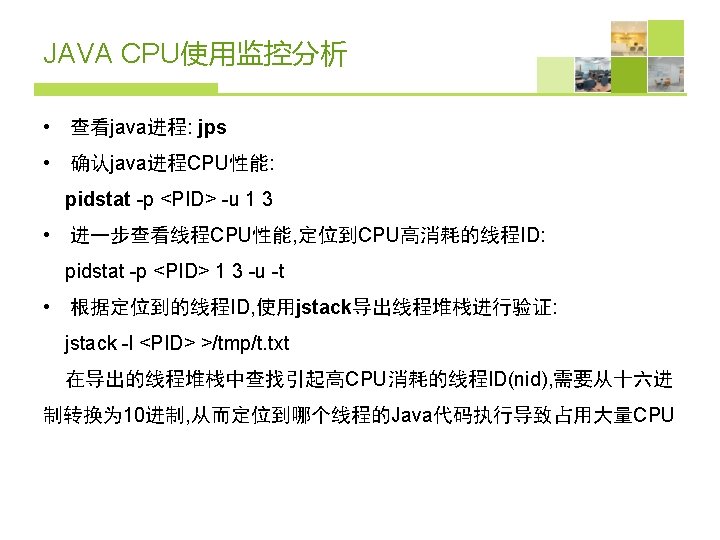
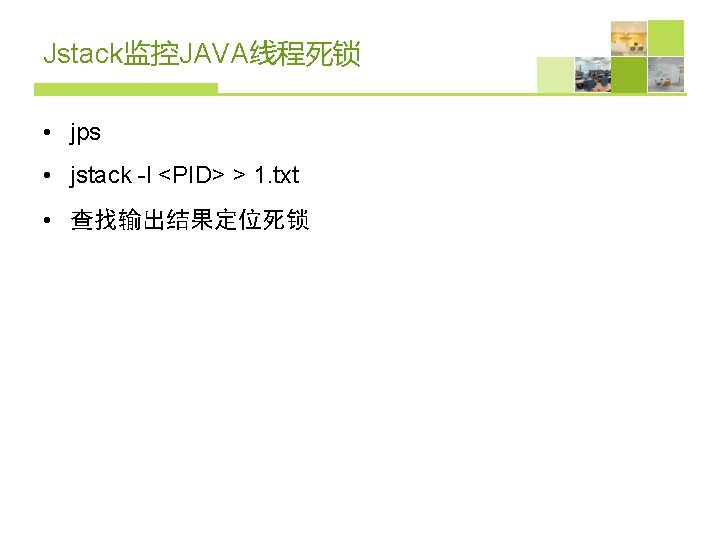
JAVA I/O使用监控分析 • iostat -dx 3 • jps • pidstat -p <PID> -d -t 1 3 • jstack -l <PID> >/tmp/t. txt
WAS线程Dump分析 具 • IBM Thread and Monitor Dump Analyzer for Java java -Xmx 500 m -jar jca 101. jar
JSPServlet性能分析与优化 • JSP 、Servlet常见性能问题分析与优化 • 具 – App. Dynamics、JProfiler – JAMON
Tsung • http: //tsung. erlang-projects. org/ • Jabber/XMPP 协议 90万并发jabber用户(使用 4个节点的tsung 集群)(3 x. Sun V 240 + 1 Sun V 440) 10万并发用户(使用 3个结点tsung集群)(CPU 800 MHz) • HTTP and HTTPS 协议 12万并发用户(使用 4个结点的tsung集群)该测试平台达到每秒 3000个请求 1000万并发用户,(使用 75结点的tsung集群,)并发超过100万个请求 • 目前可以用来测试HTTP, Web. DAV, SOAP, Postgre. SQL, My. SQL, LDAP, and Jabber/XMPP