
CPSC 531 System Modeling and Simulation Carey Williamson

- Slides: 75
CPSC 531: System Modeling and Simulation Carey Williamson Department of Computer Science University of Calgary Fall 2017
Overview § The world a model-builder sees is probabilistic rather than deterministic: — Some probability model might well describe the variations Goals: § Review the fundamental concepts of probability § Understand the difference between discrete and continuous random variable § Review the most common probability models 2
Outline § Probability and random variables — Random experiment and random variable — Probability mass/density functions — Expectation, variance, correlation § Probability distributions — Discrete probability distributions — Continuous probability distributions — Empirical probability distributions 3
Outline § Probability and random variables — Random experiment and random variable — Probability mass/density functions — Expectation, variance, correlation § Probability distributions — Discrete probability distributions — Continuous probability distributions — Empirical probability distribution 4
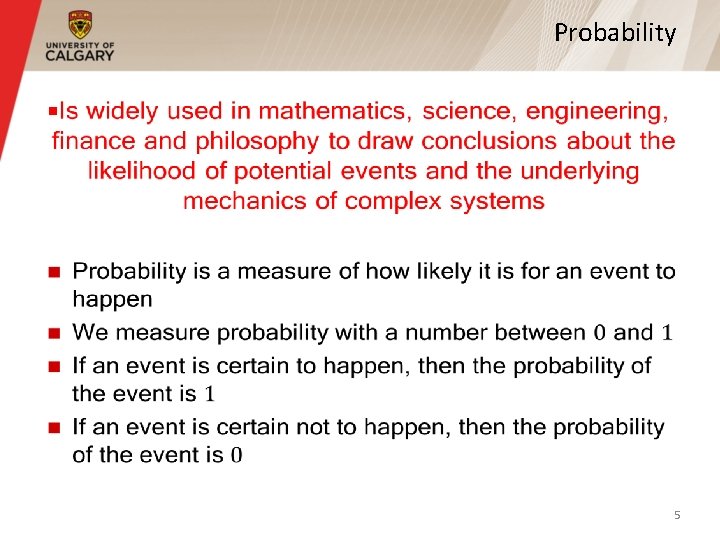
Probability § 5
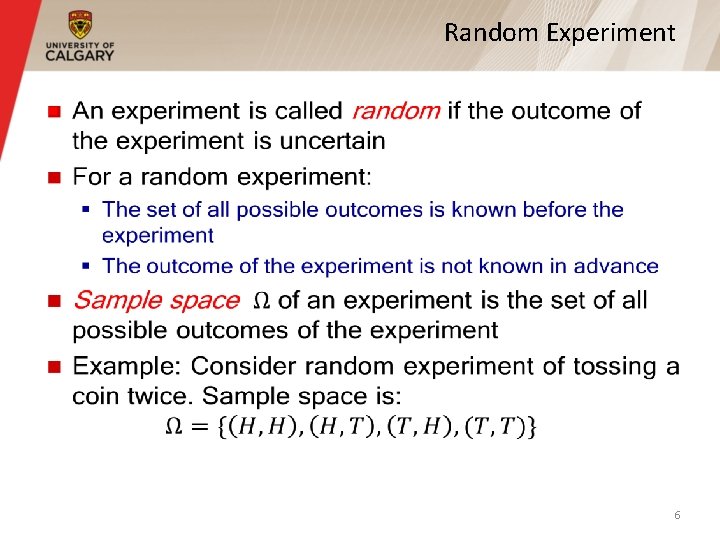
Random Experiment § 6
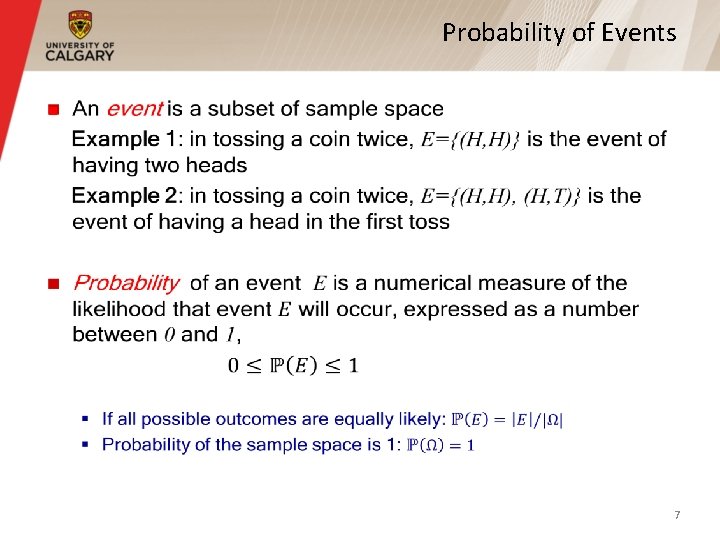
Probability of Events § 7
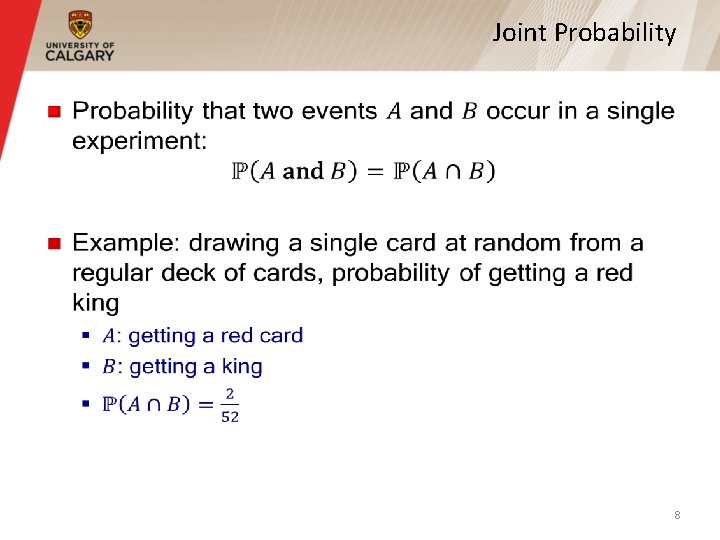
Joint Probability § 8
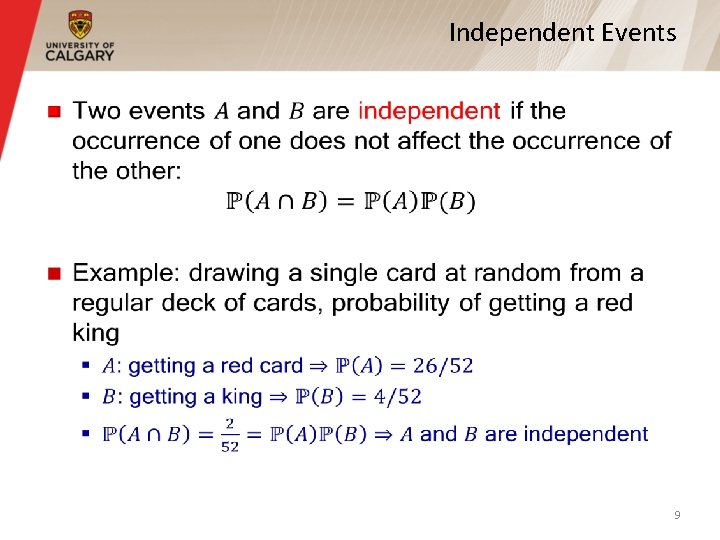
Independent Events § 9
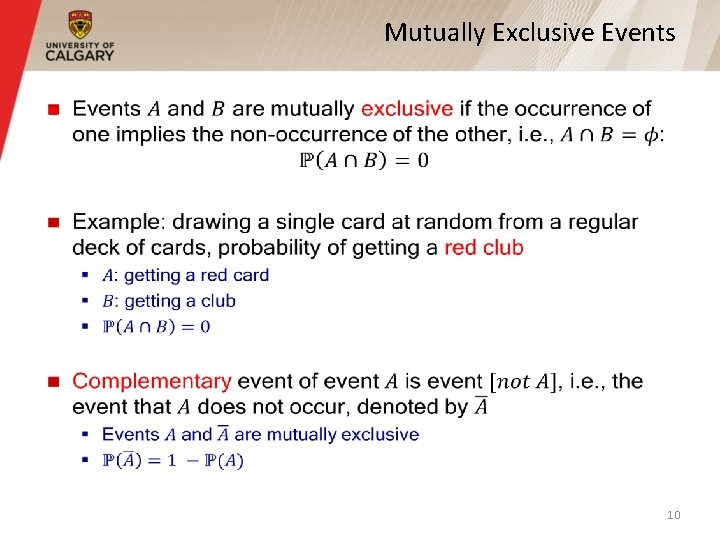
Mutually Exclusive Events § 10
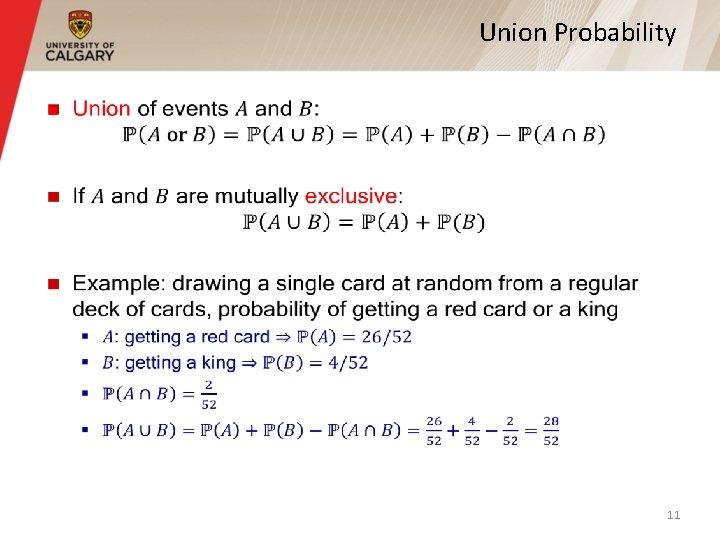
Union Probability § 11
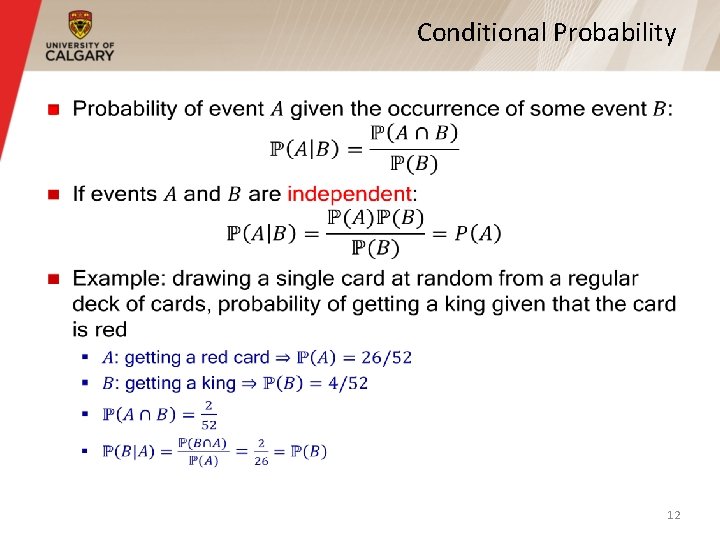
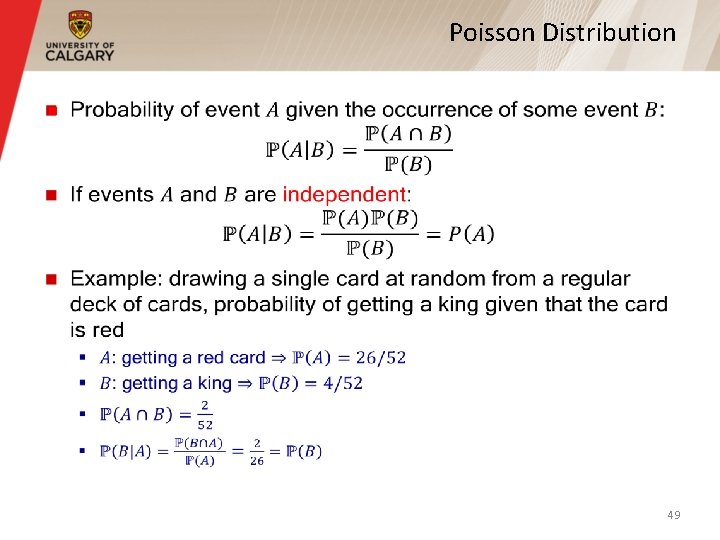
Conditional Probability § 12
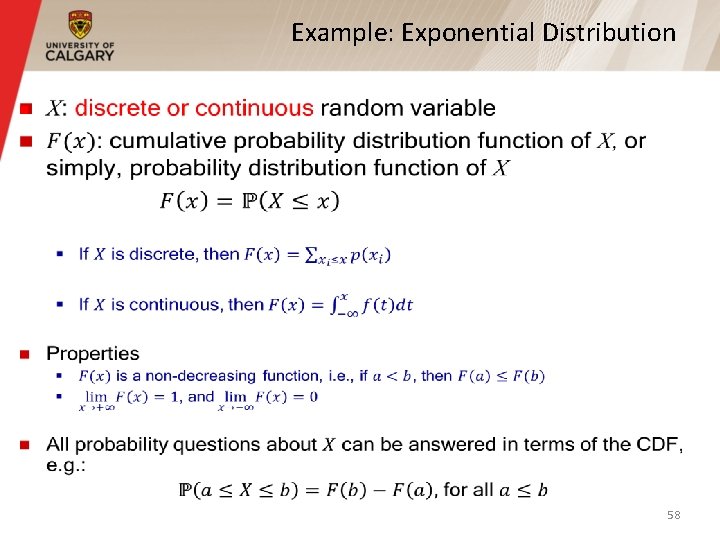
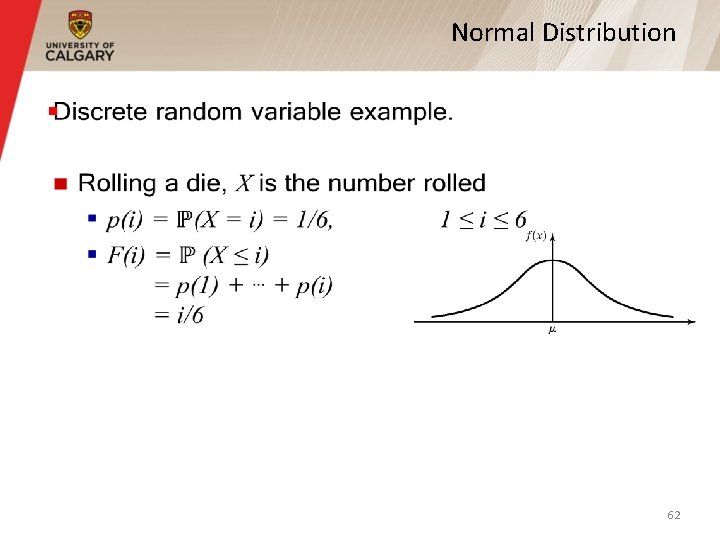
Random Variable § A numerical value can be associated with each outcome of an experiment § A random variable X is a function from the sample space to the real line that assigns a real number X(s) to each element s of X: → R § Random variable takes on its values with some probability 13
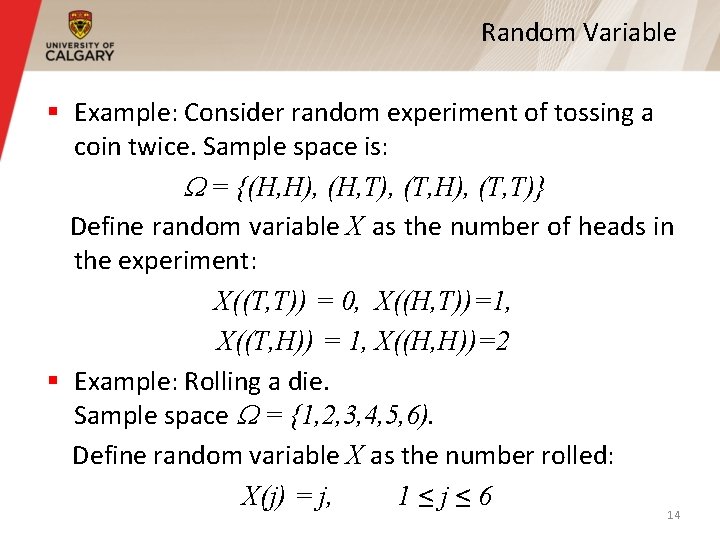
Random Variable § Example: Consider random experiment of tossing a coin twice. Sample space is: = {(H, H), (H, T), (T, H), (T, T)} Define random variable X as the number of heads in the experiment: X((T, T)) = 0, X((H, T))=1, X((T, H)) = 1, X((H, H))=2 § Example: Rolling a die. Sample space = {1, 2, 3, 4, 5, 6). Define random variable X as the number rolled: X(j) = j, 1≤j≤ 6 14
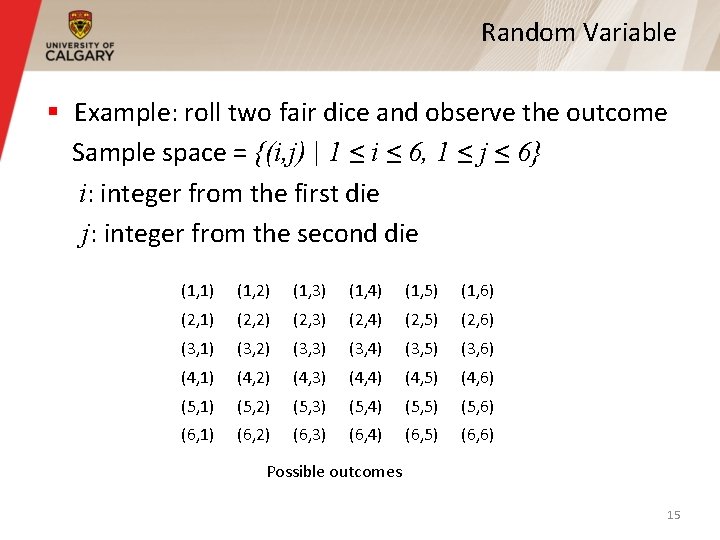
Random Variable § Example: roll two fair dice and observe the outcome Sample space = {(i, j) | 1 ≤ i ≤ 6, 1 ≤ j ≤ 6} i: integer from the first die j: integer from the second die (1, 1) (1, 2) (1, 3) (1, 4) (1, 5) (1, 6) (2, 1) (2, 2) (2, 3) (2, 4) (2, 5) (2, 6) (3, 1) (3, 2) (3, 3) (3, 4) (3, 5) (3, 6) (4, 1) (4, 2) (4, 3) (4, 4) (4, 5) (4, 6) (5, 1) (5, 2) (5, 3) (5, 4) (5, 5) (5, 6) (6, 1) (6, 2) (6, 3) (6, 4) (6, 5) (6, 6) Possible outcomes 15
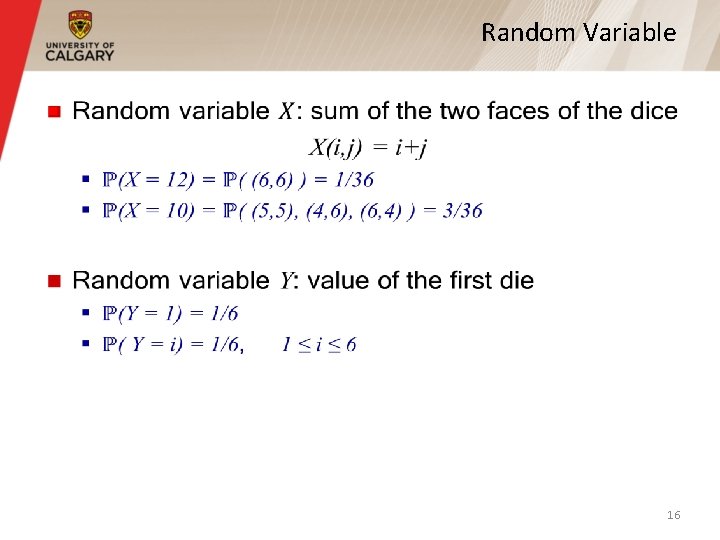
Random Variable § 16
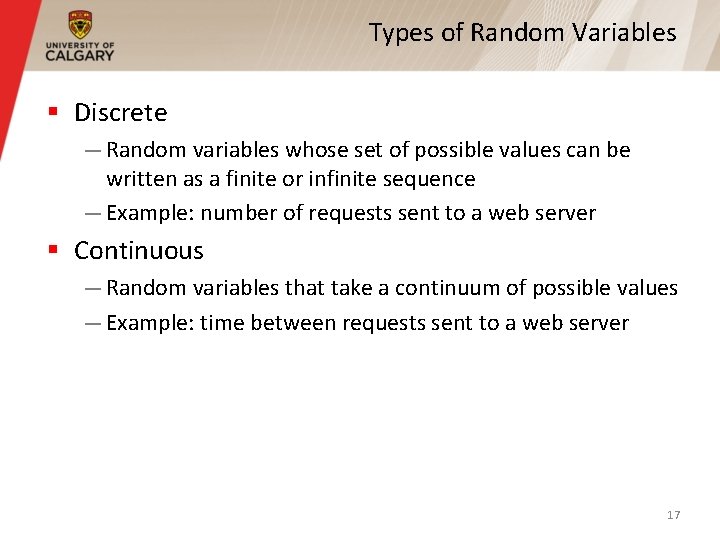
Types of Random Variables § Discrete — Random variables whose set of possible values can be written as a finite or infinite sequence — Example: number of requests sent to a web server § Continuous — Random variables that take a continuum of possible values — Example: time between requests sent to a web server 17
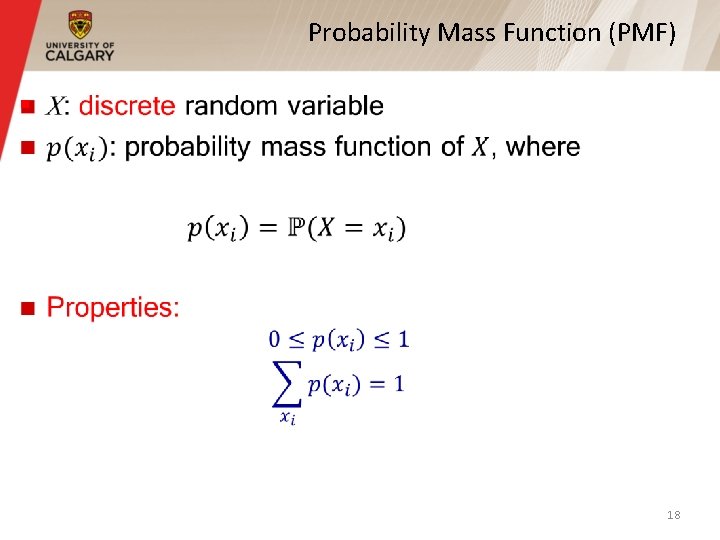
Probability Mass Function (PMF) § 18
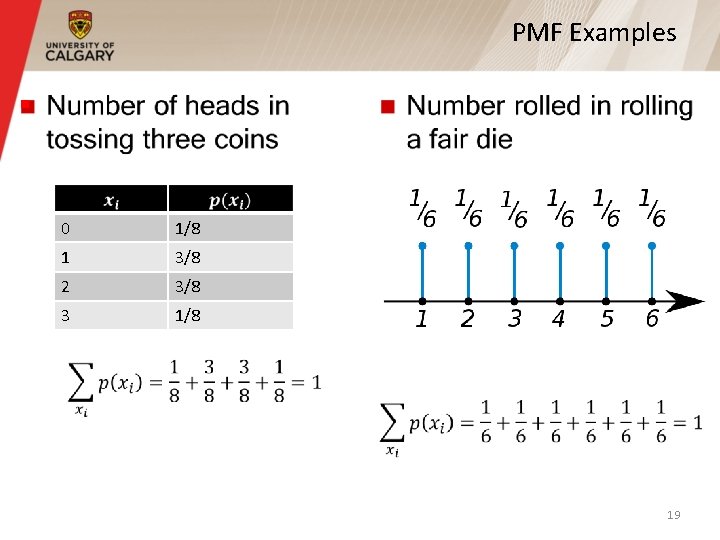
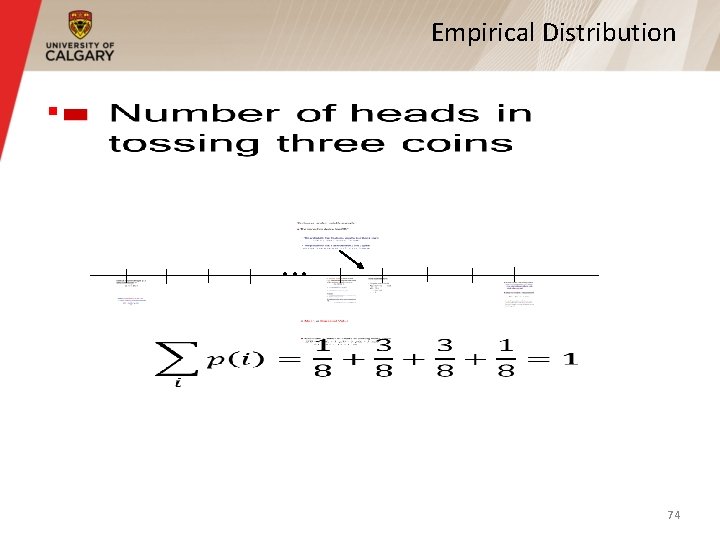
PMF Examples § 0 1/8 1 3/8 2 3/8 3 1/8 19
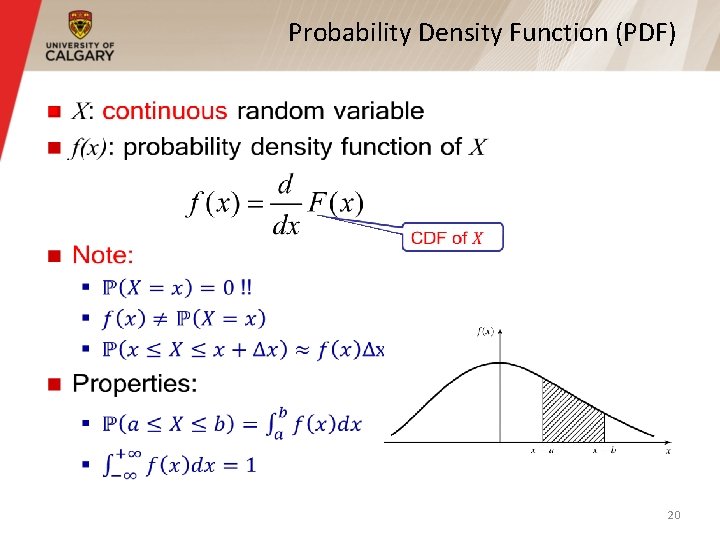
Probability Density Function (PDF) § 20
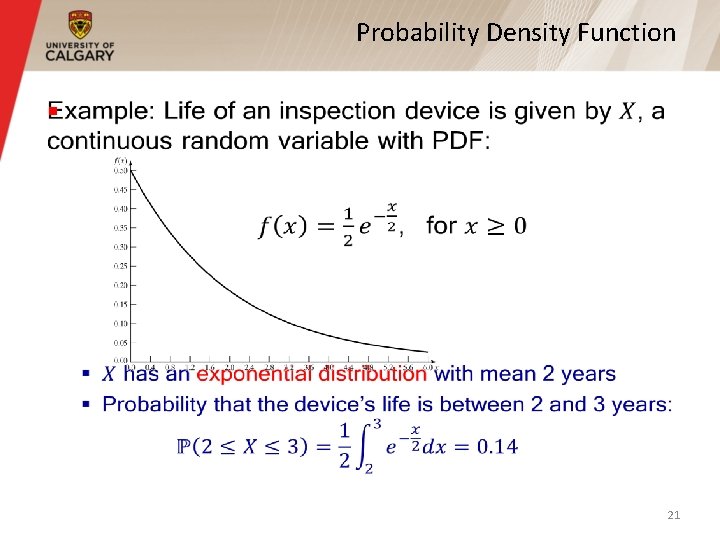
Probability Density Function § 21
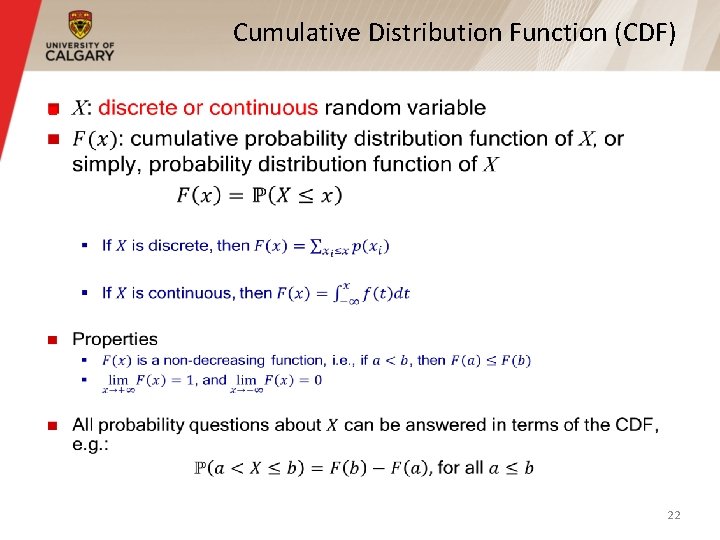
Cumulative Distribution Function (CDF) § 22
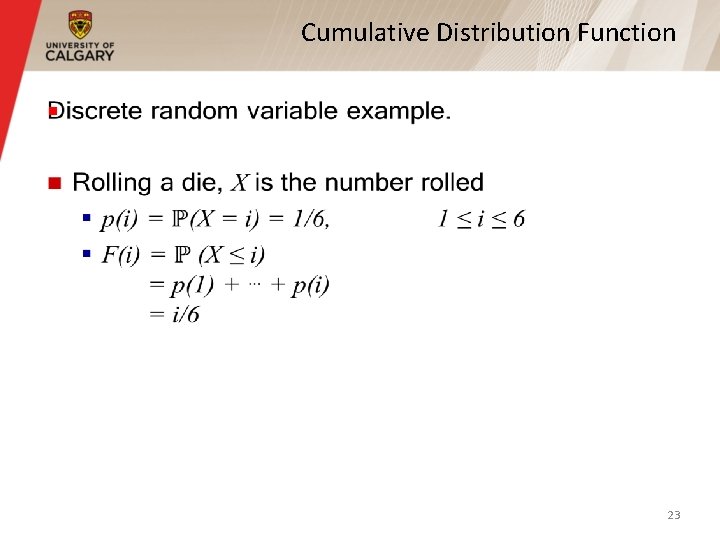
Cumulative Distribution Function § 23
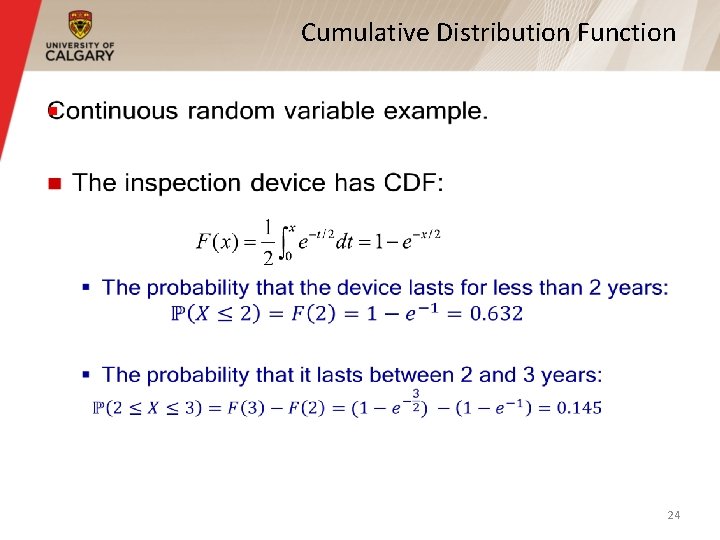
Cumulative Distribution Function § 24
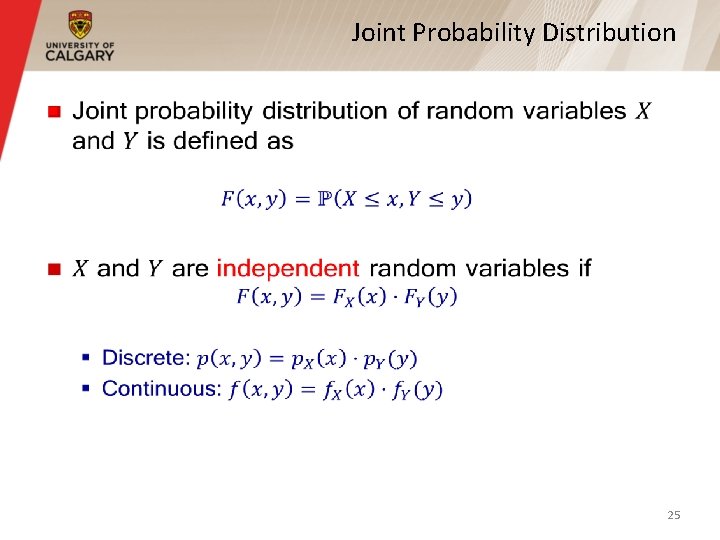
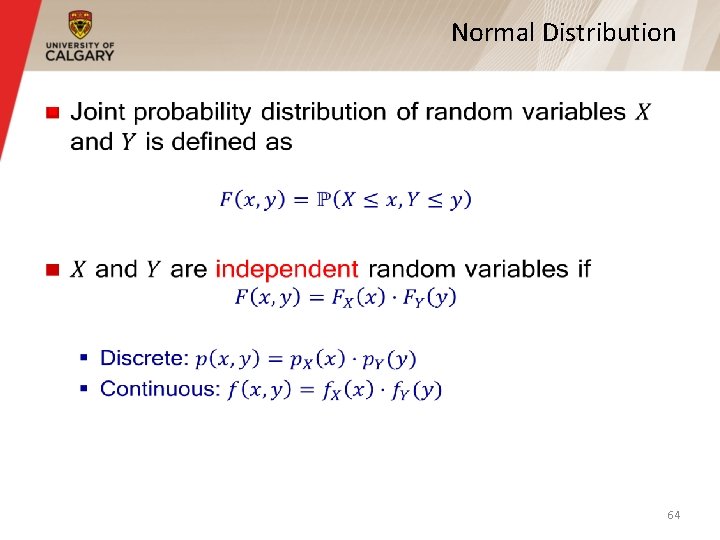
Joint Probability Distribution § 25
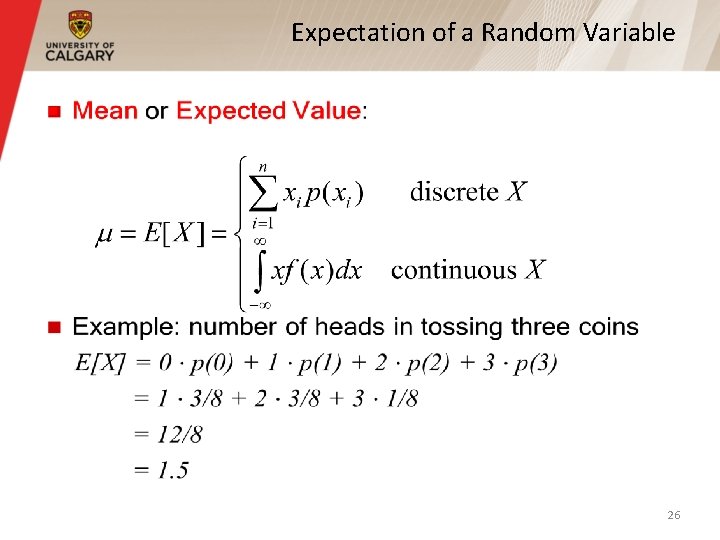
Expectation of a Random Variable § 26
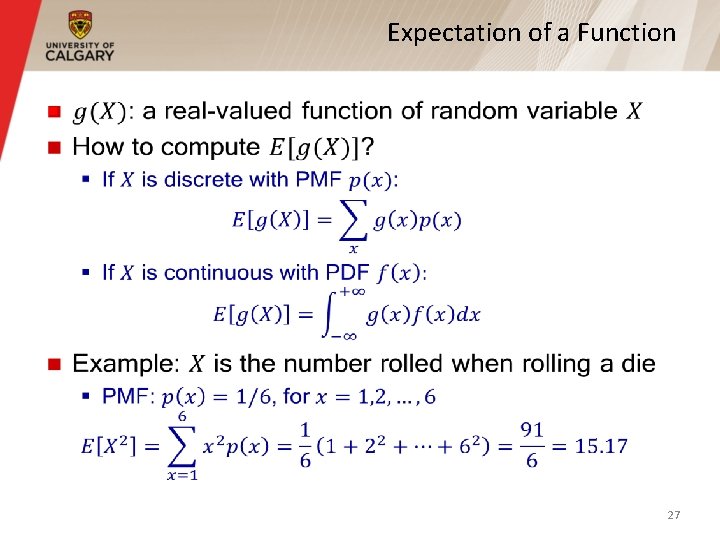
Expectation of a Function § 27
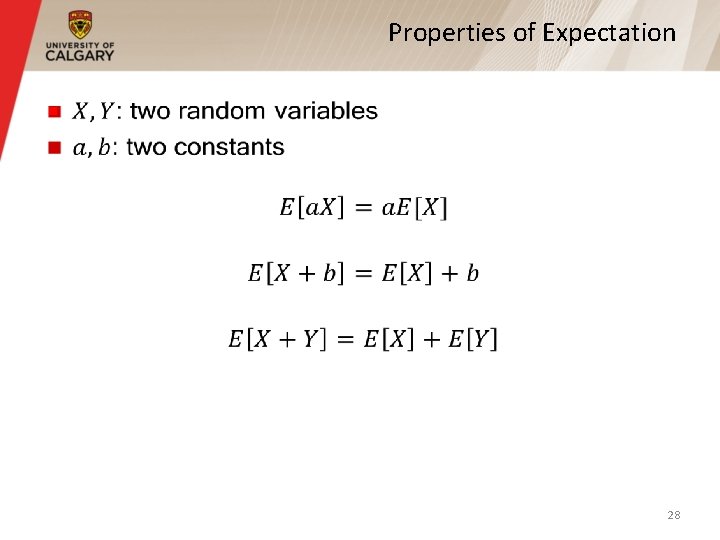
Properties of Expectation § 28
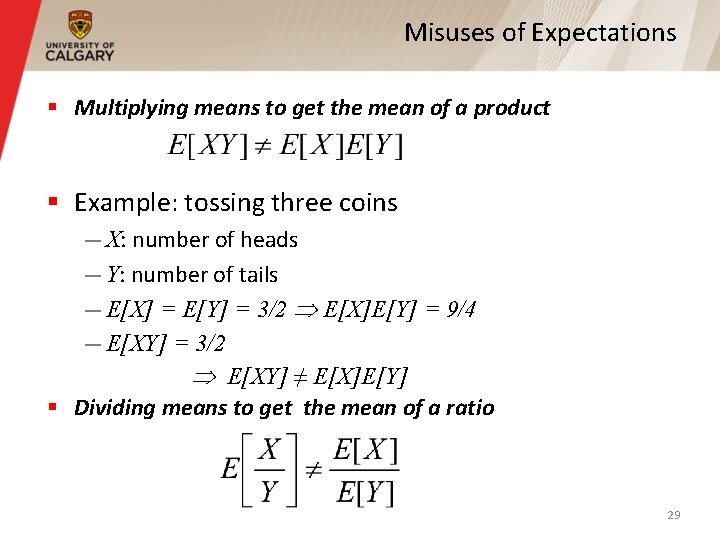
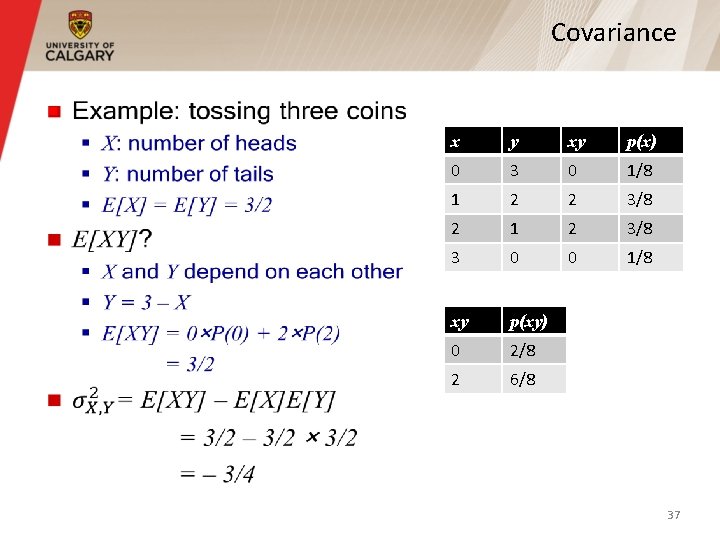
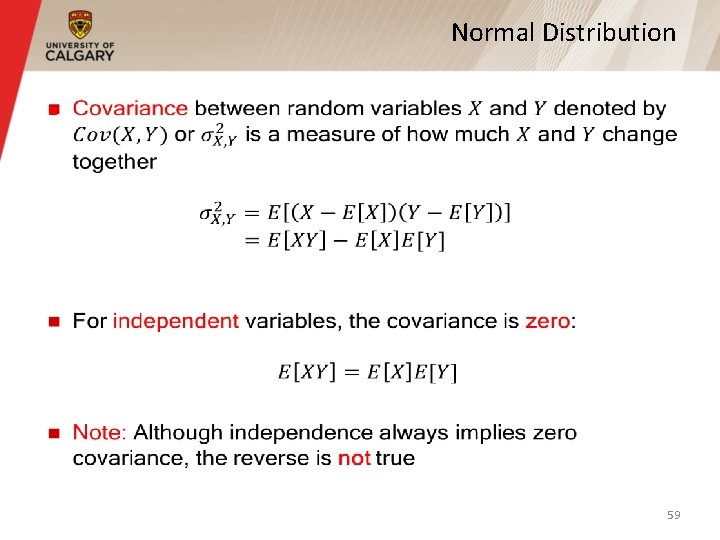
Misuses of Expectations § Multiplying means to get the mean of a product § Example: tossing three coins — X: number of heads — Y: number of tails — E[X] = E[Y] = 3/2 E[X]E[Y] = 9/4 — E[XY] = 3/2 E[XY] ≠ E[X]E[Y] § Dividing means to get the mean of a ratio 29
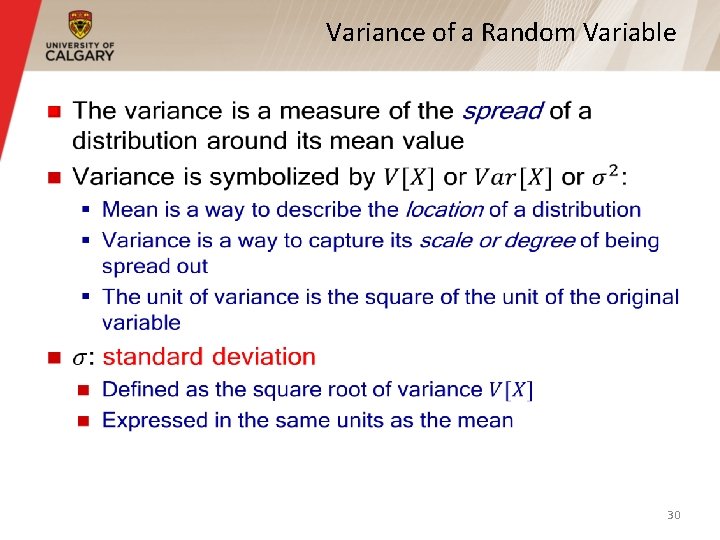
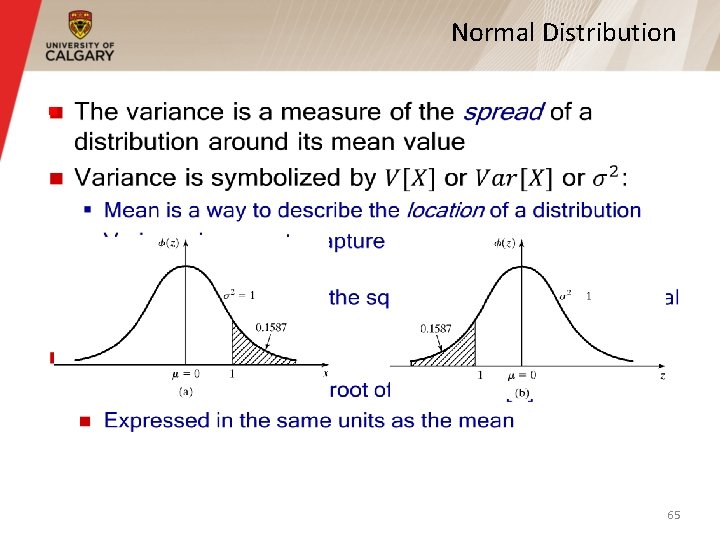
Variance of a Random Variable § 30
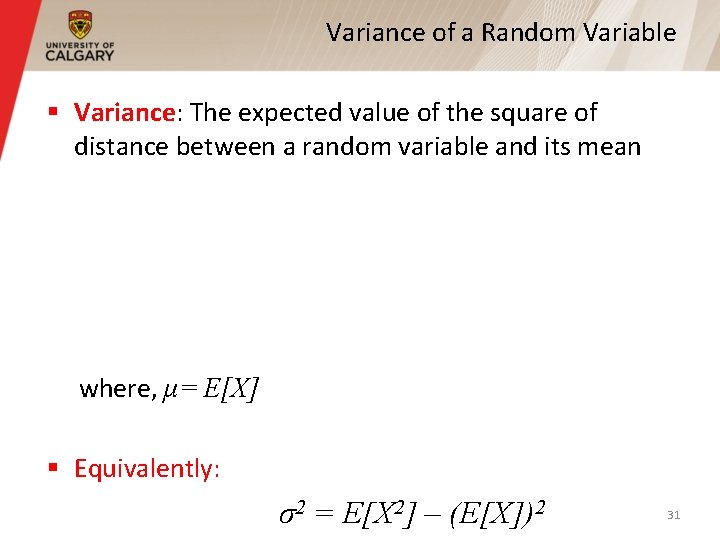
Variance of a Random Variable § Variance: The expected value of the square of distance between a random variable and its mean where, μ= E[X] § Equivalently: σ2 = E[X 2] – (E[X])2 31
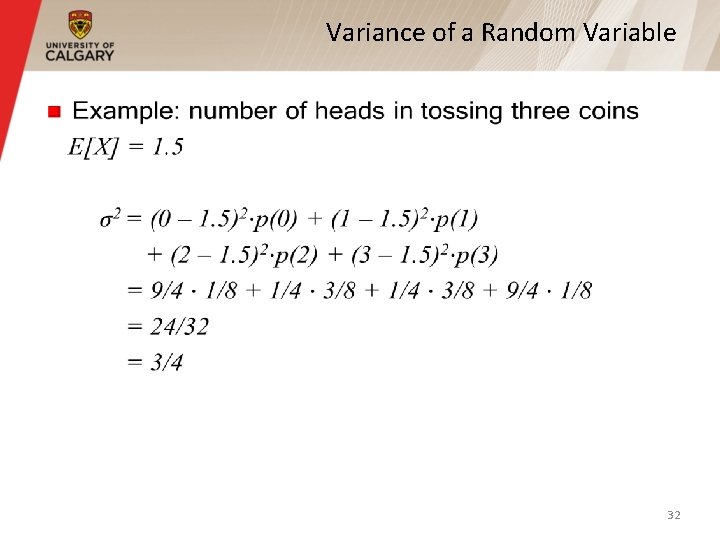
Variance of a Random Variable § 32
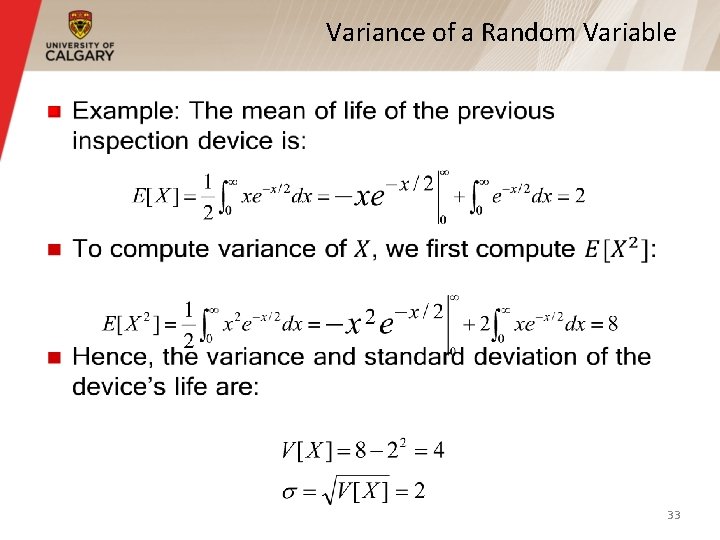
Variance of a Random Variable § 33
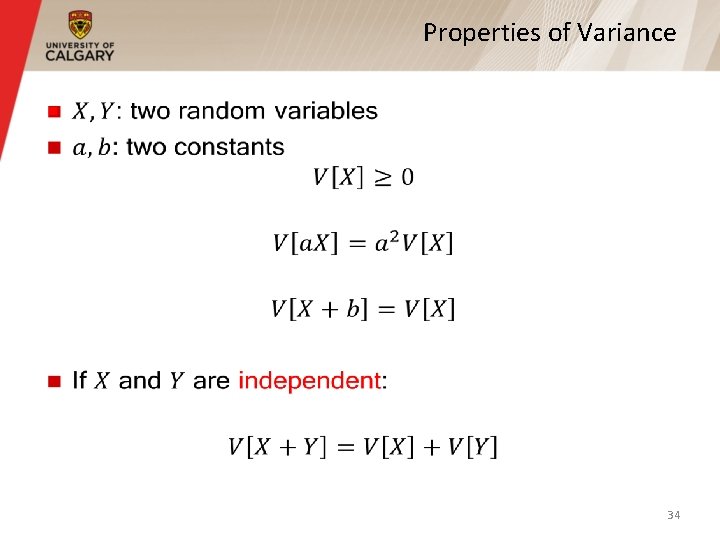
Properties of Variance § 34
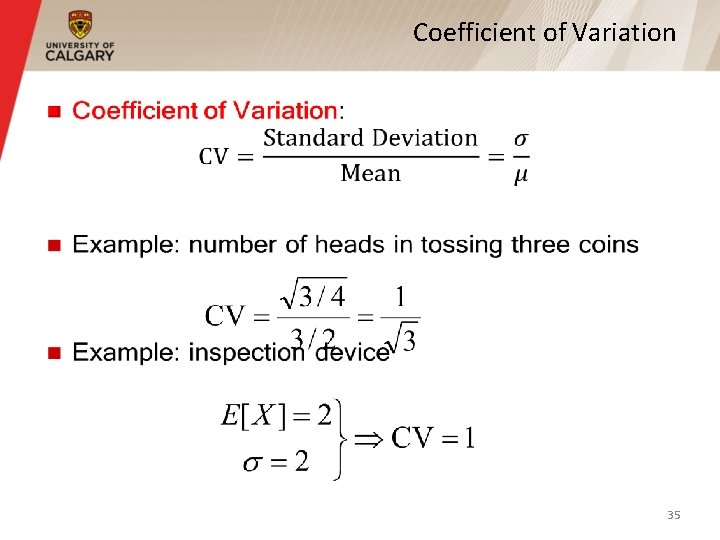
Coefficient of Variation § 35
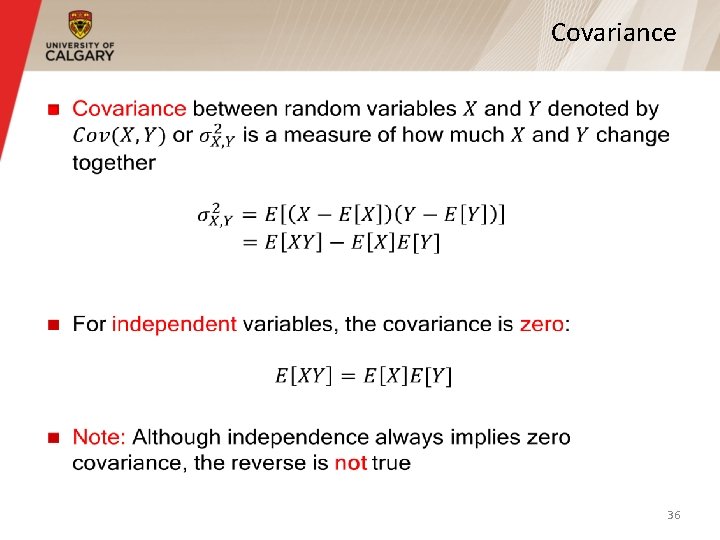
Covariance § 36
Covariance § x y xy p(x) 0 3 0 1/8 1 2 2 3/8 2 1 2 3/8 3 0 0 1/8 xy p(xy) 0 2/8 2 6/8 37
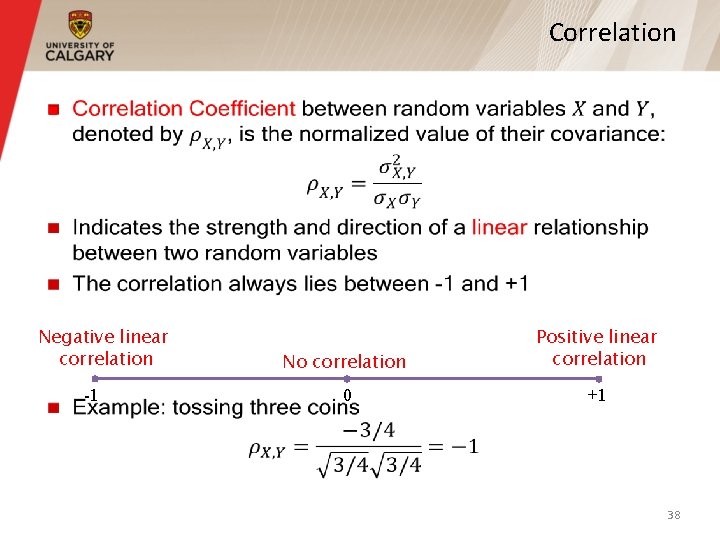
Correlation § Negative linear correlation -1 No correlation Positive linear correlation 0 +1 38
Outline § Probability and random variables — Random experiment and random variable — Probability mass/density functions — Expectation, variance, correlation § Probability distributions — Discrete probability distributions — Continuous probability distributions — Empirical probability distribution 39
Outline § Probability and random variables — Random experiment and random variable — Probability mass/density functions — Expectation, variance, correlation § Probability distributions — Discrete probability distributions — Continuous probability distributions — Empirical probability distribution 40
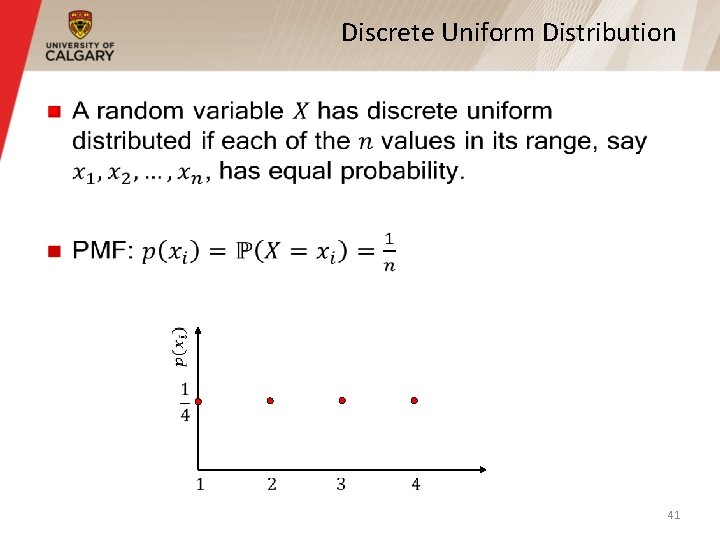
Discrete Uniform Distribution § 41
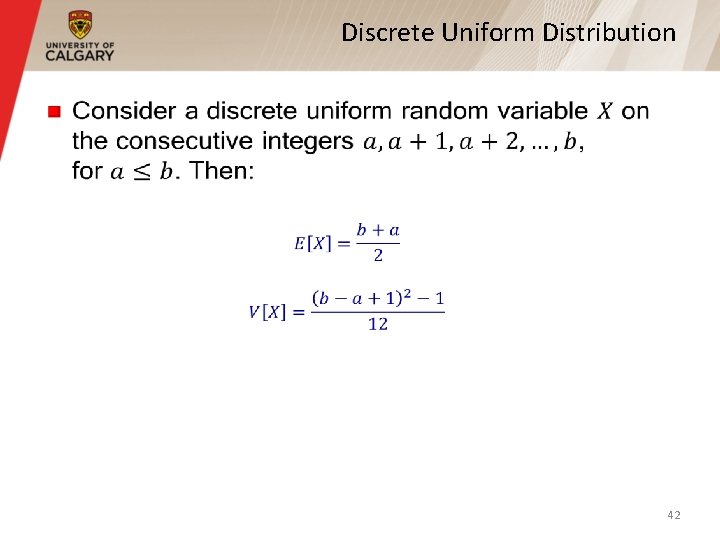
Discrete Uniform Distribution § 42
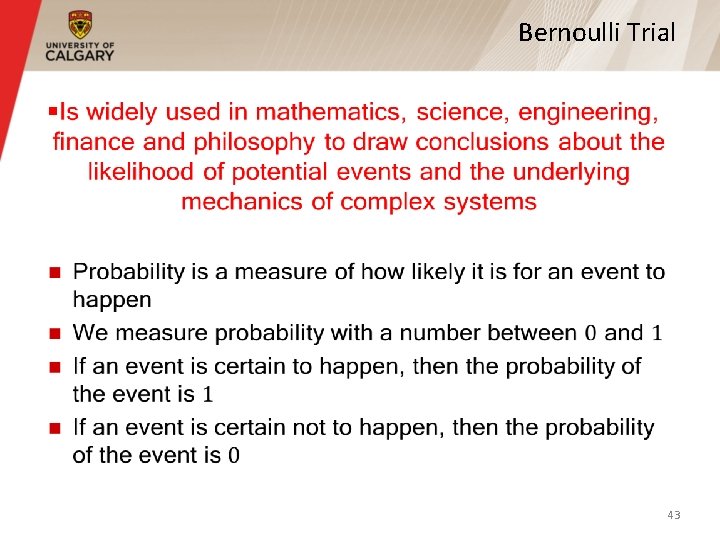
Bernoulli Trial § 43
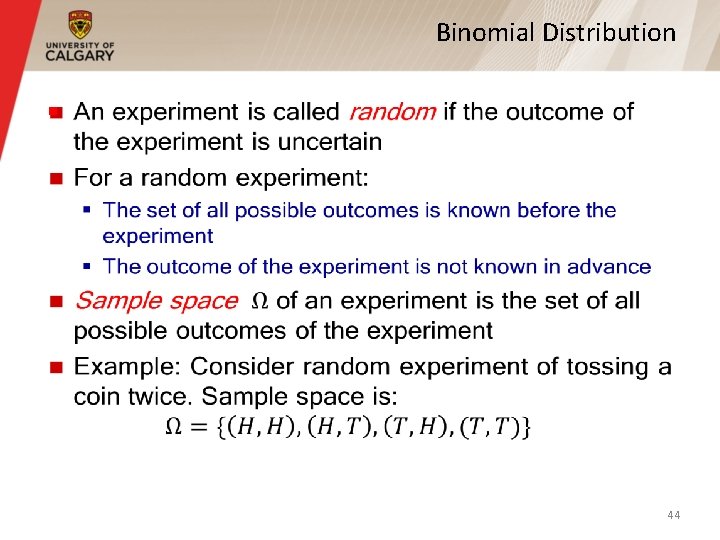
Binomial Distribution § 44
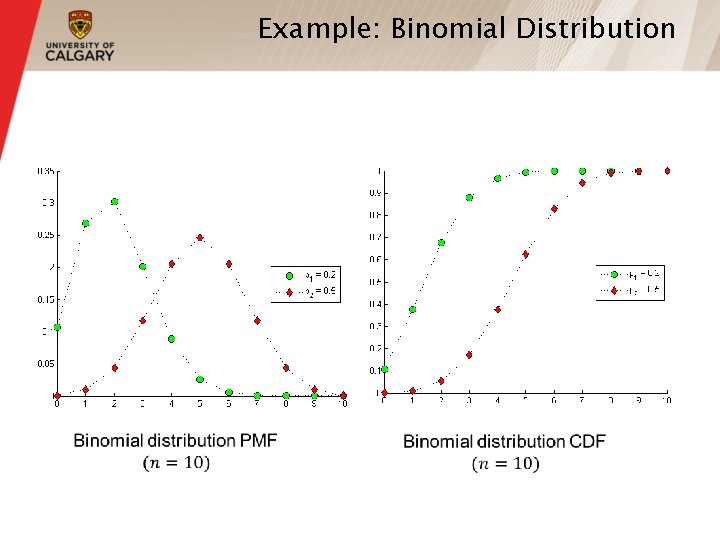
Example: Binomial Distribution
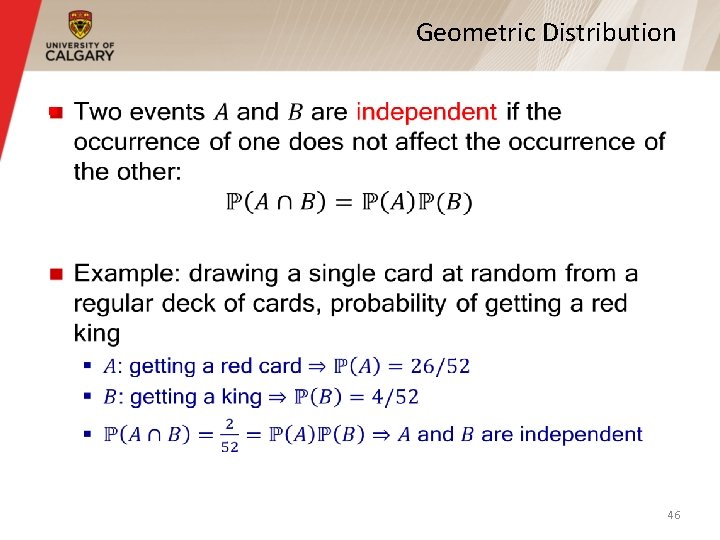
Geometric Distribution § 46
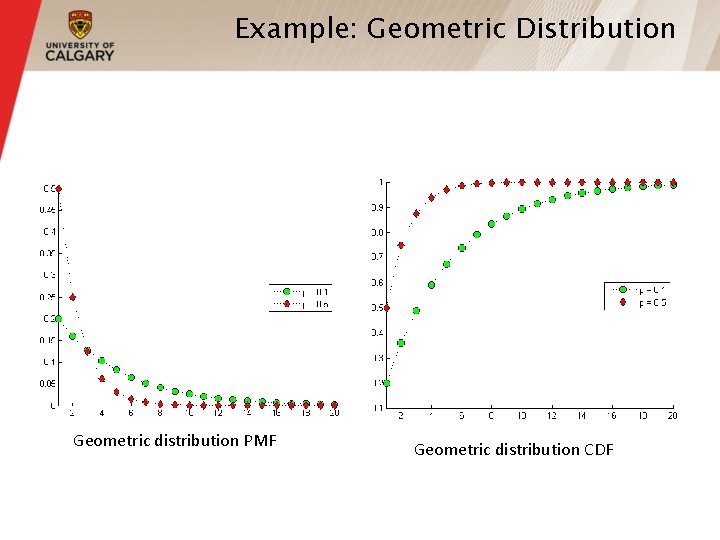
Example: Geometric Distribution Geometric distribution PMF Geometric distribution CDF
Poisson Distribution § Number of events occurring in a fixed time interval — Events occur with a known rate and are independent § Poisson distribution is characterized by the rate — Rate: the average number of event occurrences in a fixed time interval § Examples — The number of calls received by a switchboard per minute — The number of packets coming to a router per second — The number of travelers arriving to the airport for flight registration per hour 48
Poisson Distribution § 49
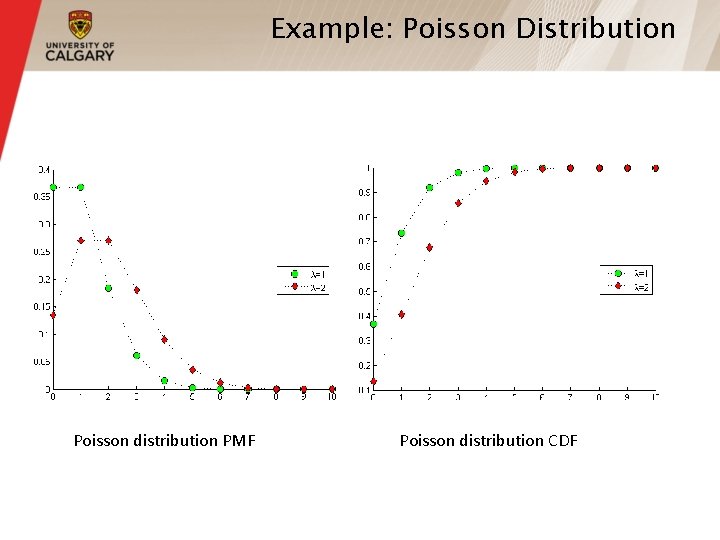
Example: Poisson Distribution Poisson distribution PMF Poisson distribution CDF
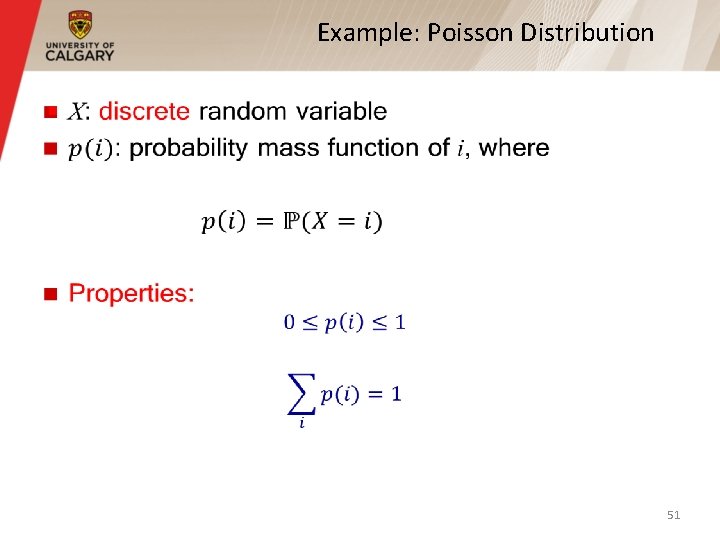
Example: Poisson Distribution § 51
Outline § Probability and random variables — Random experiment and random variable — Probability mass/density functions — Expectation, variance, correlation § Probability distributions — Discrete probability distributions — Continuous probability distributions — Empirical probability distribution 52
Uniform Distribution § PDF CDF 53
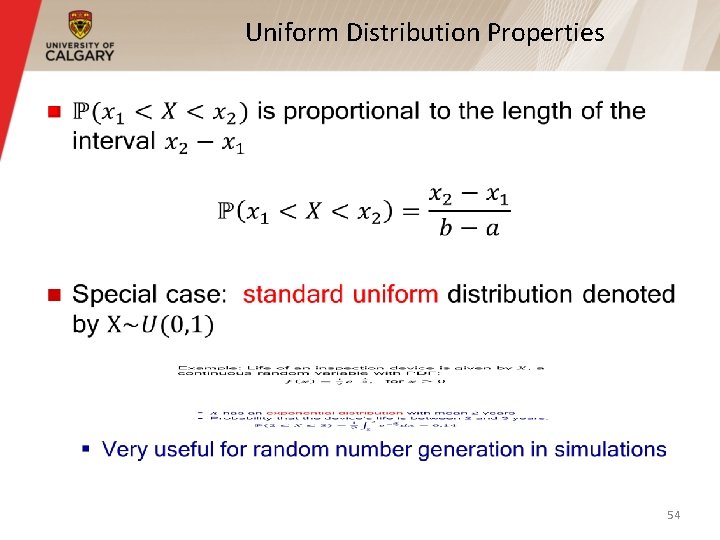
Uniform Distribution Properties § 54
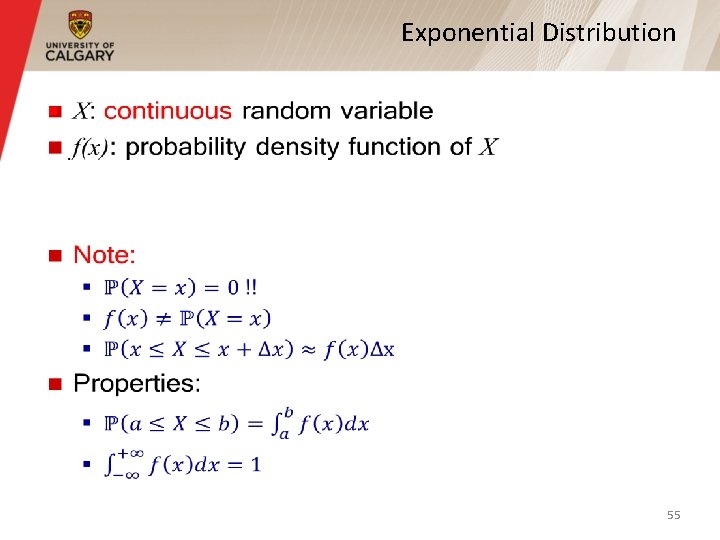
Exponential Distribution § 55
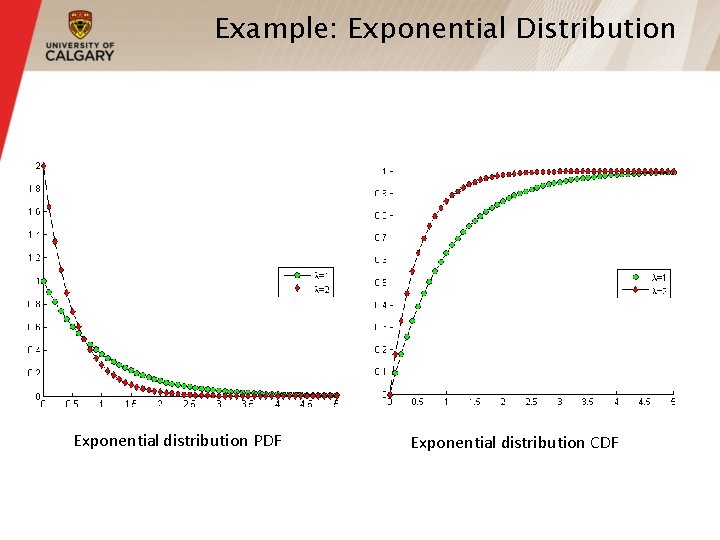
Example: Exponential Distribution Exponential distribution PDF Exponential distribution CDF
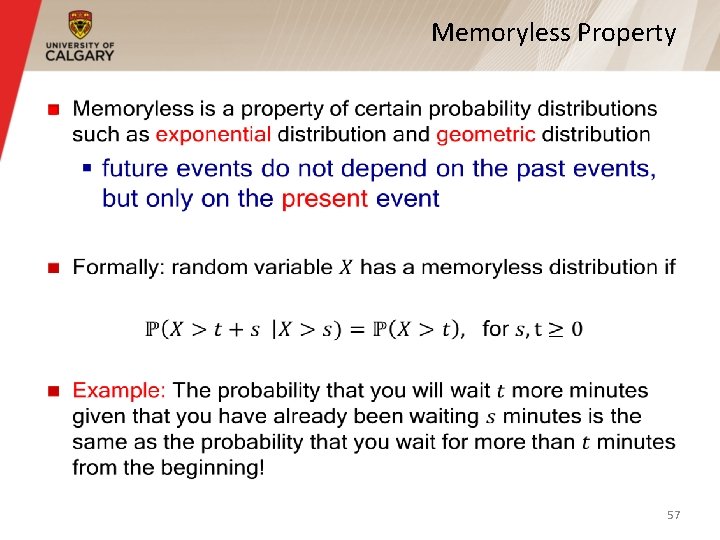
Memoryless Property § 57
Example: Exponential Distribution § 58
Normal Distribution § 59
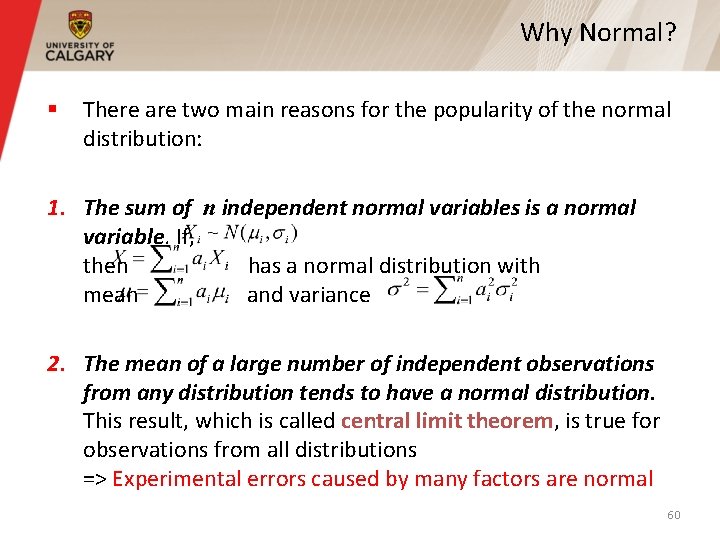
Why Normal? § There are two main reasons for the popularity of the normal distribution: 1. The sum of n independent normal variables is a normal variable. If, then has a normal distribution with mean and variance 2. The mean of a large number of independent observations from any distribution tends to have a normal distribution. This result, which is called central limit theorem, is true for observations from all distributions => Experimental errors caused by many factors are normal 60
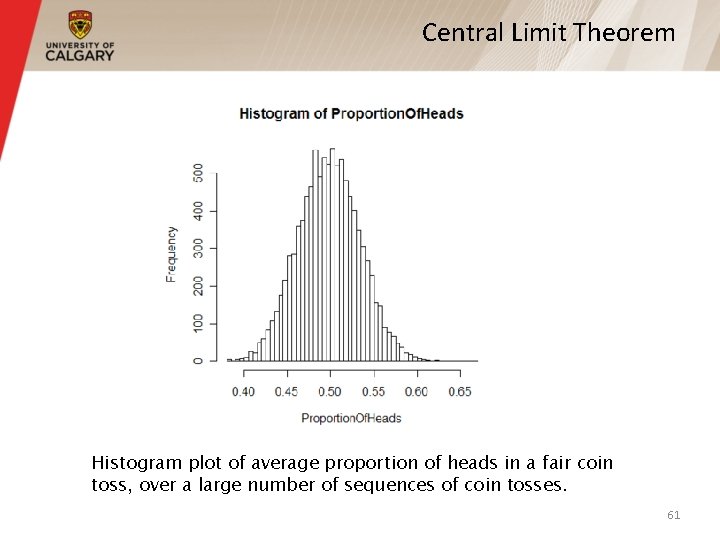
Central Limit Theorem Histogram plot of average proportion of heads in a fair coin toss, over a large number of sequences of coin tosses. 61
Normal Distribution § 62
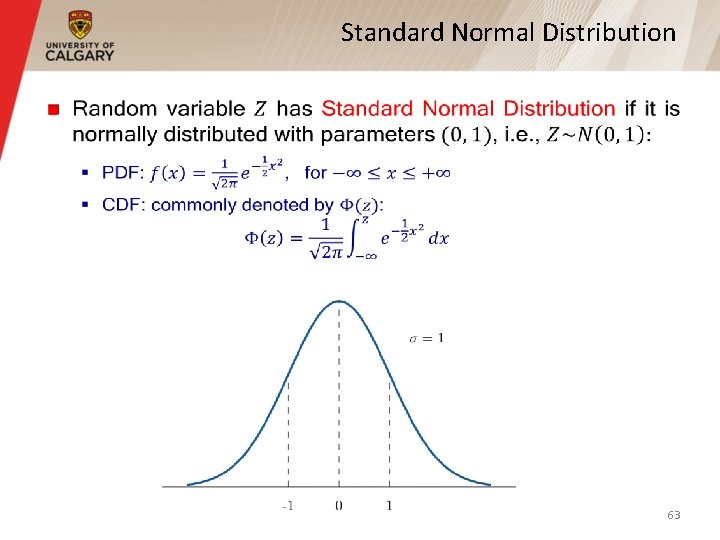
Standard Normal Distribution § 63
Normal Distribution § 64
Normal Distribution § 65
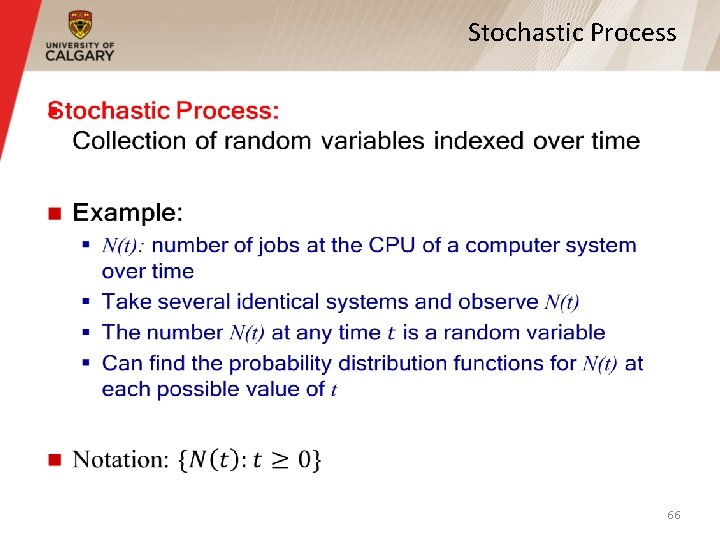
Stochastic Process § 66
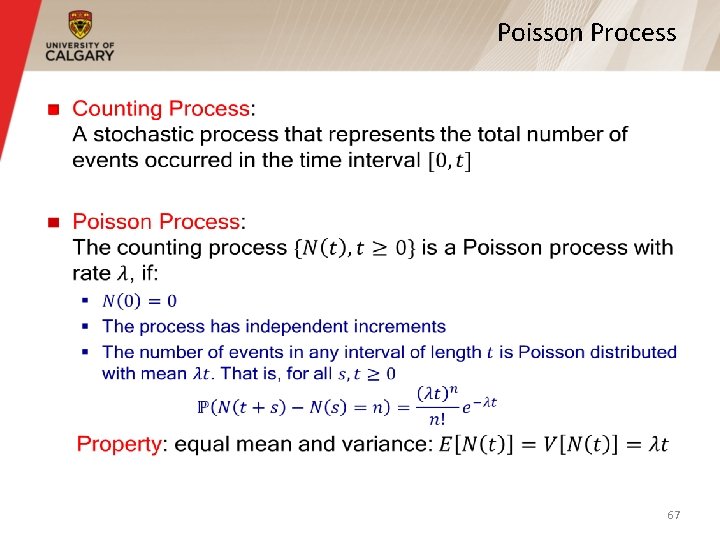
Poisson Process § 67
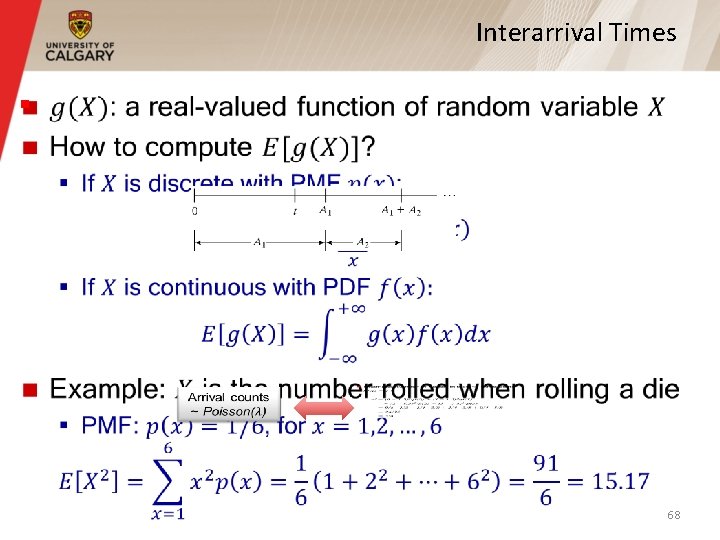
Interarrival Times § 68
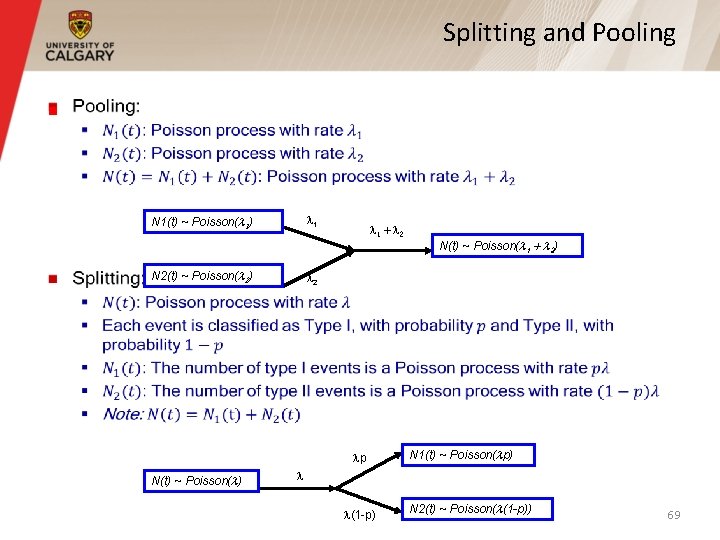
Splitting and Pooling § 1 N 1(t) ~ Poisson(l 1) N 2(t) ~ Poisson(l 2) 1 + 2 2 p N(t) ~ Poisson(l) N(t) ~ Poisson(l 1 + l 2) N 1(t) ~ Poisson(lp) (1 -p) N 2(t) ~ Poisson(l(1 -p)) 69
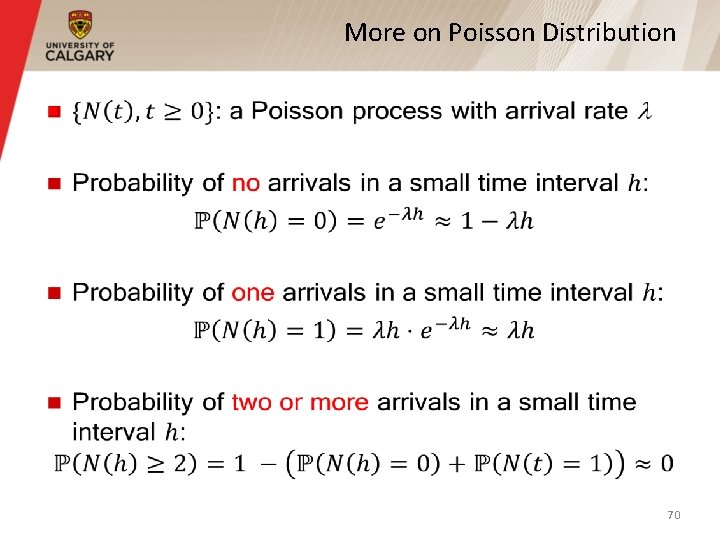
More on Poisson Distribution § 70
Outline § Probability and random variables — Random experiment and random variable — Probability mass/density functions — Expectation, variance, correlation § Probability distributions — Discrete probability distributions — Continuous probability distributions — Empirical probability distribution 71
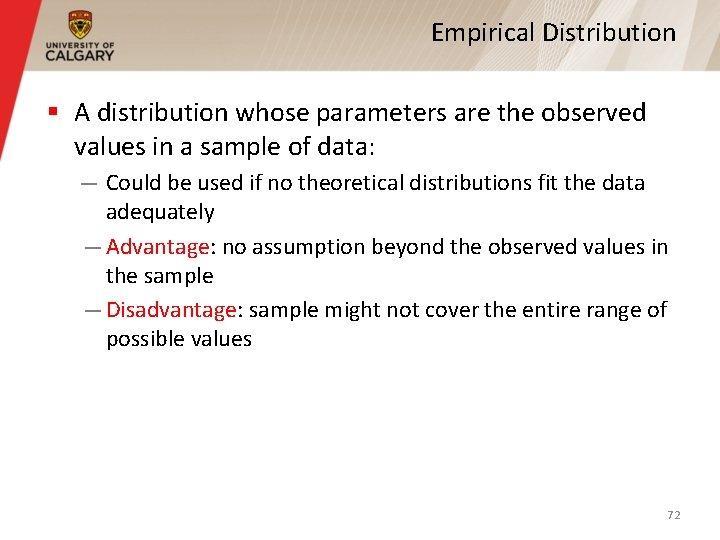
Empirical Distribution § A distribution whose parameters are the observed values in a sample of data: — Could be used if no theoretical distributions fit the data adequately — Advantage: no assumption beyond the observed values in the sample — Disadvantage: sample might not cover the entire range of possible values 72
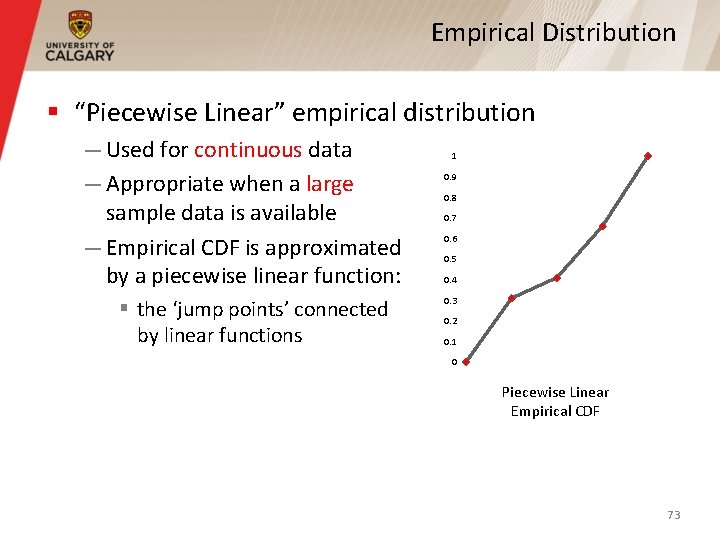
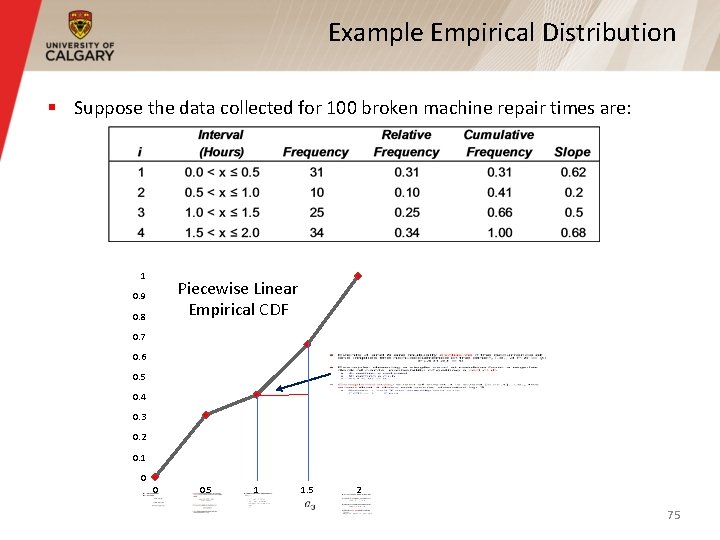
Empirical Distribution § “Piecewise Linear” empirical distribution — Used for continuous data — Appropriate when a large sample data is available — Empirical CDF is approximated by a piecewise linear function: § the ‘jump points’ connected by linear functions 1 0. 9 0. 8 0. 7 0. 6 0. 5 0. 4 0. 3 0. 2 0. 1 0 Piecewise Linear Empirical CDF 73
Empirical Distribution § • • • 74
Example Empirical Distribution § Suppose the data collected for 100 broken machine repair times are: 1 Piecewise Linear Empirical CDF 0. 9 0. 8 0. 7 0. 6 0. 5 0. 4 0. 3 0. 2 0. 1 0 0 0. 5 1 1. 5 2 75