
CPE 619 Simple Linear Regression Models Aleksandar Milenkovi
- Slides: 48
CPE 619 Simple Linear Regression Models Aleksandar Milenković The La. CASA Laboratory Electrical and Computer Engineering Department The University of Alabama in Huntsville http: //www. ece. uah. edu/~milenka http: //www. ece. uah. edu/~lacasa
Overview n n n n Definition of a Good Model Estimation of Model Parameters Allocation of Variation Standard Deviation of Errors Confidence Intervals for Regression Parameters Confidence Intervals for Predictions Visual Tests for Verifying Regression Assumption 2
Regression n n Expensive (and sometimes impossible) to measure performance across all possible input values Instead, measure performance for limited inputs and use it to produce model over range of input values n Build regression model 3
Simple Linear Regression Models n n n Regression Model: Predict a response for a given set of predictor variables Response Variable: Estimated variable Predictor Variables: Variables used to predict the response Linear Regression Models: Response is a linear function of predictors Simple Linear Regression Models: Only one predictor 4
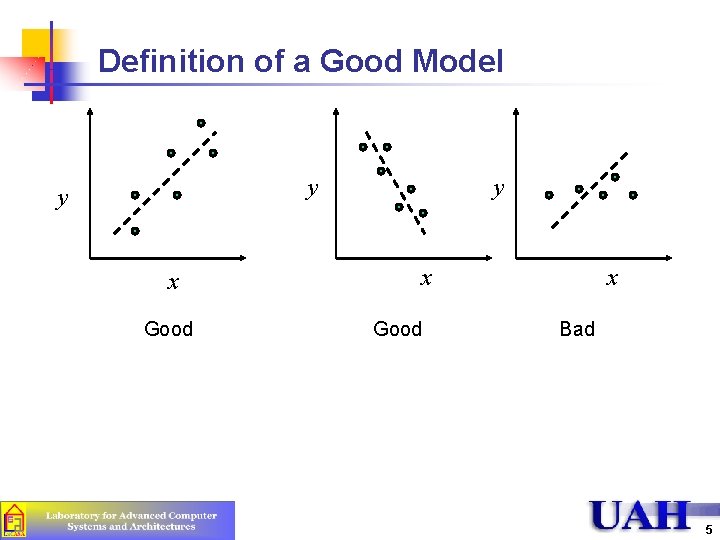
Definition of a Good Model y y x Good x Bad 5
Good Model (cont’d) n n n Regression models attempt to minimize the distance measured vertically between the observation point and the model line (or curve) The length of the line segment is called residual, modeling error, or simply error The negative and positive errors should cancel out Zero overall error Many lines will satisfy this criterion 6
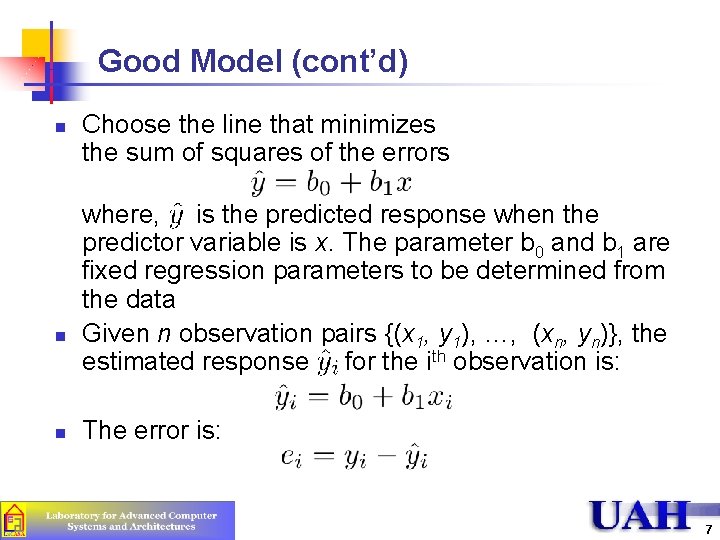
Good Model (cont’d) n n n Choose the line that minimizes the sum of squares of the errors where, is the predicted response when the predictor variable is x. The parameter b 0 and b 1 are fixed regression parameters to be determined from the data Given n observation pairs {(x 1, y 1), …, (xn, yn)}, the estimated response for the ith observation is: The error is: 7
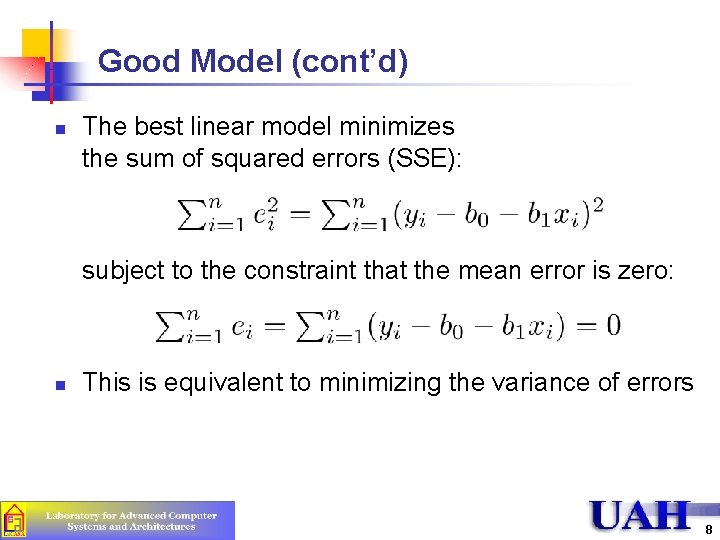
Good Model (cont’d) n The best linear model minimizes the sum of squared errors (SSE): subject to the constraint that the mean error is zero: n This is equivalent to minimizing the variance of errors 8
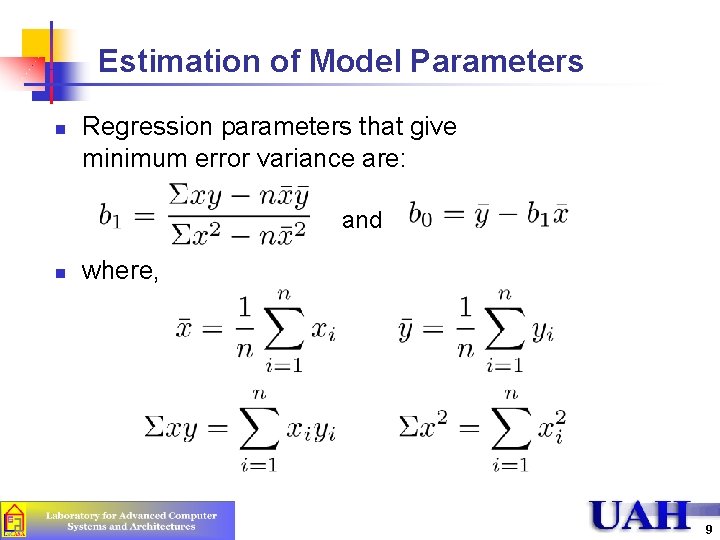
Estimation of Model Parameters n Regression parameters that give minimum error variance are: and n where, 9
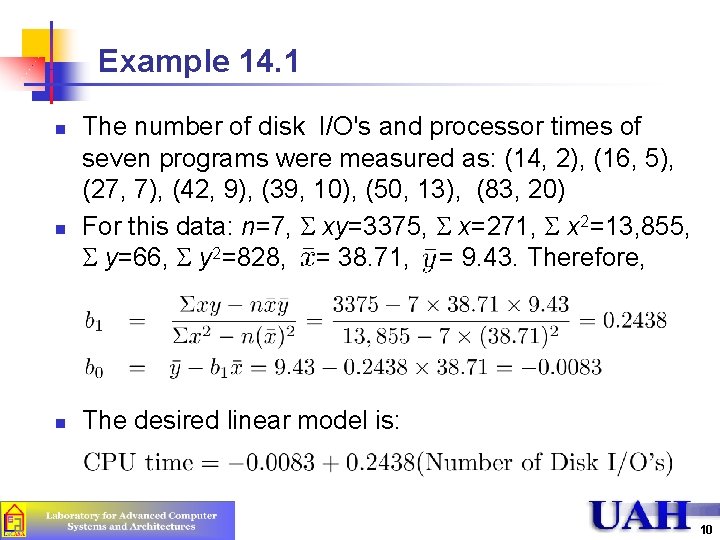
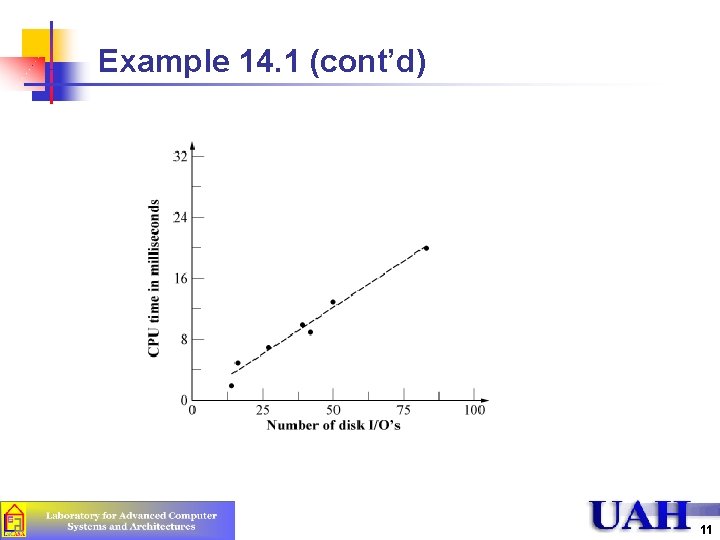
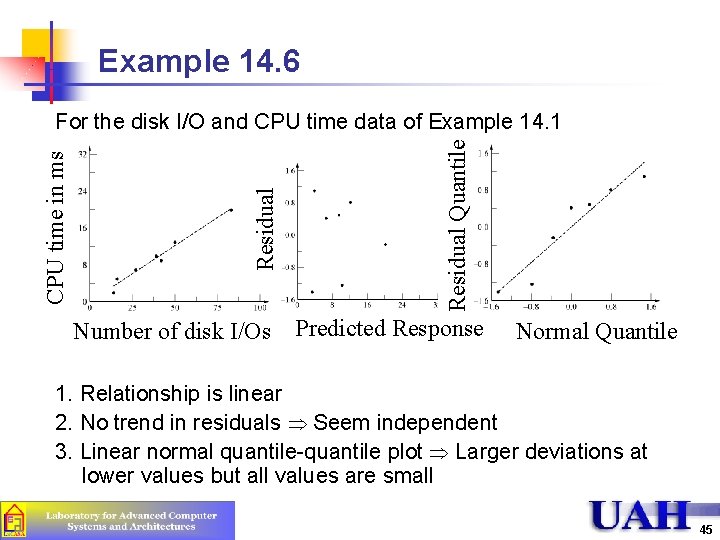
Example 14. 1 n n n The number of disk I/O's and processor times of seven programs were measured as: (14, 2), (16, 5), (27, 7), (42, 9), (39, 10), (50, 13), (83, 20) For this data: n=7, S xy=3375, S x=271, S x 2=13, 855, S y=66, S y 2=828, = 38. 71, = 9. 43. Therefore, The desired linear model is: 10
Example 14. 1 (cont’d) 11
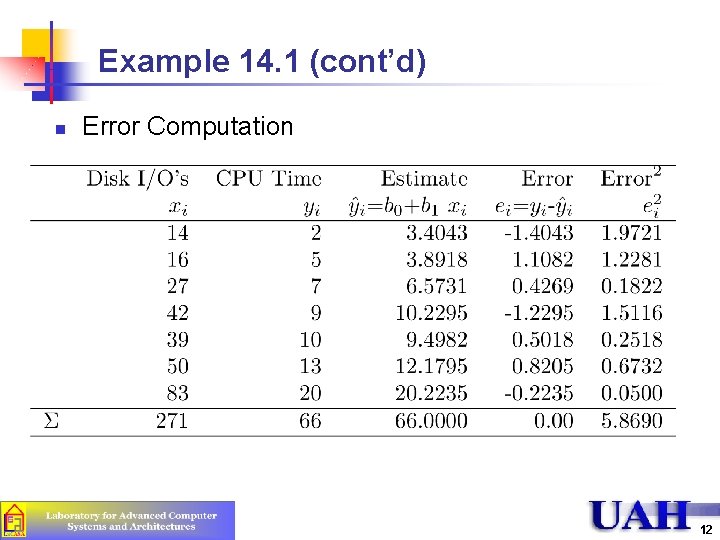
Example 14. 1 (cont’d) n Error Computation 12
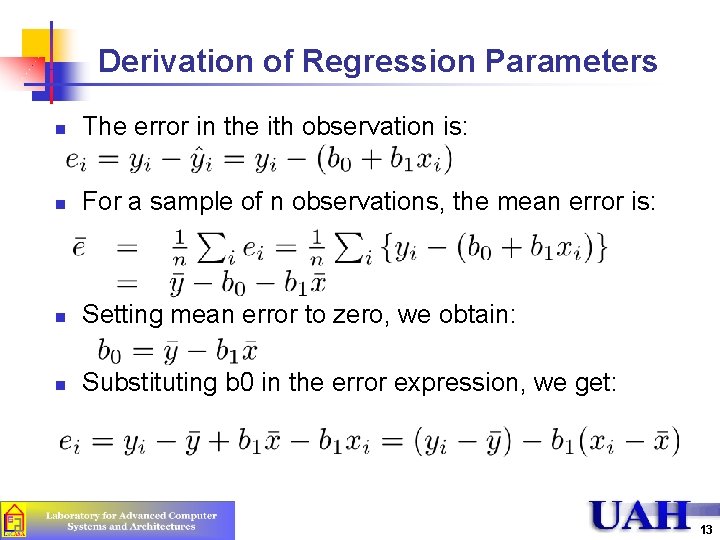
Derivation of Regression Parameters n The error in the ith observation is: n For a sample of n observations, the mean error is: n Setting mean error to zero, we obtain: n Substituting b 0 in the error expression, we get: 13
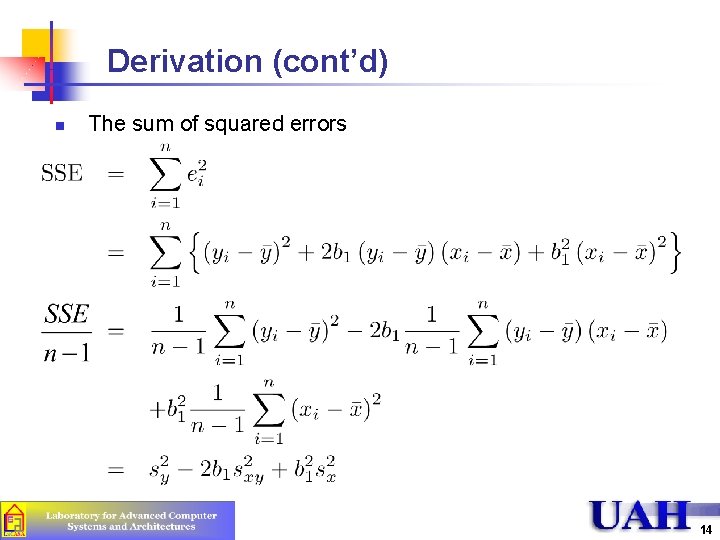
Derivation (cont’d) n The sum of squared errors SSE is: 14
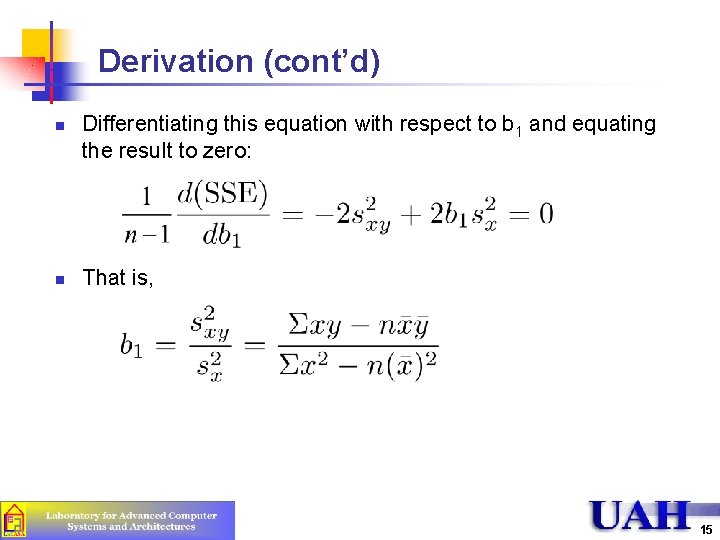
Derivation (cont’d) n n Differentiating this equation with respect to b 1 and equating the result to zero: That is, 15
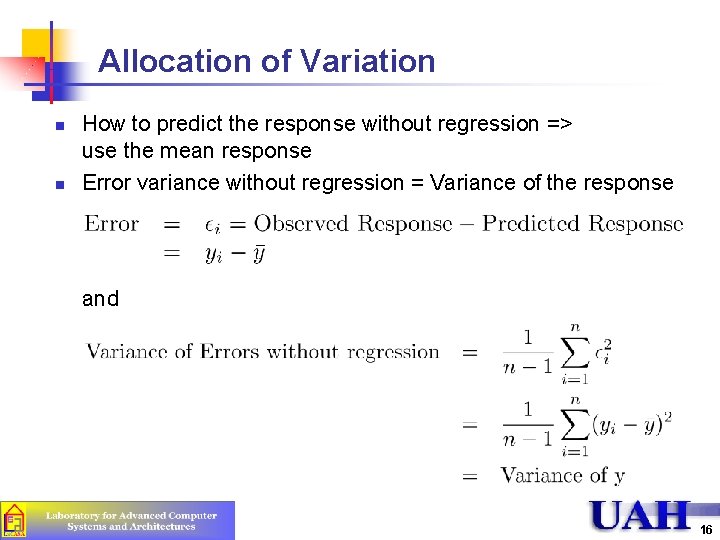
Allocation of Variation n n How to predict the response without regression => use the mean response Error variance without regression = Variance of the response and 16
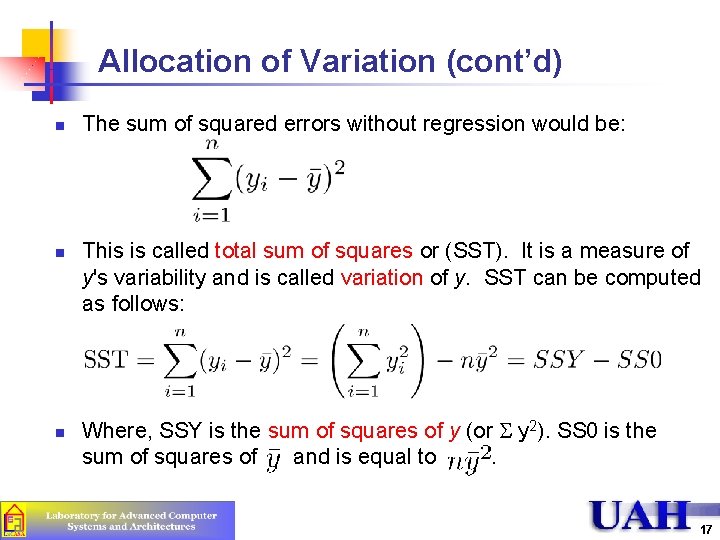
Allocation of Variation (cont’d) n n n The sum of squared errors without regression would be: This is called total sum of squares or (SST). It is a measure of y's variability and is called variation of y. SST can be computed as follows: Where, SSY is the sum of squares of y (or S y 2). SS 0 is the sum of squares of and is equal to. 17
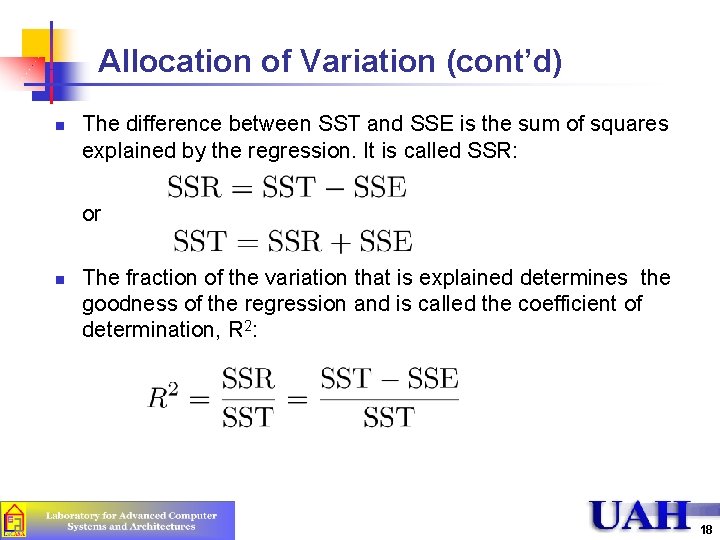
Allocation of Variation (cont’d) n The difference between SST and SSE is the sum of squares explained by the regression. It is called SSR: or n The fraction of the variation that is explained determines the goodness of the regression and is called the coefficient of determination, R 2: 18
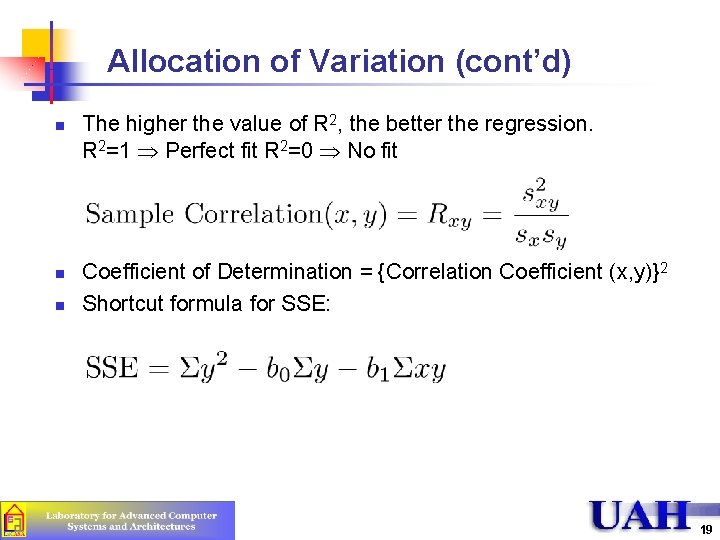
Allocation of Variation (cont’d) n n n The higher the value of R 2, the better the regression. R 2=1 Perfect fit R 2=0 No fit Coefficient of Determination = {Correlation Coefficient (x, y)}2 Shortcut formula for SSE: 19
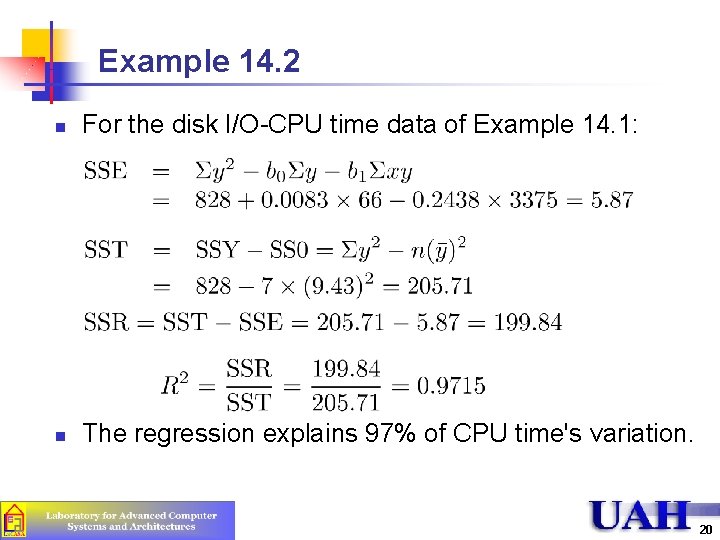
Example 14. 2 n For the disk I/O-CPU time data of Example 14. 1: n The regression explains 97% of CPU time's variation. 20
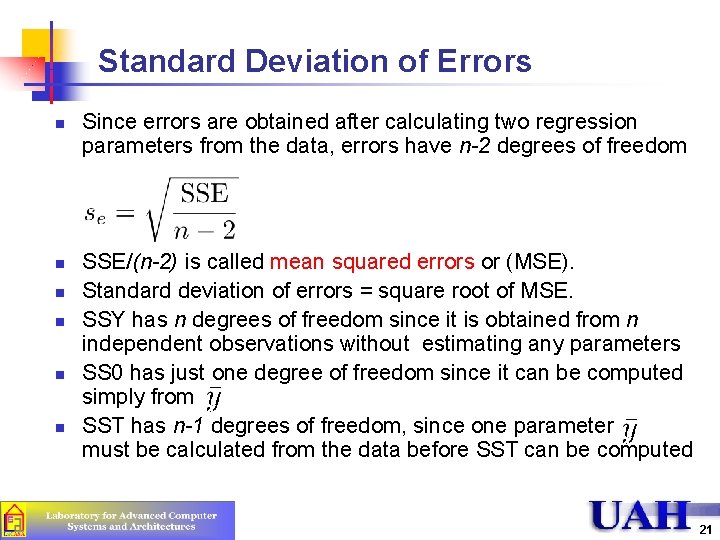
Standard Deviation of Errors n n n Since errors are obtained after calculating two regression parameters from the data, errors have n-2 degrees of freedom SSE/(n-2) is called mean squared errors or (MSE). Standard deviation of errors = square root of MSE. SSY has n degrees of freedom since it is obtained from n independent observations without estimating any parameters SS 0 has just one degree of freedom since it can be computed simply from SST has n-1 degrees of freedom, since one parameter must be calculated from the data before SST can be computed 21
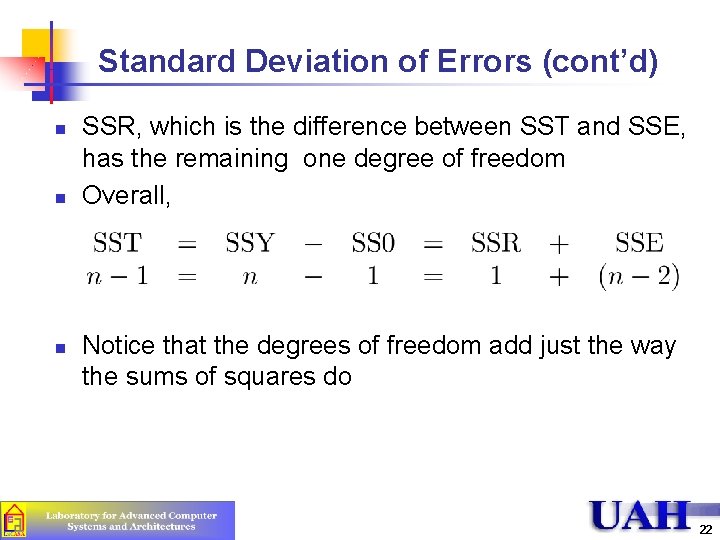
Standard Deviation of Errors (cont’d) n n n SSR, which is the difference between SST and SSE, has the remaining one degree of freedom Overall, Notice that the degrees of freedom add just the way the sums of squares do 22
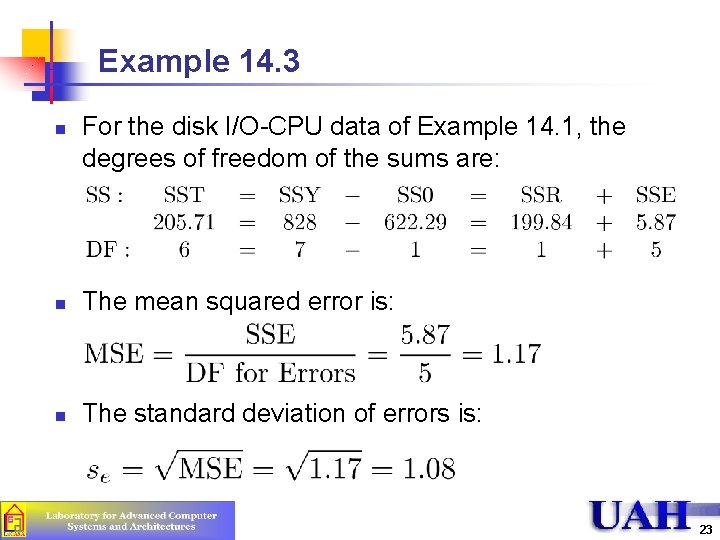
Example 14. 3 n For the disk I/O-CPU data of Example 14. 1, the degrees of freedom of the sums are: n The mean squared error is: n The standard deviation of errors is: 23
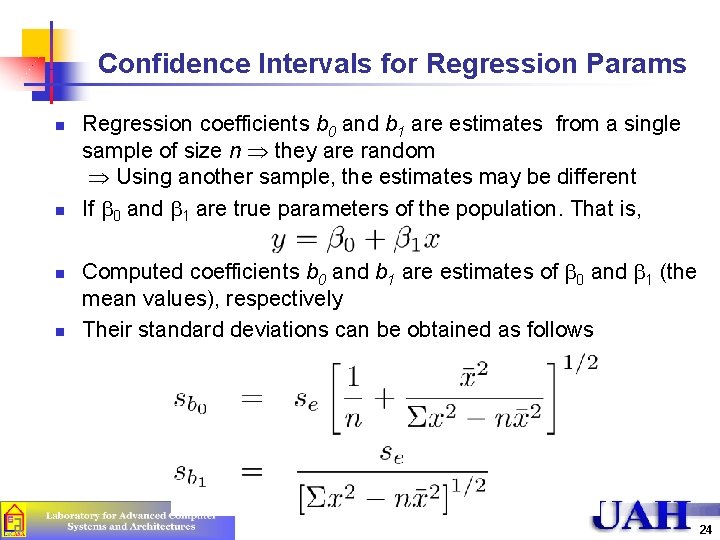
Confidence Intervals for Regression Params n n Regression coefficients b 0 and b 1 are estimates from a single sample of size n they are random Using another sample, the estimates may be different If b 0 and b 1 are true parameters of the population. That is, Computed coefficients b 0 and b 1 are estimates of b 0 and b 1 (the mean values), respectively Their standard deviations can be obtained as follows 24
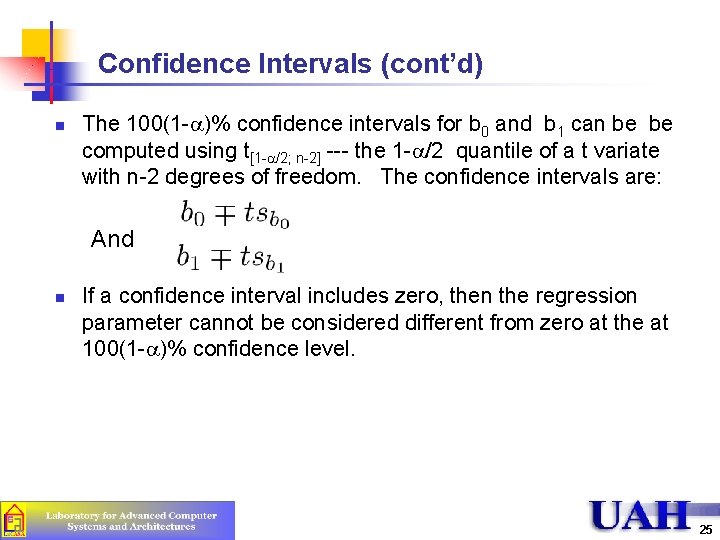
Confidence Intervals (cont’d) n The 100(1 -a)% confidence intervals for b 0 and b 1 can be be computed using t[1 -a/2; n-2] --- the 1 -a/2 quantile of a t variate with n-2 degrees of freedom. The confidence intervals are: And n If a confidence interval includes zero, then the regression parameter cannot be considered different from zero at the at 100(1 -a)% confidence level. 25
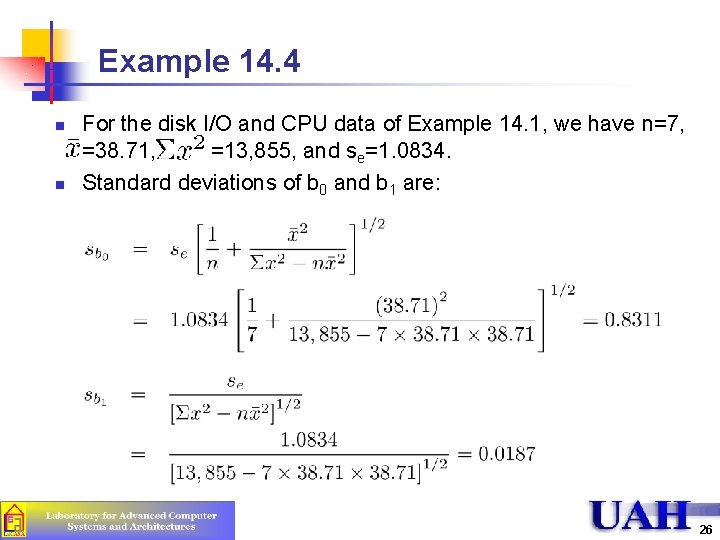
Example 14. 4 n n For the disk I/O and CPU data of Example 14. 1, we have n=7, =38. 71, =13, 855, and se=1. 0834. Standard deviations of b 0 and b 1 are: 26
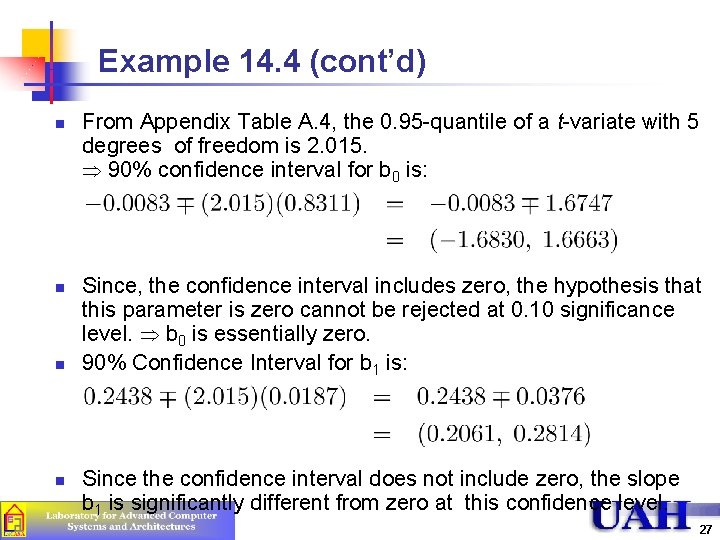
Example 14. 4 (cont’d) n n From Appendix Table A. 4, the 0. 95 -quantile of a t-variate with 5 degrees of freedom is 2. 015. 90% confidence interval for b 0 is: Since, the confidence interval includes zero, the hypothesis that this parameter is zero cannot be rejected at 0. 10 significance level. b 0 is essentially zero. 90% Confidence Interval for b 1 is: Since the confidence interval does not include zero, the slope b 1 is significantly different from zero at this confidence level. 27
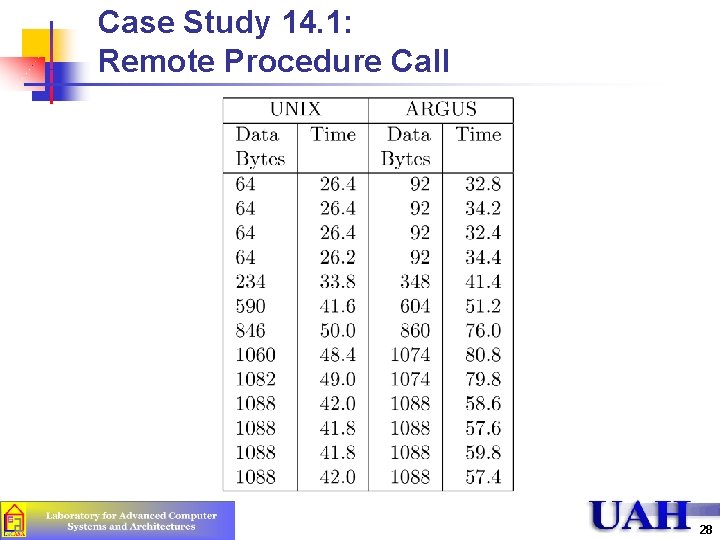
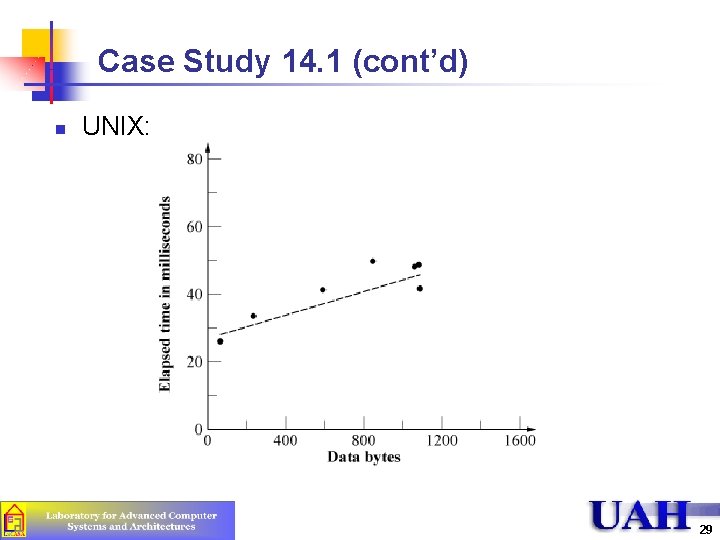
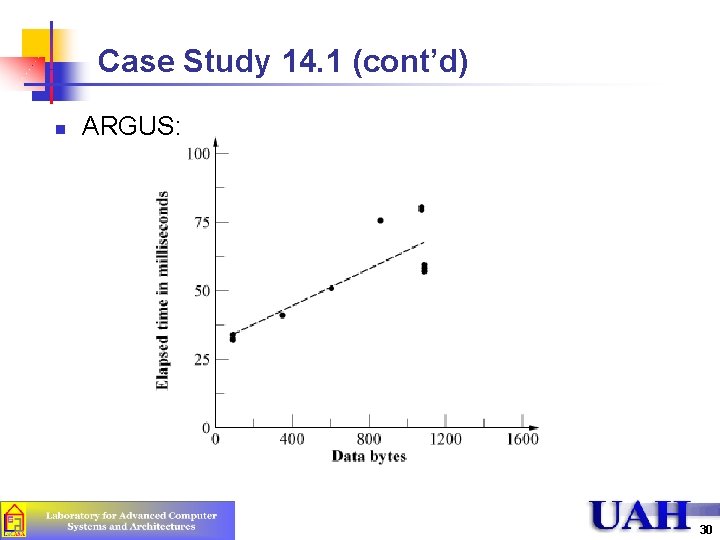
Case Study 14. 1: Remote Procedure Call 28
Case Study 14. 1 (cont’d) n UNIX: 29
Case Study 14. 1 (cont’d) n ARGUS: 30
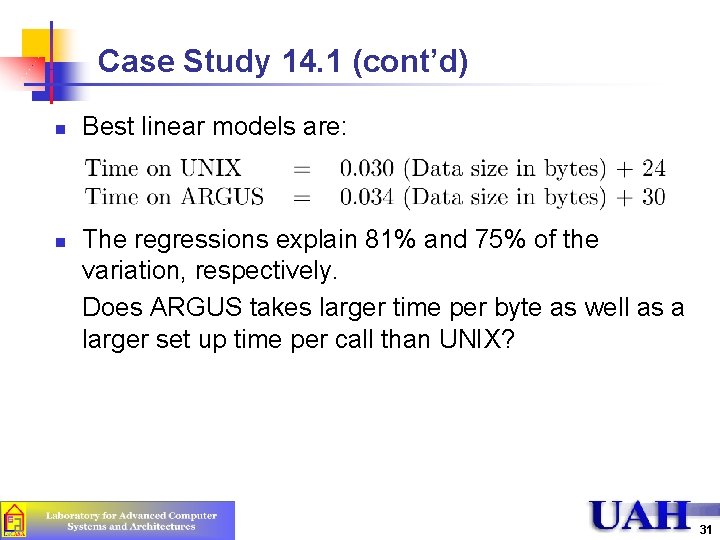
Case Study 14. 1 (cont’d) n n Best linear models are: The regressions explain 81% and 75% of the variation, respectively. Does ARGUS takes larger time per byte as well as a larger set up time per call than UNIX? 31
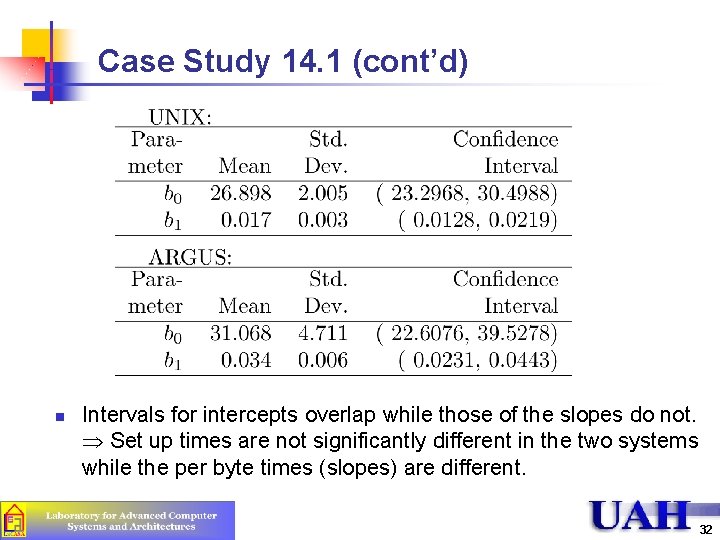
Case Study 14. 1 (cont’d) n Intervals for intercepts overlap while those of the slopes do not. Set up times are not significantly different in the two systems while the per byte times (slopes) are different. 32
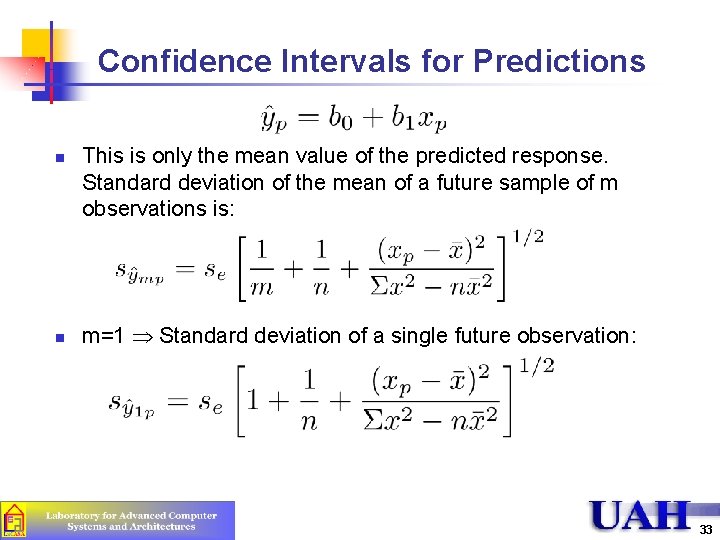
Confidence Intervals for Predictions n n This is only the mean value of the predicted response. Standard deviation of the mean of a future sample of m observations is: m=1 Standard deviation of a single future observation: 33
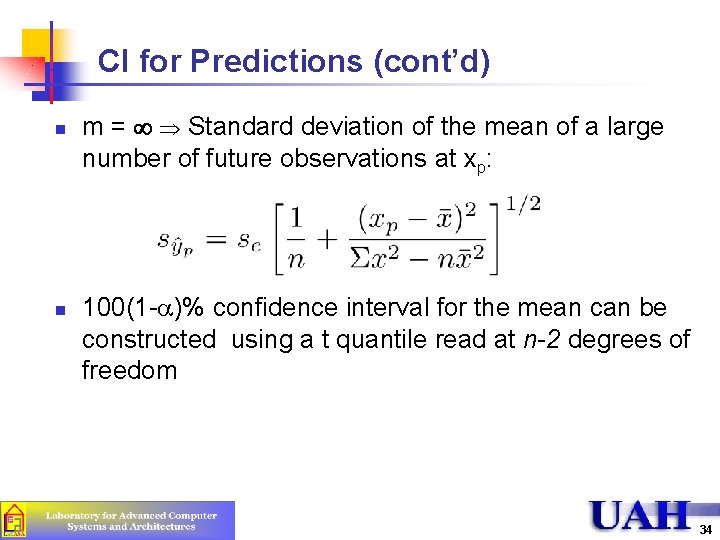
CI for Predictions (cont’d) n n m = Standard deviation of the mean of a large number of future observations at xp: 100(1 -a)% confidence interval for the mean can be constructed using a t quantile read at n-2 degrees of freedom 34
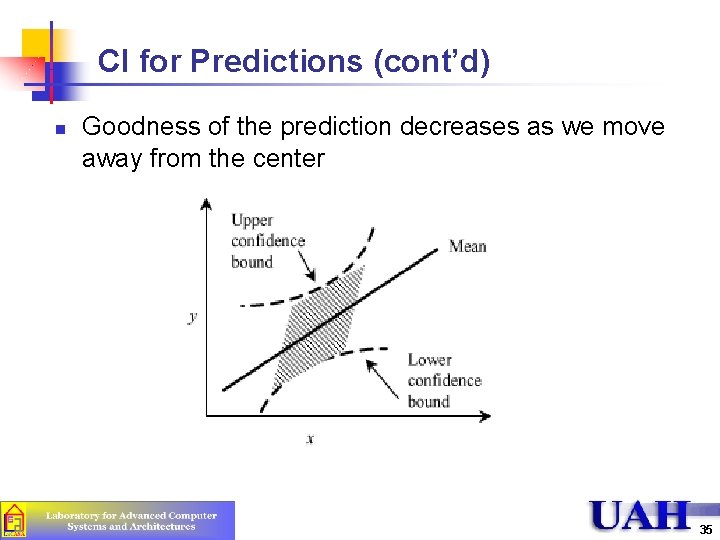
CI for Predictions (cont’d) n Goodness of the prediction decreases as we move away from the center 35
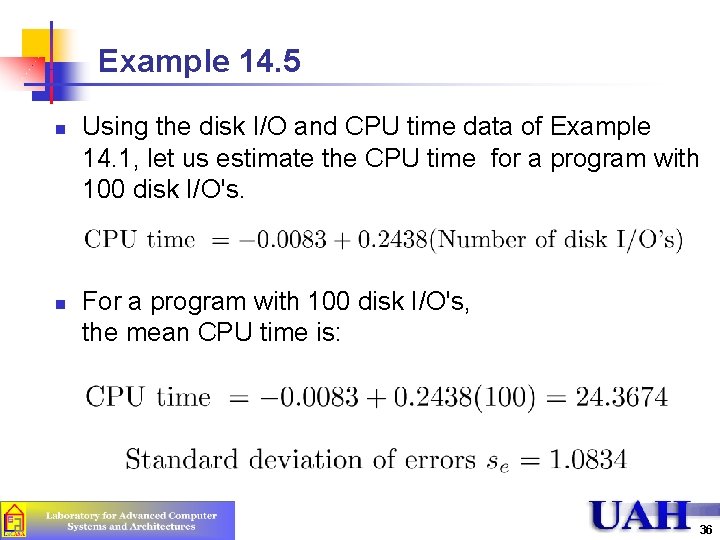
Example 14. 5 n n Using the disk I/O and CPU time data of Example 14. 1, let us estimate the CPU time for a program with 100 disk I/O's. For a program with 100 disk I/O's, the mean CPU time is: 36
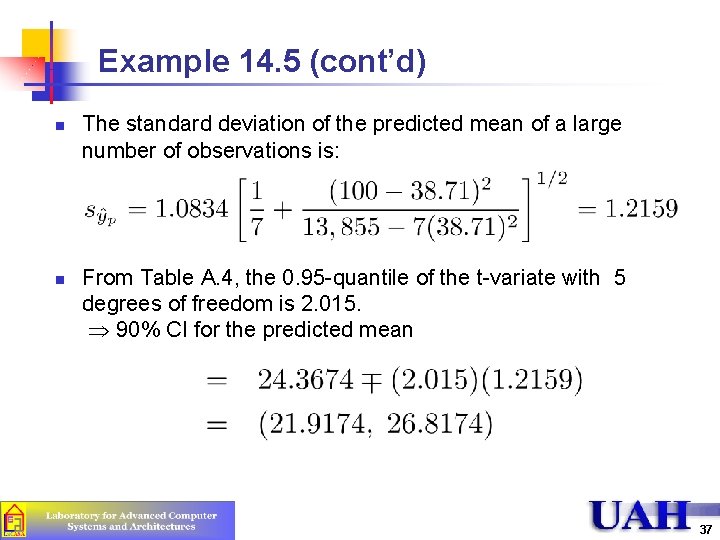
Example 14. 5 (cont’d) n n The standard deviation of the predicted mean of a large number of observations is: From Table A. 4, the 0. 95 -quantile of the t-variate with 5 degrees of freedom is 2. 015. 90% CI for the predicted mean 37
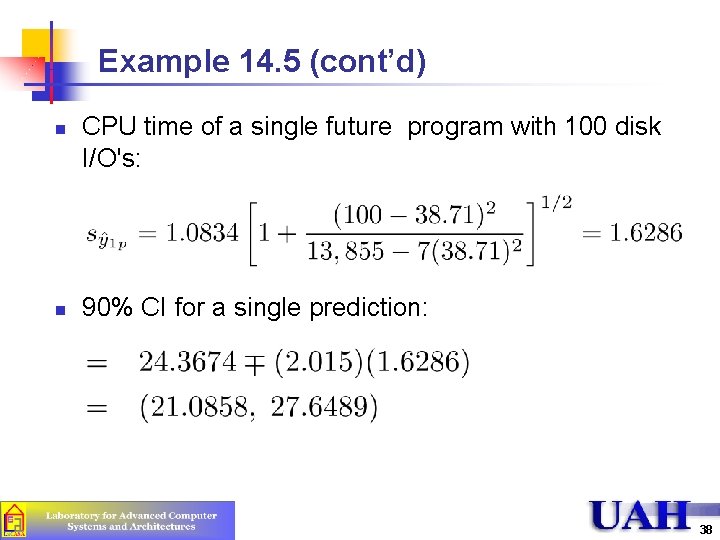
Example 14. 5 (cont’d) n n CPU time of a single future program with 100 disk I/O's: 90% CI for a single prediction: 38
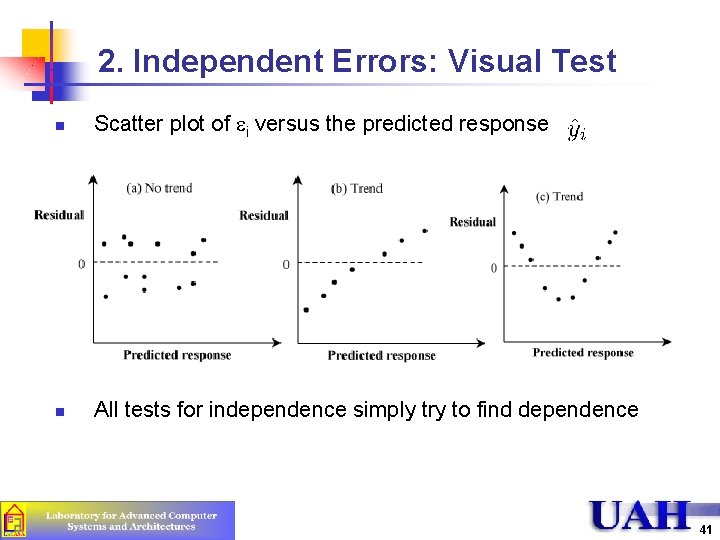
Visual Tests for Regression Assumptions Regression assumptions: 1. The true relationship between the response variable y and the predictor variable x is linear 2. The predictor variable x is non-stochastic and it is measured without any error 3. The model errors are statistically independent 4. The errors are normally distributed with zero mean and a constant standard deviation 39
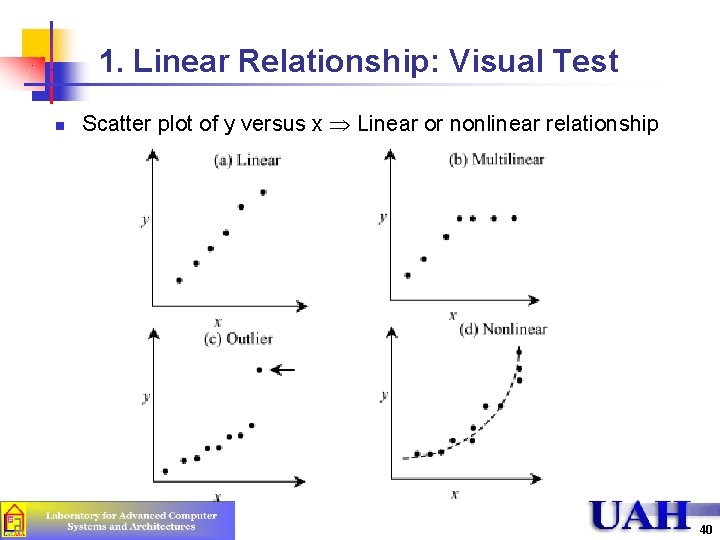
1. Linear Relationship: Visual Test n Scatter plot of y versus x Linear or nonlinear relationship 40
2. Independent Errors: Visual Test n Scatter plot of ei versus the predicted response n All tests for independence simply try to find dependence 41
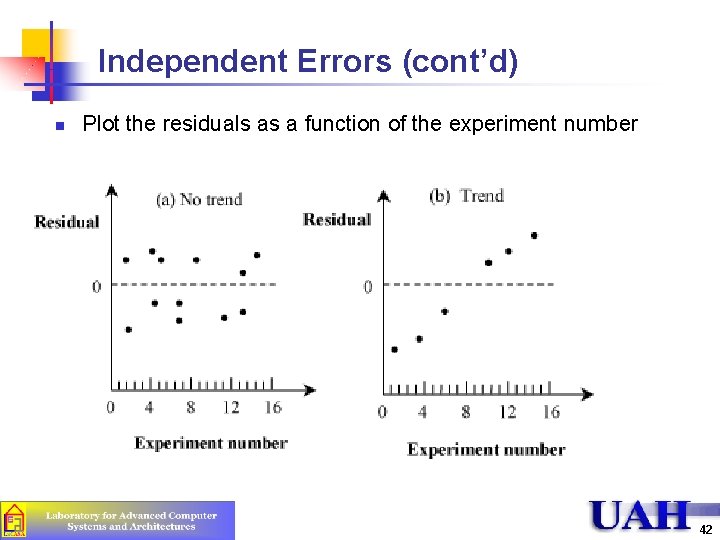
Independent Errors (cont’d) n Plot the residuals as a function of the experiment number 42
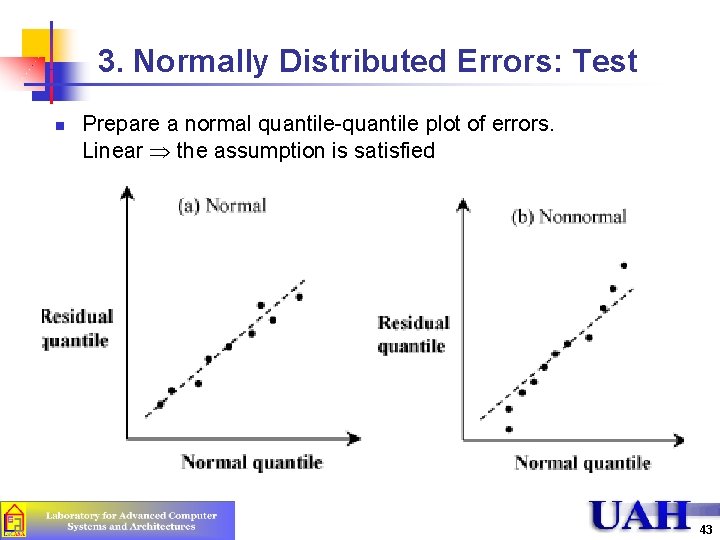
3. Normally Distributed Errors: Test n Prepare a normal quantile-quantile plot of errors. Linear the assumption is satisfied 43
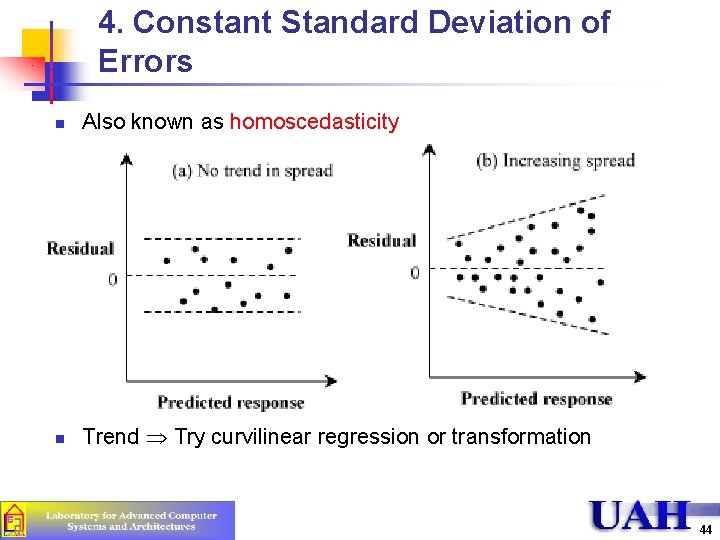
4. Constant Standard Deviation of Errors n Also known as homoscedasticity n Trend Try curvilinear regression or transformation 44
Example 14. 6 Number of disk I/Os Residual Quantile Residual CPU time in ms For the disk I/O and CPU time data of Example 14. 1 Predicted Response Normal Quantile 1. Relationship is linear 2. No trend in residuals Seem independent 3. Linear normal quantile-quantile plot Larger deviations at lower values but all values are small 45
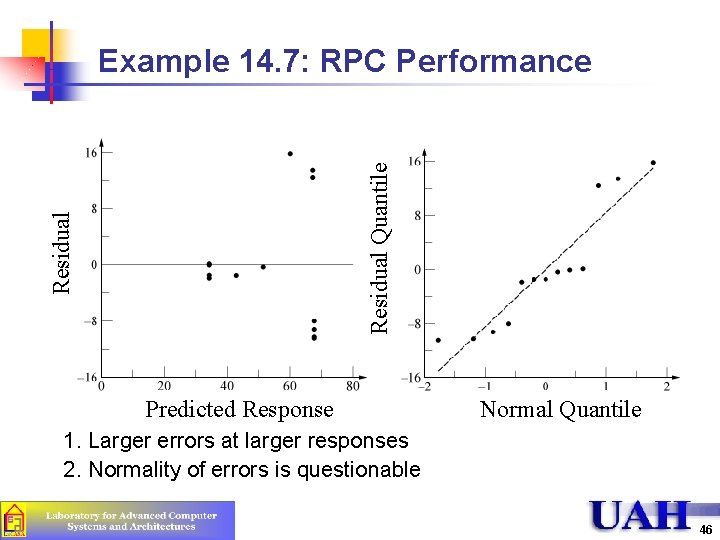
Residual Quantile Example 14. 7: RPC Performance Predicted Response Normal Quantile 1. Larger errors at larger responses 2. Normality of errors is questionable 46
Summary n n n Terminology: Simple Linear Regression model, Sums of Squares, Mean Squares, degrees of freedom, percent of variation explained, Coefficient of determination, correlation coefficient Regression parameters as well as the predicted responses have confidence intervals It is important to verify assumptions of linearity, error independence, error normality Visual tests 47
Homework #5 n n n Read Chapter 13 and Chapter 14 Submit answers to exercise 13. 2 Submit answers to exercise 14. 2, 14. 7 Due: Wednesday, February 13, 2008, 12: 45 PM Submit by email to instructor with subject “CPE 619 -HW 5” Name file as: First. Name. Second. Name. CPE 619. HW 5. doc 48