CPC Monthly Climate Review August 2014 Yan Xue


 and Anomaly Tendency PDO= +0. 3 MDR below-normal DMI= -0.")
 and Anomaly Tendency PDO? -DMI Favourable")


 and E-P Anomaly suppressed precipitation enhanced precipitation From Pingping Xie")


 850 mb Zonal Wind")

")
")

 Aug 2012 (DJF NINO 3. 4=-0. 6)")


 Note that shading denotes the zonal")
 Positive anomalies (brown shading) indicate unfavorable conditions")


 index was negative")
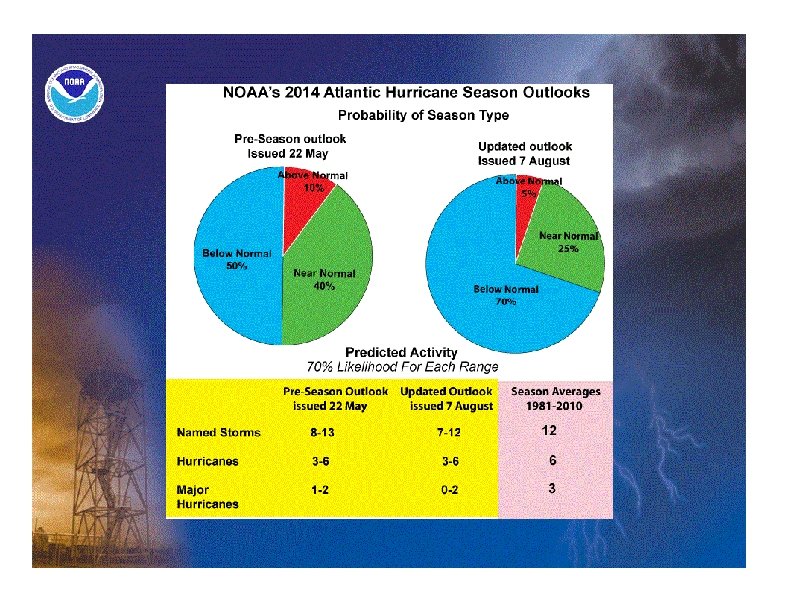
 - Atlantic Outlook (Aug update): 7")
 - E. Pacific Outlook (50%")


 Aug 2012 (DJF NINO 3. 4=-0. 6)")

- Slides: 58
CPC Monthly Climate Review August 2014 Yan Xue Outline: 1. 2. Global Patterns Tropical Climate Variability ENSO, MJO, IOD, TAV, Hurricane Season 3. Extra-Tropical Climate Variability PDO, NAO, Ozone Hole, Monsoon 1. U. S. Climate, Outlooks and Verifications Thanks to Anthony Artusa, Mingyue Chen/Wanqiu Wang, Craig Long, Pingping Xie, Muthu Chelliah, Caihong Wen, Matthew Rosencrans, Michelle L’Heureux, Jon Gottschalck, Wei Shi, Scott Weaver
1. Global Patterns
SST Anomaly (0 C) and Anomaly Tendency PDO= +0. 3 MDR below-normal DMI= -0. 7 ENSO-neutral http: //www. cpc. ncep. noaa. gov/products/GODAS/ocean_briefing. shtml
Upper 300 m Heat Content Anomaly (0 C) and Anomaly Tendency PDO? -DMI Favourable for El Nino http: //www. cpc. ncep. noaa. gov/products/GODAS/multiora_body. html
N. Atlantic below-normal Unfavourable for hurricane E. Pac. above-normal favourable for hurricane
Longitude-Depth Temperature Anomaly and Anomaly Tendency in 1 OS-1 ON http: //www. cpc. ncep. noaa. gov/products/GODAS/multiora_body. html
OLR and 850 mb Wind Anomalies
Sea Surface Salinity (SSS) and E-P Anomaly suppressed precipitation enhanced precipitation From Pingping Xie
2. Tropical Climate Variability ENSO
SST Indices
SOI, Winds and OLR Indices SOI < 0: El Nino-Like SOI > 0: La Nina-Like u 850 < 0: El Nino favorable u 850 > 0: La Nina favorable OLR < 0: El Nino-Like OLR > 0: La Nina-Like
Weekly ENSO Update http: //www. cpc. ncep. noaa. gov/products/p recip/CWlink/MJO/enso. shtml
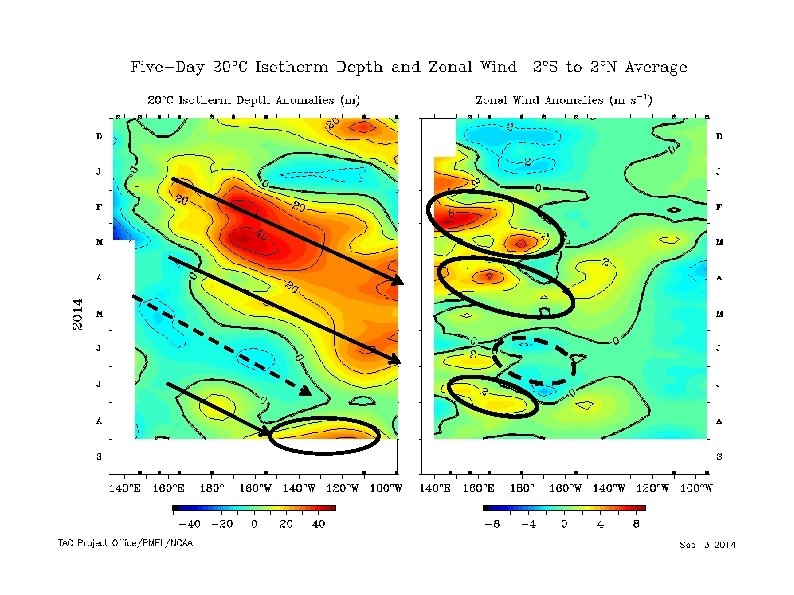
Depth of 20 C Isotherm Anomaly (2 S-2 N, GODAS) 850 mb Zonal Wind Anomaly (5 S-5 N, NCEP R 1)
Tropical Pacific Observing System
Real-Time Multiple Ocean Reanalysis Intercomparison (http: //www. cpc. ncep. noaa. gov/products/GODAS/multiora_body. html)
Upper 300 m Heat Content Anomaly (1981 -2010 Clim. )
Warm Water Volume Index Derived From Ensemble Mean of Ocean Reanalyses JA 82 JA 91 JA 86 - JA 97 JA 02 JA 06 JA 04 JA 09 JA 12 Warm Water Volume averaged in Jul-Aug 2014 is similar to that in Jul-Aug of 2004, 2006, 2009 and 2012. JA 14
Aug 2004 (DJF NINO 3. 4=+0. 6) Aug 2012 (DJF NINO 3. 4=-0. 6) Aug 2006 (DJF NINO 3. 4=+0. 7) Aug 2014 Aug 2009 (DJF NINO 3. 4=+1. 6)
Upper 300 m Heat Content Anomaly Averaged in 5 S-5 N 14/15 86/87 06/07 02/03 09/10 04/05 12/13
20
too warm forecast Good forecast 21
22
NINO 3. 4 Forecast Plums
2. Tropical Climate Variability MJO
850 -h. Pa Vector Wind Anomalies (m s-1) Note that shading denotes the zonal wind anomaly Blue shades: Easterly anomalies Red shades: Westerly anomalies increased. Monsoon flow increased over Africa and persisted over South Asia. the tropical Atlantic. Weak easterly anomalies spread across the westcentral Pacific. Westerly anomalies increased north of the equator over the eastern Pacific, with weak anomalies on the equator.
200 -h. Pa Velocity Potential Anomalies (5°S-5°N) Positive anomalies (brown shading) indicate unfavorable conditions for precipitation Negative anomalies (green shading) indicate favorable conditions for precipitation A slow eastward progression of negative anomalies was observed from January to present across the Indo-Pacific warm pool and central Pacific (red box). During February through April, anomalies propagated eastward with time associated with the MJO before weakening for much of May. Time The pattern became more organized during June with a more coherent wave-1 MJO-like structure with eastward propagation. The pattern became less coherent during July and August as other modes of subseasonal tropical variability, e. g. , equatorial Rossby and Kelvin wave activity, became the more dominant signals. More recently, the signal strengthened with some eastward propagation. Longitude
CFSv 2 Precipitation Forecast
CFSv 2 850 mb Wind Forecast
2. Tropical Climate Variability IOD, TAV, Hurricane
Evolution of Indian Ocean SST Indices - Negative DMI enhanced in August. Fig. I 1 a. Indian Ocean Dipole region indices, calculated as the area-averaged monthly mean sea surface temperature anomalies ( OC) for the SETIO [90ºE-110ºE, 10ºS-0] and WTIO [50ºE-70ºE, 10ºS-10ºN] regions, and Dipole Mode Index, defined as differences between WTIO and SETIO. Data are derived from the NCEP OI SST analysis, and anomalies are departures from the 1981 -2010 base period means.
Evolution of Tropical Atlantic SST Indices - Tropical North Atlantic (TNA) index was negative since Jan 2014. - Tropical South Atlantic (TSA) index continued to be near -normal. - Meridional Gradient Mode (TNA-TSA) remained negative. - Negative ATL 3 SSTA strengthened in Aug. 2014. Fig. A 1 a. Tropical Atlantic Variability region indices, calculated as the area-averaged monthly mean sea surface temperature anomalies (ºC) for the TNA [60ºW-30ºW, 5ºN-20ºN], TSA [30ºW-10ºE, 20ºS-0] and ATL 3 [20ºW-0, 2. 5ºS-2. 5ºN] regions, and Meridional Gradient Index, defined as differences between TNA and TSA. Data are derived from the NCEP OI SST analysis, and anomalies are departures from the 1981 -2010 base period means.
2014 Atlantic Hurricane Counts (http: //weather. unisys. com/hurricane) - Atlantic Outlook (Aug update): 7 -12 Named Storms (12 average) 3 -6 Hurricanes (6 average) 0 -2 Major Hurricanes (3 average)
2014 E. Pacific Hurricane Counts (http: //weather. unisys. com/hurricane) - E. Pacific Outlook (50% above-normal): - E. Pacific Counts by Sep 6: 14 -20 Named Storms (15 average) 15 Named Storms 7 -11 Hurricanes (8 average) 3 Hurricanes 3 -6 Major Hurricanes (4 average) 7 Major Hurricanes
The strongest tropical cyclone ever recorded in May # Name 1 Hurricane-4 AMANDA 2 Tropical Storm BORIS 3 Hurricane-4 CRISTINA 4 Tropical Storm DOUGLAS 5 Tropical Storm ELIDA 6 Tropical Storm FAUSTO 7 Tropical Storm WALI 8 Hurricane-5 GENEVIEVE 9 Hurricane-1 HERNAN 10 Hurricane-4 ISELLE 11 Hurricane-3 JULIO 12 Hurricane-1 KARINA 13 Hurricane-1 LOWELL 14 Hurricane-5 MARIE 15 Hurricane-3 NORBERT Win Pres Cat d 22 -29 MAY 135 4 02 -04 JUN 35 - 09 -15 JUN 130 4 28 JUN-05 JUL 40 - 30 JUN-02 JUL 45 - 07 -09 JUL 40 - 17 -19 JUL 40 - 25 JUL-11 AUG 140 5 26 -29 JUL 65 1 31 JUL-09 AUG 120 4 04 -15 AUG 105 3 13 -27 AUG 70 1 18 -24 AUG 65 1 22 -29 AUG 140 5 02 -07 SEP 105 3 Active Date the strongest tropical cyclone on record to strike the Big Island of Hawaii
3. Extra-Tropical Climate Variability PDO, NAO, Ozone Hole, Monsoon
PDO index - PDO has been in positive phase since Mar 2014, and PDO index = +0. 3 in August 2014. - Pacific Decadal Oscillation is defined as the 1 st EOF of monthly ERSST v 3 b in the North Pacific for the period 19001993. PDO index is the standardized projection of the monthly SST anomalies onto the 1 st EOF pattern. - The PDO index differs slightly from that of JISAO, which uses a blend of UKMET and OIv 1 and OIv 2 SST.
NAO and SST Anomaly in North Atlantic - NAO was well below-normal , with NAO= -2. 3 in August 2014. - Large positive SST anomaly presented near the east coast of Canada and Norwegian Sea. - High-latitude North Atlantic SSTA are reversely related to NAO index (negative NAO coincides with to SST warming). Fig. NA 2. Monthly standardized NAO index (top) derived from monthly standardized 500 -mb height anomalies obtained from the NCEP CDAS in 20ºN-90ºN (http: //www. cpc. ncep. noaa. gov). Time-Latitude section of SST anomalies averaged between 80ºW and 20ºW (bottom). SST are derived from the NCEP OI SST analysis, and anomalies are departures from the 1981 -2010 base period means.
From Craig Long
The black line highlights the -78 C isotherm. Temps colder than -78 C are required to form polar stratospheric clouds upon which solar driven ozone depletion occurs.
Recent Heavy rains, Floods and mudslides in northern India in Kashmir region. (1 -7 Sep. 2014). Forecast anom Observed anom From Muthu Chelliah • India 2104 summer monsoon rainfall, so far this season (since 1 st June) is about 11% BELOW normal. This is much improved compared to about 45% below normal earlier in the season.
4. U. S. Climate, Outlooks and Verifications
U. S. Temperature and Precipitation Departures During the Last 30 Days End Date: 31 August 2014 Percent of Average Precipitation Temperature Departures (degree C) 1 of 2
S ro U i. D n t. M h g u y. Jl 2 u 4 1 , 0 9 M m M E T m m V E A B T S : elif. DU: IRLDS p h g to /n u d lim rucgoenpatsdy)D, h(. r 6 L=-x 4 v 321 b 0 J 8 enafocgup. ST. e DROUGHT MONITOR - Low water levels are visible at the Almaden Reservoir on January 28, 2014 in San Jose, Calif.
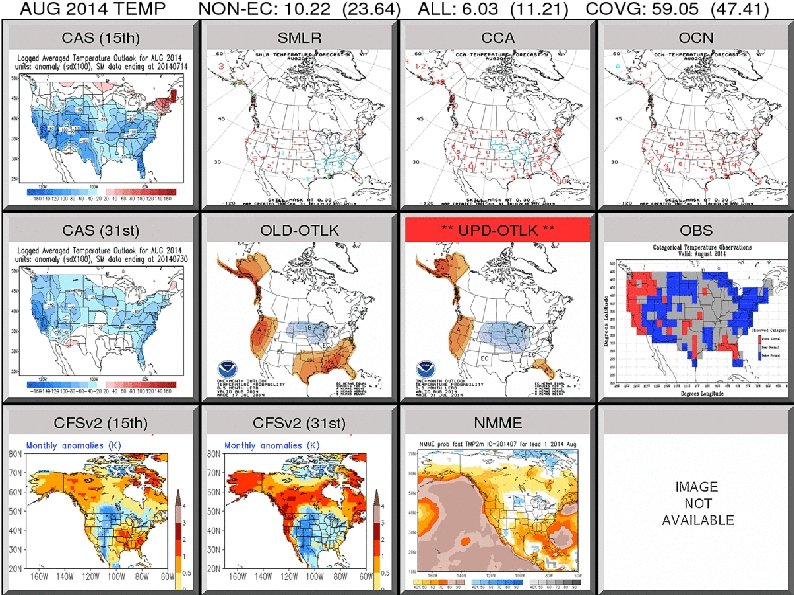
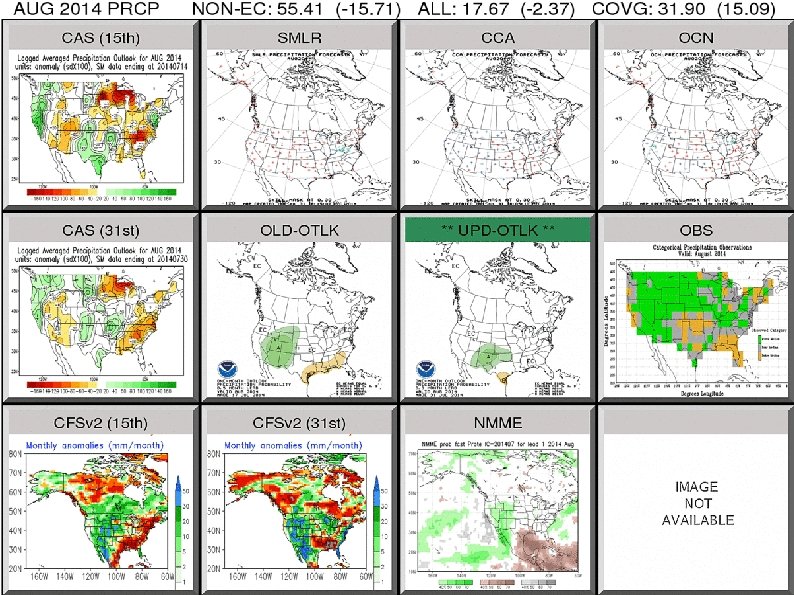
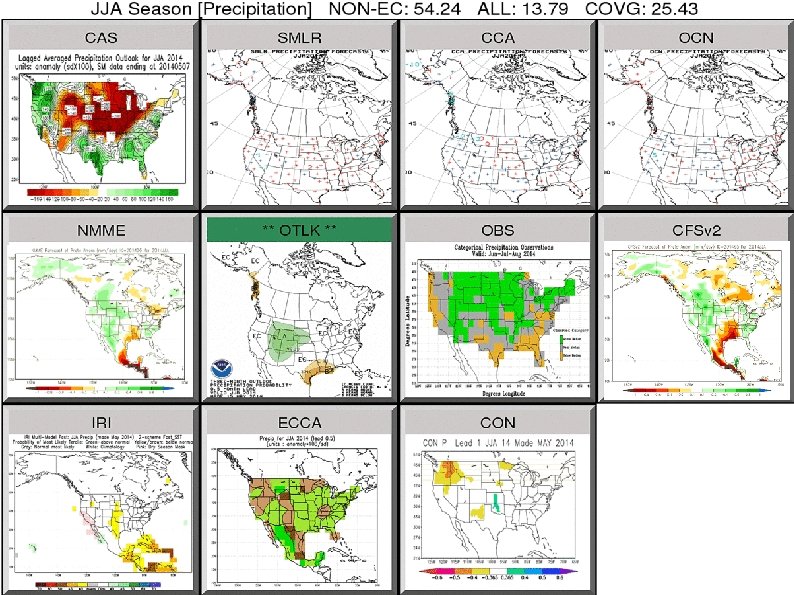
AUG TEMP AUG PRCP Sept 2014 Outlook
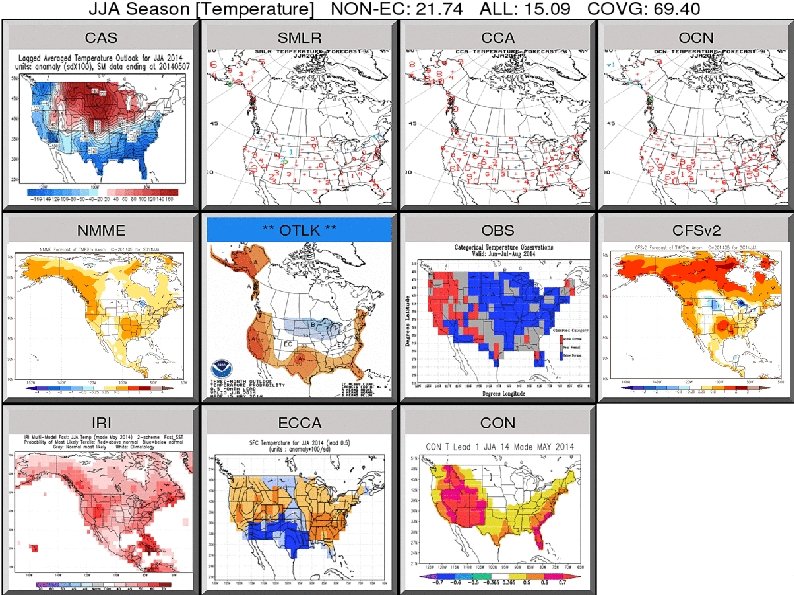
SON 2014 Outlook
Thanks!
Global Temperatures
Global Precipitation
U. S. Temperature and Precipitation Departures During the Last 90 Days End Date: 31 August 2014 Percent of Average Precipitation Temperature Departures (degree C) 2 of 2
Mar 1 Jun 1 Apr 1 Jul 1 May 1 Aug 1
Aug 2004 (DJF NINO 3. 4=+0. 6) Aug 2012 (DJF NINO 3. 4=-0. 6) Jul 2006 (DJF NINO 3. 4=+0. 7) Jul 2009 (DJF NINO 3. 4=+1. 6) Aug 2014 5 S-5 N Average
Westerly bias Good forecast 58