COVID19 and Nuclear Power Risk Management Dave Lochbaum

COVID-19 and Nuclear Power Risk Management Dave Lochbaum April 7, 2020

Background: NRC’s Risk-Informed Inspection Notebook Source: ML 003700093

The Notebook lists the systems modeled in the reactor risk assessment

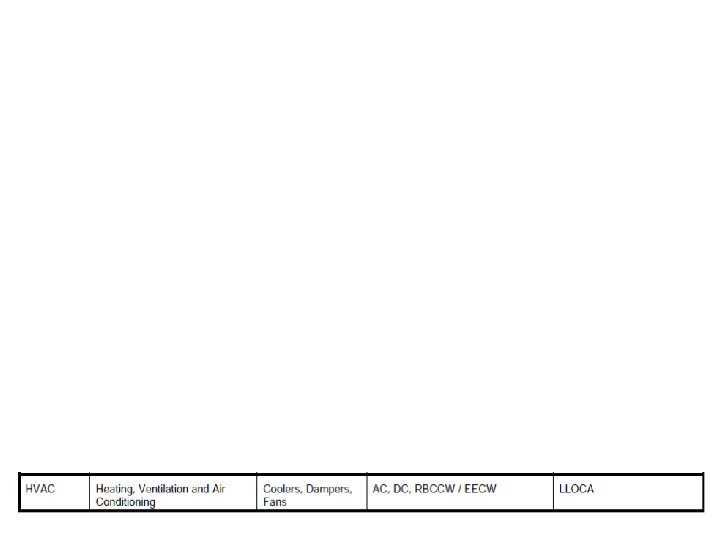
The Notebook also lists the support systems needed by the front-line safety systems

The Notebook shows the accidents, called Initiating Events, that the systems are supposed to mitigate

The Notebook explains how the risk assessment models the Initiating Events, in this example, the loss-of-offsite power (LOOP)

The Notebook lists the Safety Functions modeled in the risk assessment for each Initiating Event

The Notebook defines the minimum requirement for the Safety Functions to be successful. For the Emergency Power Safety Function, one of four Emergency Diesel Generators must operate or one of one Combustion Gas Turbine must operate.

LOOP Event Tree The Notebook uses Event Trees to show Safety Functions successes and failures lead to various outcomes

LOOP Event Tree YES NO YES YES NO NO Event Trees pose Yes and No paths for each Safety Function: up indicates success and down represents failure

LOOP Event Tree YES NO YES YES NO NO CD means a pathway to Core Damage, OK means a pathway averting Core Damage, and other Statuses show other Event Trees invoked to determine the outcome
 for Fermi 2 calculated the chances per year of")
The Individual Plant Examination (IPE) for Fermi 2 calculated the chances per year of Initiating Events happening.

The Fermi 2 risk assessment modeled three different LOOPS: loss of all offsite power (LOSP), loss of only half of the offsite power supply (LOP 1), and loss of the other half of the offsite power supply (LOP 2). The Initiating Event frequency for LOSP was 0. 012 (1. 2%)

Some accidents are more likely to occur (Main Steam Isolation Valve, MSIV, closure at 59%) and other accidents are less likely to occur (break outside containment at 0. 04%) than LOOP

LOOP Event Tree YES NO YES 1. 2% NO YES YES NO NO

The Fermi 2 risk assessment reported the likelihood of restoring offsite power within one hour (13%) and within seven hours (45%)

LOOP Event Tree YES NO YES 1. 2% NO YES 13% YES NO 87% NO YES 45% NO 55% NO

Fault Trees, like this example, define the chances of Safety Functions being successful Source: ML 072740014

Fault Trees also model worker reliability, like the chances of the operator starting a system when needed Source: ML 072740014
 represented 8% of the")
The Fermi 2 risk assessment reported that LOOP (aka LOSP) represented 8% of the overall Core Damage Frequency (CDF) with loss of half of offsite power (LOP 1) being 7% of CDF and loss of the other half (LOP 2) being 14%

Okay, so how can risk assessments be used to estimate the safety implications of deferring testing and inspection of components, repairs of degraded structures, and relaxing the limits on working hours?

One can set the chance of a valve with deferred testing inspection to twice its original value in all the applicable Fault Trees and associated Even Trees to update the Core Damage Frequency Source: ML 072740014

One can double, triple, and quadruple the chances of worker mistakes to determine the sensitivity of CDF to human impairment, such as by fatigue Source: ML 072740014

The NRC and plant owners have used reactor risk assessments for decades to evaluate the safety of proposed modifications and to assess the significance of violations.

The NRC and plant owners can, and must, now use risk assessments to gauge the safety implications of requests to defer work and relax protective measures. BEFORE THE WORK IS DEFERRED AND MEASURES RELAXED!!!
- Slides: 26