Course Overview Background UML and Object Orientation Diagrams

Course Overview Background: UML and Object Orientation Diagrams: • Use Case Diagrams • Collaboration Diagrams • Activity Diagrams • State Diagrams • Class Diagrams • Component Diagrams • Sequence Diagrams • Package Diagrams • Deployment Diagrams

The UML Diagrams Static Structure Diagrams Implementation Diagrams Class - Diagram Use Case Diagram ü Component Diagram - ü ü Deployment Behaviour Diagrams Sequence ü - Diagram State- Diagram ü Activity- Diagram - Collaboration Diagram Collaboration- Diagram 1 ü 2 ü 3 Organisation Diagrams Package- Diagram ü ü ü

What is a UML Component Diagram? • components • model the physical things that may reside on a node, • such as executables, libraries, tables, files, and documents. • node • A physical element that exists at run time and that represents a computational resource, • generally having at least some memory and processing capability. • A component typically represents the physical packaging of otherwise logical elements, such as classes, interfaces, and collaborations. • Examples: • external libraries, COM components, jar files, Enterprise Java Beans, virtual machines, and operating systems

What is a UML Component Diagram? • Component: – Is a physical and replaceable part of a system. – Provides realization of a set of interfaces. • A component diagram : – describes the organization of the physical components in a system.

Component Diagrams • Modeling the physical aspects or static view of a system. • Focuses on system components. • Show dependencies and interactions among software components. – Used for Reusability. • Useful for packaging parts of a system to be replaceable.

Basic Component Diagram Symbols and Notations Component • . A component is a physical building block of the system. It is represented as a rectangle with tabs.

Nested Components • Components may be nested to contain other components. • When components are nested, the interfaces of the enclosed component may be exposed or encapsulated. • When an enclosed component’s interface is exposed, the interface is placed on the border of the enclosing component. J 2 EE EJB Comonent WEB Component

J 2 EE Server Example EJB Comonent WEB Component J 2 EE Server EJB Component Session Bean Entity Bean Web Component Servlet JSP

Nested Components exposed interface • In the diagram above, the EJBContainer component contains a EJB session bean called Reservation. Stateful. Se ssion component. • It exposes the Remote interface for use by clients such as Servlet and JSPs.

Interface • An interface describes a group of operations used or created by components. • Lollipop format • Components publish well-defined interfaces that may be called by other components

Interface Figure 25 -4 Components and Interfaces

Basic Component Diagram Symbols and Notations Dependencies Draw dependencies among components using dashed arrows.

Dependencies and Realizations • Links between components and interfaces indicate either a dependency or a realization. • When a component realizes an interface, it has implemented all of the behavior required by the interface. • When a component depends on an interface, the component makes use of the behavior of the component realizing the interface.

Realization and Dependency • Export Interface: - Supplier realizes or “supports” an interface. Eg: - Reservation. Engine component exports Reservation. API interface. supports dependency • Import Interface: - Consumer has a “dependency” on the interface. E. g. : - Reservation. GUI Component imports Reservation. API interface.

• A Component Diagram

Figure 29 -1 A Component Diagram

• Component Types
 components are")
Component Types • Work Product Components: – Components from which executable (deployment) components are created. – Eq: Source code files (. c , . java ), data files (. txt). • Deployment Components: – To form an executable system. – Eq: . exe files, . dll files • Execution Components: – Created as a consequence of an executing system. – Eq: EJB Component, COM+Object instantiated from DLL.
Source Code 2)Executable Release Code 3)Physical Database 4)Adaptable")
Component Diagram • Used to model: 1)Source Code 2)Executable Release Code 3)Physical Database 4)Adaptable System.
 Modeling Source Code 1. To model source code – use integrated development environments")
1) Modeling Source Code 1. To model source code – use integrated development environments that store source code in files. – You can use component diagrams to model the configuration management of these files, which represent work-product components. – Eq: Source code files (. c , . java ), data files (. txt).

To model a system's source code, 1. identify the set of source code files of interest and model them as components stereotyped as files. 2. For larger systems, use packages to show groups of source code files. 3. Model the compilation dependencies among these files using dependencies.

Figure 29 -2 Modeling Source Code

Example actual
 Modeling Executable Release")
2) Modeling Executable Release
 Modeling Executable Release – In the context of components, a release focuses on")
2) Modeling Executable Release – In the context of components, a release focuses on the parts necessary to deliver a running system. – When you model a release using component diagrams, you are visualizing, specifying, and documenting the decisions about the physical parts that constitute your software—that is, its deployment components. – Eq: . exe files, . dll files

Modeling Executable Release

To model an executable release, 1. Identify the set of components. • Typically, this will involve • • • some or all the components live on one node, or the distribution of these sets of components Consider the stereotype of each component in this set. 2. For most systems, you'll find a small number of different kinds of components (such as executables, libraries, tables, files, and documents). 3. For each component in this set, consider its relationship to its neighbours. • Most often, this will involve interfaces that are exported (realized) by certain components and then imported (used) by others. 4. model these interfaces explicitly to provide external interface. If you want your model at a higher level of abstraction, elide these relationships by showing only dependencies among the components.

Stereotypes 1 File component that represents a document containing source code or data 2 Executable 3 Table component that may be executed on a node Specifies a component that represents a database table 4 Library Specifies a static or dynamic object library. 5 document Specifies a component that represents a document

3. To model physical databases

To model physical databases – the model of a physical database represents the storage of the information • • in the tables of a relational database or the pages of an object-oriented database. – You use component diagrams to represent these and other kinds of physical databases.
 Modeling Physical Databases")
3) Modeling Physical Databases

to map classes to tables. three strategies. • Define a separate table for each class. – It introduces maintenance headaches when you add new child classes or modify your parent classes. • Collapse your inheritance lattices so that all instances of any class in a hierarchy has the same state. – The downside with this approach is that you end up storing extra information for many instances. • Separate parent and child states into different tables. – This approach best mirrors inheritance lattice, – the downside is that traversing your data will require many cross-table joins.

to model a physical database, 1. Identify the classes in your model that represent your logical database schema. 2. Select a strategy for mapping these classes to tables. – Consider the physical distribution of the databases. – mapping strategy will be affected by the location in which data is to be alive on the deployed system. – create a component diagram that contains components stereotyped as tables.
 Modeling Adaptable System")
• 4) Modeling Adaptable System

To model adaptable systems Adaptable system represents physical distribution of a component, that migrates from node to node – Some systems are more dynamic, involving mobile agents or components that migrate for purposes of load balancing and failure recovery. – You use component diagrams in conjunction with some of the UML's diagrams for modeling behavior to represent these kinds of systems.
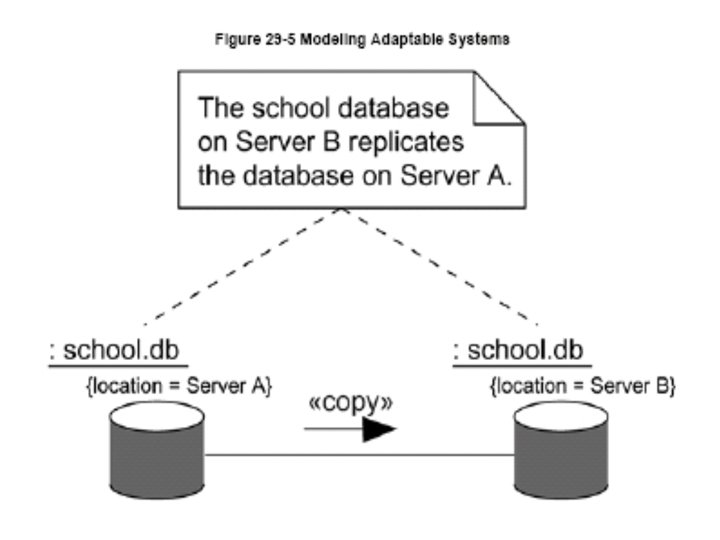

To model adaptable systems • For example, you might have a system that replicates its databases across several nodes, switching the one that is the primary database when a server goes down. • Similarly, if you are modeling a globally distributed 24 x 7 operation (that is, a system that's up 24 hours a day, 7 days a week), you will likely encounter mobile agents, components that migrate from node to carry out some transaction

Process Components – Executables and linked libraries are represented as components in UML • Package specification (DLL) • Task specification (EXE) Package specification (DLL) Task Specification (EXE)

• http: //www. umlforum. com/docs/papers/CACM_Oct 00_p 3 1_Kobryn. pdf

in Figure 1. a Shopping. Cart component for an e business application is shown as a rectangle with two smaller rectangles protruding from its side. At the top of the diagram the component is shown with attributes, operations, and the interfaces Calculate and Change. Order, which are drawn using longhand interface notation (rectangles that contain an operations compartment). At the bottom of the diagram the component is shown in a more compact representation where the attributes and operations are elided and the interfaces are drawn using shorthand (“lollipop”) interface notation.

http: //www. uml-forum. com/docs/papers/CACM_Oct 00_p 31_Kobryn. pdf

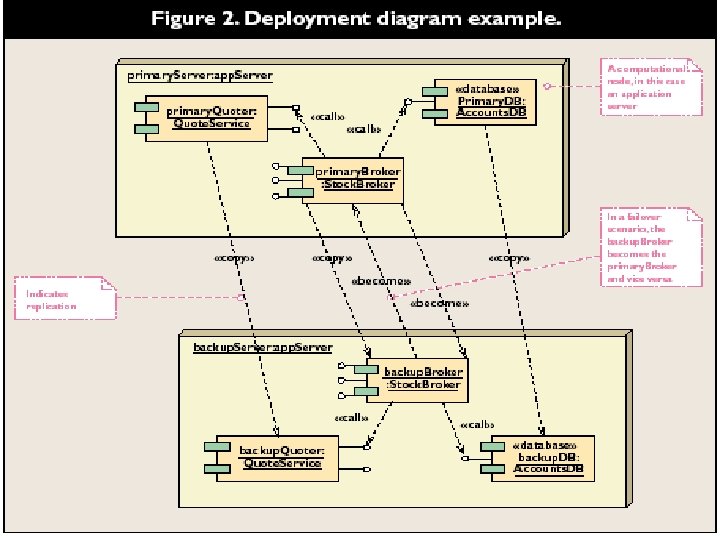
in Figure 2 The example shows a simple failover scenario for an online stockbroker system, several components deployed on an instance of the primary application server node (primary. Server) are replicated on the backup application server node (backup. Server). • primary. Broker, an instance of the component Stock. Broker, • primary. Quoter (an instance of the Quote. Service component) • primary. DB (an instance of the Accounts. DB component) On the primary. Server the primary. Broker, calls the interfaces of the primary. Quoter and the primary. DB Component replication and migration are shown by «copy» and «become» dependency flows, which are part of standard UML.

• http: //www. devx. com/enterprise/Article/28296 /1954? pf=true

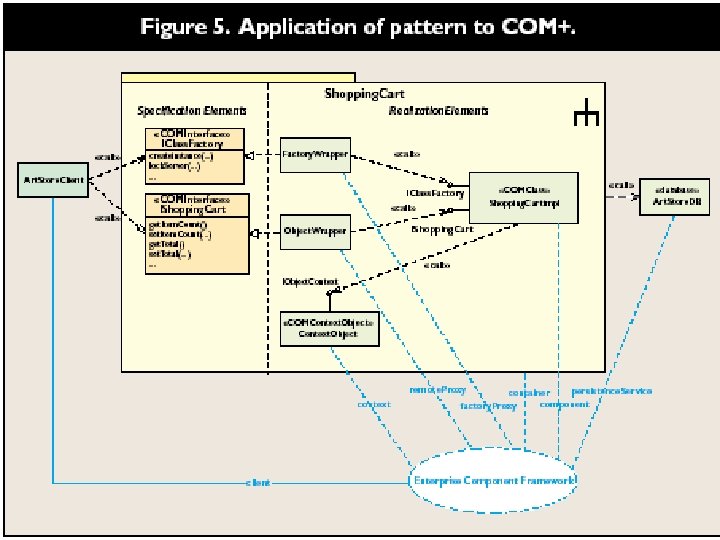
Figure Three-Tier Pattern Applied to the Component Diagram: Each tier is represented in UML by a package: in this case Data Tier, Application Tier, and Presentation Tier. The tiers are used as holders to help organize the components.

Hospital Information System • • A hospital wishes to maintain a database to assist with the administrator of its words and operation theatre and to maintain information relating to its patients, surgeon and nurses. Most patients are assigned to a ward and each ward may contain many patients. However the consultants at the hospital may have private patients who are assigned private rooms. A nurse may or may not be assigned to a ward. A nurse can not be assigned to more than one ward. A ward may have many nurses assigned to it. Each ward is dedicated to particular type like ENT. A nurse may or may not be assigned to an OT. A nurse can not be assigned to more than one OT. An OT may have many nurses assigned to it. A patient may have number of operations and the information to be reported about an operation includes type, patient, surgeon, date, time and location. Only one surgeon may perform an operation. Any other surgeon present is considered as assisting at the operation. Each consultant has a specialization.

Schematic class diagram

STAFF Hospital
- Slides: 51