Course Name Engineering Chemistry Course Code CY 8151


 meanings of terms 1. Phase (P) Phase is defined as, “any homogeneous")
 Gaseous phase All gases are completely miscible and there is no boundary between")
 Liquid Phase present and their miscibilities. (i) If two liquids are immiscible, they")
 Solid Phase Every solid constitutes a separate phase. Decomposition of Ca. CO 3")
 A solution of")
 Component is defined as, “the smallest number of independently variable constituents,")
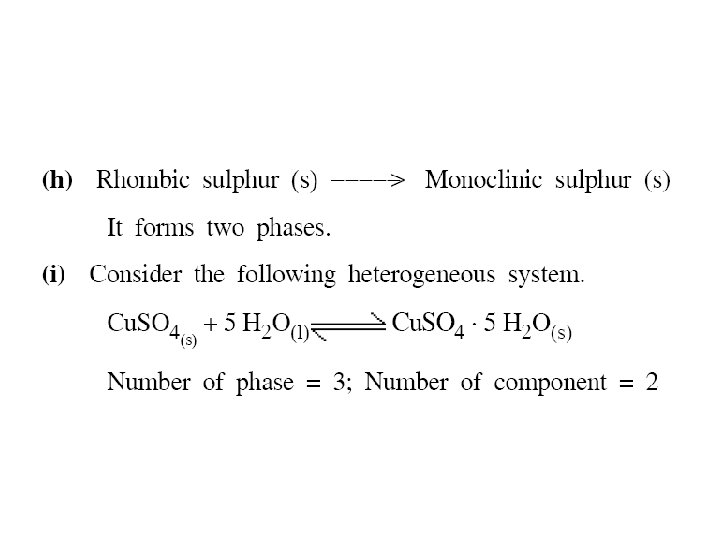
 and vapour, but the chemical composition is only sulphur. Hence it is a")
 Degree of freedom is defined as, “the minimum number")

 state both the pressure and temperature. Hence, the system is bivariant.")


 The three curves OA, OB and OC meet at")
 The curve OB’ is called vapour pressure curve")

 Condensed system")


 Formation of compound with incongruent melting point Of the above compounds, a compound")


 The curves AO and BO meet at point ‘O’")


 The point E 1 is the eutectic point,")

 The point E 2 is the eutectic point,")
 Below the line AE 1 The area below the line AE")


 merits of phase rule 1. It is applicable to both physical and")

- Slides: 53
Course Name: Engineering Chemistry Course Code: CY 8151 Chapter: Phase Rule Dr G S Sivagurunathan Assistant Professor Of Chemistry Knowledge Institute Of Technology Salem-637504
INTRODUCTION All the chemical reactions can be broadly classified into two types.
v opposite directions. homogeneous v. The reversible studied reactions using becan the law of mass action. v v But the heterogeneous systems require different methods. The phase rule, given by Willard Gibbs (1874), is used to study the behavior of heterogeneous reversible reactions.
Phase Rule If the equilibrium between any number of phases is not influenced by gravity, or electrical, or magnetic forces but is influenced only by pressure, temperature and concentration, then the number of degree of freedom (F) of the system is related to number of components (C) and number of phases (P) by the following phase rule equation.
Explanation (or) meanings of terms 1. Phase (P) Phase is defined as, “any homogeneous physically distinct and mechanically separable portion of a system which is separated from other parts of the system by definite boundaries”.
(a) Gaseous phase All gases are completely miscible and there is no boundary between one gas and the other.
(b) Liquid Phase present and their miscibilities. (i) If two liquids are immiscible, they will form three separate phases two liquid phase and one vapour phase. Benzene - Water. (ii) If two liquids are completely miscible, they will form one liquid phase and one vapour phase. Alcohol - Water.
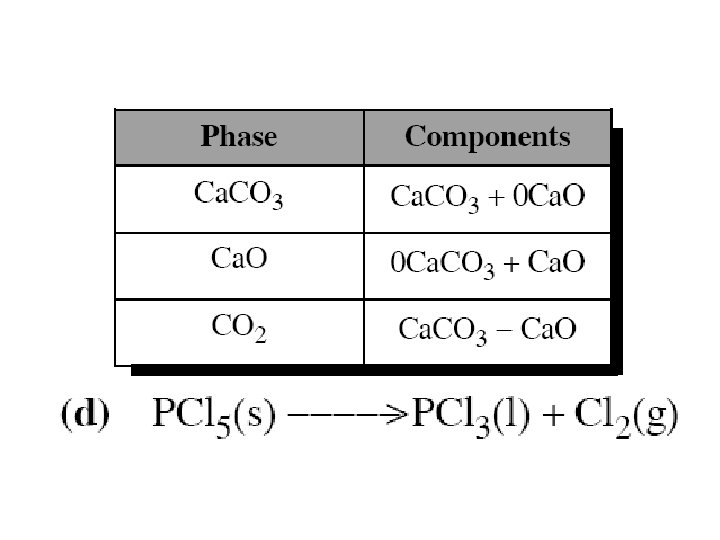
(c) Solid Phase Every solid constitutes a separate phase. Decomposition of Ca. CO 3
are definite boundaries between phases. So this forms three phases. (e) A solution of a substance in a solvent consists of one phase only. Sugar solution in water. (f) An emulsion of oil in water forms two phases
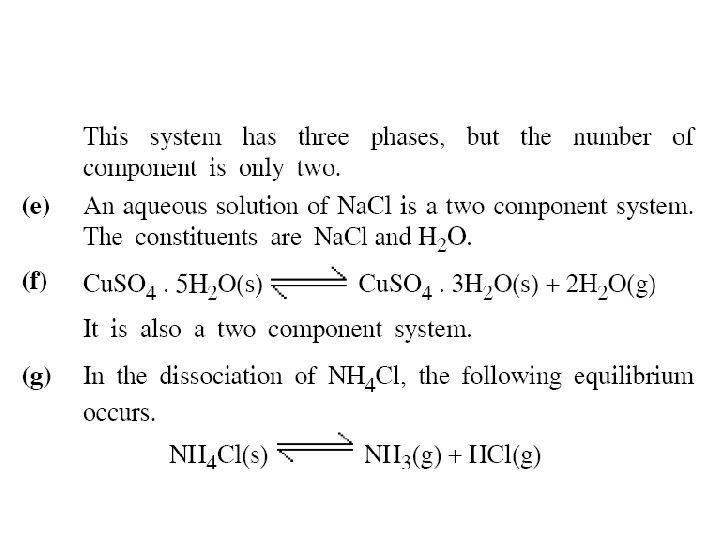
2. COMPONENT (C) Component is defined as, “the smallest number of independently variable constituents, by means of which the composition of each phase can be expressed in the form of a chemical equation”. The chemical composition of all the three phases is H 2 O, but are in different physical form. Hence the number of component is one.
(b) and vapour, but the chemical composition is only sulphur. Hence it is a one component system. (c) Thermal decomposition of Ca. CO 3
3. DEGREE OF FREEDOM (F) Degree of freedom is defined as, “the minimum number of independent variable factors such as temperature, pressure and concentration, which must be fixed in order to define the system completely” univariant, bivariant, trivariant and nonvariant respectively. (a) Consider the following equilibrium
These three phases will be in equilibrium only at a particular temperature and pressure. Hence, this system does not have any degree of freedom, so it is non variant or zero variant. (b) Consider the following equilibrium Here liquid water is in equilibrium with water vapour. Hence any one of the degrees of freedom such as temperature or pressure has to be fixed to define the system. Therefore the degree of freedom is one.
(c) state both the pressure and temperature. Hence, the system is bivariant.
PHASE DIAGRAM Phase diagram is a graph obtained by plotting one degree of freedom against another. Types of Phase Diagrams 1. P-T diagram 2. T-C diagram
1. P-T Diagram If the phase diagram is plotted between temperature against pressure, the diagram is called P-T diagram is used for one component system. 2. T-C Diagram If the phase diagram is drawn between temperature against composition, the diagram is called T - C diagram. T- C diagram is used for two component system.
Uses of Phase Diagram 1. eutectic alloy or a solid solution is formed on cooling a homogeneous liquid containing mixture of two metals. The 2. of materials in the heterogeneous equilibrium system. 3. be carried out using phase diagrams.
APPLICATIONS OF PHASE RULE TO ONE COMPONENT SYSTEM The water system Water exists in three possible phases namely solid, liquid and vapour. Hence, there can be three forms of equilibria.
phase diagram for the water system is shown in the following Fig. This phase diagram contains curves, areas, and triple point. 1. Curve OA The curve OA is called vapourisation curve, it represents the equilibrium between water and vapour. At any point on the curve the following equilibrium will exist. The degree of freedom of the system is one, i. e. , univariant. This is predicted by the phase rule.
Fig 5. 1 Phase Diagram of Water System
2. Curve OB The curve OB is called sublimation curve of ice, it represents the equilibrium between ice and vapour. At any point on the curve the following equilibrium will exist. The degree of freedom of the system is one, i. e. univariant. This is predicted by the phase rule. This equilibrium (line OB) will extend upto the absolute zero (-273 OC), where no vapour can be present and only ice will exist.
3. Curve OC The curve OB is called sublimation curve of ice, it represents the equilibrium between ice and vapour. At any point on the curve the following equilibrium will exist. The curve OC is slightly inclined towards pressure axis. This, shows that melting point of ice decreases with increase of pressure. The degree of freedom of the system is one, i. e. univariant. This is predicted by the phase rule.
4. Point ‘O’ (Triple point) The three curves OA, OB and OC meet at a point ‘O’, where three phases namely solid, liquid and vapour are simultaneously at equilibrium. This point is called triple point, at this point the following equilibrium will exist. The degree of freedom of the system is zero i. e. , nonvariant. This is predicted by the phase rule. Temperature and pressure at the point ‘O’ are 0. 0075 OC and 4. 58 mm respectively.
5. Curve OB’ : (Metastable equilibrium) The curve OB’ is called vapour pressure curve of the supercool water or metastable equilibrium where the following equilibrium will exist. Sometimes water can be cooled below 0 o. C without the formation of ice, this water is called super-cooled water. Super cooled water is unstable and it can be converted into solid by “seeding” or by slight disturbance.
6. Areas Area AOC, BOC, AOB represents water, ice and vapour respectively. In order to define the system at any point in the areas, it is essential to specify both temperature and pressure. The degree of freedom of the system is two. i. e. , Bivariant. This is predicted by the phase rule
TWO COMPONENET ALLOY SYSTEM OR MULTI COMPONENT EQUILIBRIA Reduced phase rule (or) Condensed system The maximum number of degree of freedom in a two component system will be three, when the system exists as a single phase. In order to represent the conditions of equilibrium graphically, it requires three co-ordinates, namely P, T and C. This requires three dimensional diagram, which cannot be conveniently represented on paper. Therefore, any two of the three variables must be chosen for graphical representation.
v A solid-liquid equilibrium of an alloy has practically no gaseous phase and the effect of pressure is negligible. v Therefore, experimentsareconductedunderatmospheric pressure. v are considered and the gas phase is ignored is called a condensed system. v becomes This equation is called reduced phase rule or condensed phase rule.
Classification of Two Component System Based on the solubility and reactive ability, the two component systems are classified into three types. i. Simple eutectic formation. ii. (a) Formation of compound with congruent melting point. (b) Formation of compound with incongruent melting point. iii. Formation of solid solution.
1. Simple Eutectic Formation A binary system consisting of two substances, which are completely miscible in the liquid state, but completely immiscible in the solid state is known as eutectic (easy melt) system. They do not react chemically. Of the different mixtures of two substances, the mixture having the lowest melting point is known as the eutectic mixture. 2. (a) Formation of compound with congruent melting point. In this type of binary alloy system the two substances form one or more compounds with definite proportions. Of the compounds, a compound is said to possess congruent melting point, if it melts exactly at a constant temperature into liquid, having the same composition as that of the solid.
(b) Formation of compound with incongruent melting point Of the above compounds, a compound is said to possess incongruent melting point, if it decomposes completely at a temperature below its melting point yielding a new solid phase with a composition different from that of the original. 3. Formation of solid solution In this type when two substances, especially metals, are completely miscible in both the solid and liquid states, they form solid solutions where mixing takes place in the atomic levels. A condition for the formation of solid solution is, the two metals should not differ in atomic radius by more than 15%.
BINARY ALLOY SYSTEM OR THE SIMPLE EUTECTIC SYSTEM The Lead-Silver System Since the system is studied at constant pressure, the vapour phase is ignored and the condensed phase rule is used. The phase diagram of lead-silver system is shown in the following Fig. 5. 2. It contains lines, areas and the eutectic point.
Fig 5. 2 Phase diagram of Lead - Silver system
1. Curve AO The curve AO is known as freezing point curve of silver. Point A is the melting point of pure Ag 961 OC. The curve AO shows the melting point depression of Ag by the successive addition of Pb. Along this curve AO, solid Ag and the melt are in equilibrium. According to reduced phase rule equation. The system is univariant.
2. Curve BO The curve BO is known as freezing point curve of lead. Point B is the melting point of pure lead 327 OC. The curve BO shows the melting point depression of ‘Pb’ by the successive addition of ‘Ag’. Along this curve ‘BO’, solid ‘Pb’ and the melt are in equilibrium. According to reduced phase rule equation. The system is univariant
3. Point ‘O’ (Eutectic point) The curves AO and BO meet at point ‘O’ at a temperature of 303 OC, where three phases (solid Ag, solid Pb and their liquid melt) are in equilibrium. According to reduced phase rule equation. The system is non-variant.
The point ‘O’ is called eutectic point or eutectic temperature and its corresponding composition, 97. 4%Pb + 2. 6%Ag, is called eutectic composition. Below this point the eutectic compound and the metal solidify 4. Areas The area above the line AOB has a single phase molten Pb Ag. According to reduced phase rule equation. The system is bivariant. Both the temperature and composition have to be specified to define the system completely. The area below the line AO solid Ag liquid melt , below the line BO solid Pb liquid melt and below the point ‘O’ (Eutectic compound + solid Ag or solid Pb) have two phases and hence the system is univariant
Application of Pattinson’s process for the desilverisation of Argentiferous lead v The argentiferous lead, consisting of a very small amount of silver (say 0. 1%), is heated to a temperature above its melting point, so that the system consisting of only the liquid phase represented by the point ‘p’ shown in the above Figure. 5. 2 Itis then allowed to cool. v
Thus, the process of raising the relative proportion of Ag in the alloy is known as Pattinson’s process. Uses of Eutectic system 1. Suitable alloy composition can predicted be with the help of eutectic systems. 2. Eutectic systems are used preparing in solders, used for joining two metal pieces together.
Zinc – Magnesium Alloy System Zn-Mg binary alloy system is a very good example for the formation of compound with congruent melting point. A compound is said to possess congruent melting-point, if it melts exactly at a constant temperature into a liquid having the same composition as that of solid. considered as a combination of two phase diagrams of Pb-Ag system placed side-by-side. shown in the following Fig. 1. Left side consists of Zn and Mg. Zn 2 system. 2. Right side consists of Mg. Zn 2 and Mg system.
Left side of the Phase Diagram 1. Curve AE 1 The curve AE 1 is freezing point curve of Zn. Point A is the melting point of pure Zn 420 OC. The curve AE 1 shows the melting point depression of Zn by the successive addition of Mg. Along this curve AE 1, solid Zn and the melt are in equilibrium.
2. Point E 1 (Eutectic point) The point E 1 is the eutectic point, where, three phases (solid Zn, solid Mg. Zn 2 and their melt) are in equilibrium. The temperature at this point is 380 OC. RIGHT SIDE OF THE PHASE DIAGRAM 3. Curve CE 2 The curve CE 2 is freezing point curve of Mg. Point C is the melting point of pure Mg 6500 C. The curve CE 2 shows the melting point depression of Mg by the successive addition of Zn. Along this curve CE 2, solid Mg and the melt are in equilibrium.
Fig 5. 3 Phase diagram of Zinc-Magnesium alloy system
4. Point E 2 (Eutectic point) The point E 2 is the eutectic point, where, three phases (solid Mg, solid Mg. Zn 2 and their melt) are in equilibrium. The temperature at this point is 347 OC. 5. Curve E 1 BE 2 The curve E 1 BE 2 is freezing point curve of Mg. Zn 2. Along the curve, solid Mg. Zn 2 and the melt are in equilibrium.
7. Areas (a) Below the line AE 1 The area below the line AE 1 consists of solid Zn and the solution. (b) Below the line CE 2 The area below the line CE 2 consists of solid Mg and the solution. (c) Below the line E 1 BE 2 The area below the line E 1 BE 2 consists of solid Mg. Zn 2 and the solution. (d) Below the point E 1 and E 2 The area below the point E 1 and E 2 consists of solid Zn + solid Mg. Zn 2 and solid Mg. Zn 2 + solid Mg respectively. (e) Above the line AE 1 BE 2 C The area above the line AE 1 BE 2 C consists of only liquid phase.
Eutectic Compositions and Temperatures of Some Alloys
Differences between Melting point, Eutectic point and Triple point Melting point It is the temperature at which the solid and liquid phases, having the same composition, are in equilibrium. Eutectic point It is the temperature at which two solids and a liquid phase are in equilibrium.
Triple point It is the temperature at which three phases are in equilibrium. By definition, all the eutectic points are melting points, but all the melting points need not be eutectic points. Similarly, all the eutectic points are triple points, but all the triple points need not be eutectic points.
Uses (or) merits of phase rule 1. It is applicable to both physical and chemical equilibria. 2. It is a convenient method of classifying the equilibrium states in terms of phases, components and degree of freedom. 3. It indicates that the different systems having the same degrees of freedom behave similarly. 4. It helps in deciding whether the given number of substances remain in equilibrium or not.
Limitations of phase rule 1. Phase rule can be applied only for the systems in equilibrium. 2. Only three variables like P, T & C are considered, but not electrical, magnetic and gravitational forces. 3. All the phases of the system must be present under the same conditions of pressure and temperature. 4. Solid and liquid phases must not be in finely divided state, otherwise deviations occur