Counterfeiting in the Maritime World FIATA World Congress


- Slides: 11
Counterfeiting in the Maritime World FIATA World Congress 2017 Meena Sayal, Global Brand Protection Director, Unilever
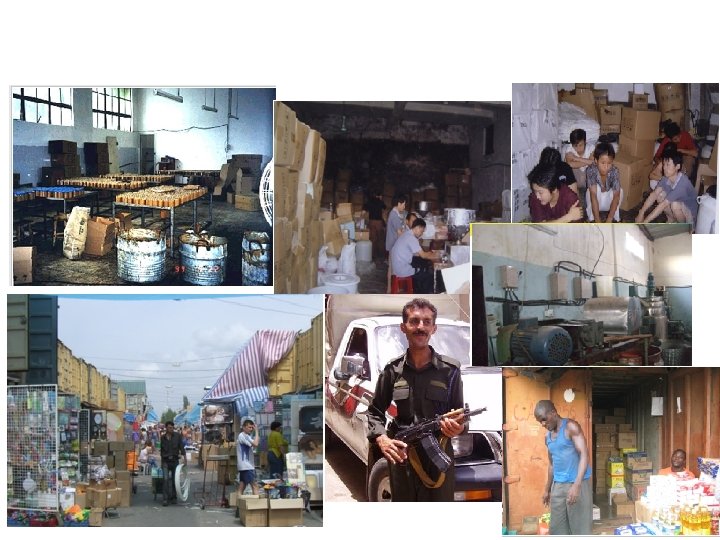
OECD Report 2015 § Global trade in cross-border counterfeits – $461 Billion USD in 2013 § 80% rise in counterfeiting between 2008 and 2013 § 2. 5% of total global trade value § All categories of product are faked – shampoos, food, medicines, toys, electrical § China is the main source of fakes imported to EU http: //www. oecd. org/governance/trade-in-counterfeit-and-pirated-goods -9789264252653 -en. htm
Frontier Economics Report 2016 § Estimated international and domestic counterfeit trade – $710 - $917 Billion USD § Total including digital piracy – $923 Billion - 1. 13 Trillion USD § Projected to rise to $1. 90 - $2. 81 Trillion USD by 2022 § Further economic impact based on wider social costs – (tax, employment, health and safety risks) https: //iccwbo. org/publication/economic-impacts-counterfeiting-piracyreport-prepared-bascap-inta/
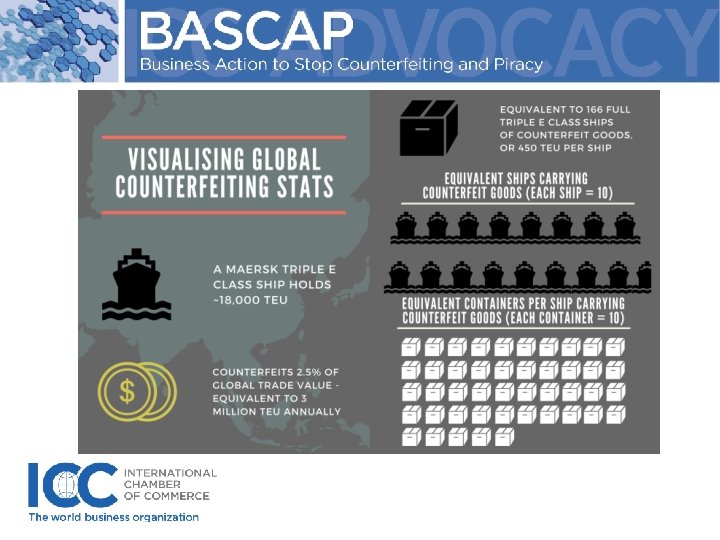
Extrapolation to Maritime Figures
Global Containerized Cargo Trade § Total Containerised Import/Export Cargo in 2013 was 122. 35 million TEUs (IHS Global Insight, World Trade Service) § 2. 5% of this is equivalent to over 3 million TEUs of counterfeit goods shipped in 2013 http: //www. worldshipping. org/about-the-industry/globaltrade/trade-statistics
EU Cargo Ports • Over 50% of all weight is imported into EU by sea • 28 Member states • Lots of consignments enter EU with transit status • 5% of all imports into the EU are fake Source: Euro. Stat
EU Cargo Ports • • Limited number of large seaports Rotterdam and Antwerp account for 37% of volume of containers handled in 1000 TEUs handled in top 10 EU cargo ports Port Rotterdam 2013 2014 2015 11021 11634 11577 Antwerp 8256 8812 9370 Hamburg 9302 9775 8848 Bremerhaven 5822 5731 5467 Valencia 4328 4407 4609 Algeciras 3988 4555 4516 Felixstowe 3434 4072 4043 Gioia Tauro 3652 3708 3030 Le Havre 2186 2433 2560 Genova 1546 2014 2079 53535 57141 56099 Total Source: Euro. Stat 2012
DOI Signatories
Declaration of Intent Principles A. We will adopt a zero tolerance policy regarding counterfeiting B. We will reinforce our Supply Chain Controls C. We will enhance risk profiling D. We will raise awareness and conduct training E. We will share Information and cooperate It is also intended to agree a collaboration through joint working groups to develop a detailed series of measures to be implemented.