COSTS OF PRODUCTION What is Production Production converting


 • Inputs")


")
 At output Q, what area represents: TC 0")


- Slides: 44
COSTS OF PRODUCTION
What is Production • Production = converting inputs into output
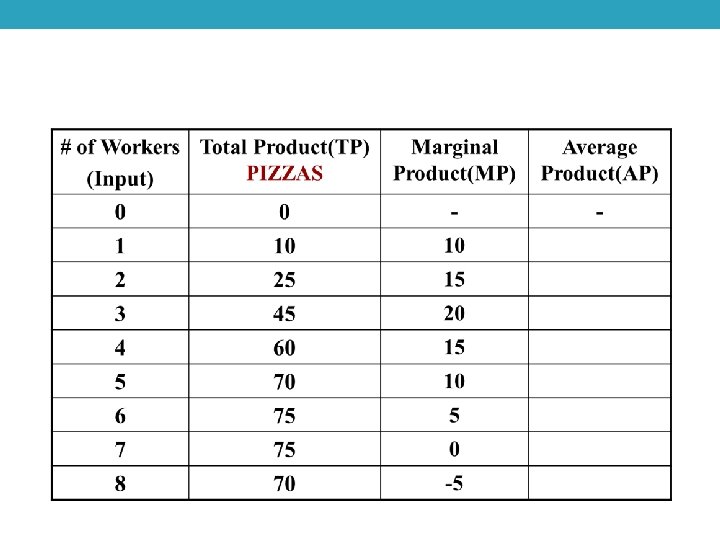
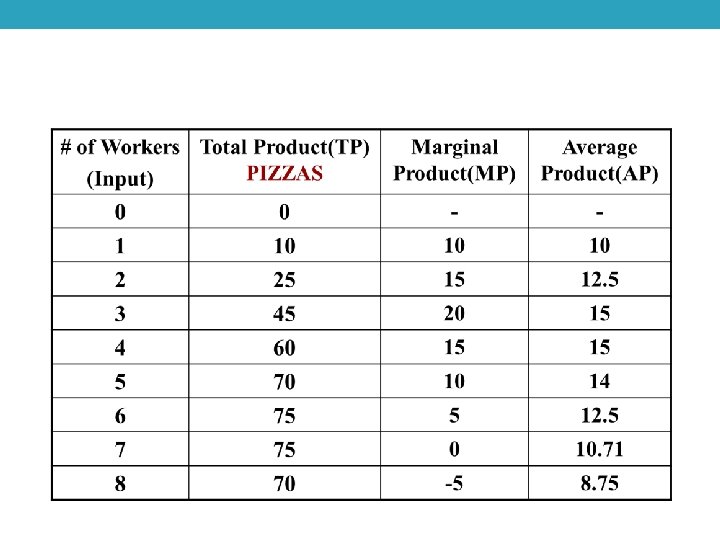
Inputs and Outputs • To earn profit, firms must make products (output) • Inputs are the resources used to make outputs • Input resources are also called FACTORS • Total Physical Product (TP) = total output or quantity produced • Marginal Product (MP) – the additional output generated by additional inputs (workers) • Marginal Product = Change in Total Product Change in Inputs • Average Product (AP) – the output per unit of input • Average Product = Total Product Units of Labor
Production Analysis • What happens to the Total Product as you hire more workers? • What happens to Marginal Product as you hire more workers? • Why does this happen? • The Law of Diminishing Marginal Returns • As variable resources (workers) are added to fixed resources (machinery, tools, etc. ) the additional output produced from each new worker will eventually fall. • Too many cooks in the kitchen
GRAPHING PRODUCTION
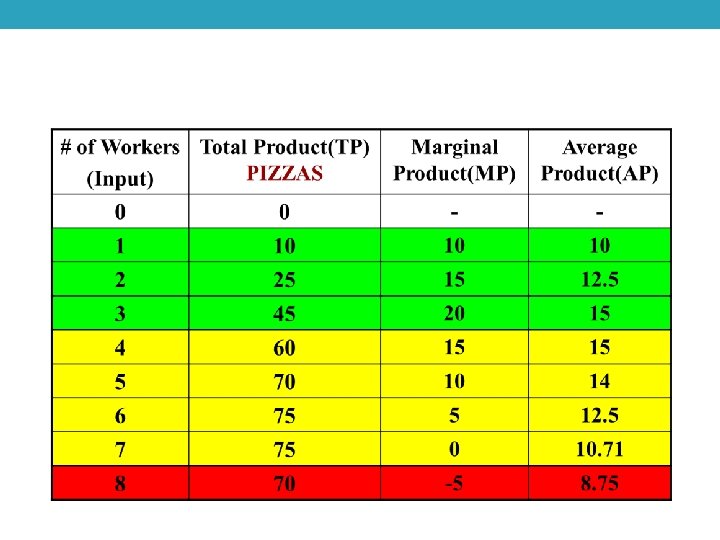
Three Stages of Returns • Stage I: Increasing Marginal Returns • MP is rising. TP is increasing at an increasing rate because of specialization
• Stage II: Decreasing Marginal Returns • MP is falling, TP is increasing at a decreasing rate because resources are fixed. Each work adds less and less.
• Stage III: Negative Marginal Returns • MP is negative, TP is decreasing because workers get in each others’ way.
Practice • Calculate MP and AP
Identify the three stages of returns
Examples 1. Learning curve when studying for an exam • Fixed Resources: amount of class time, textbook • Variable Resources – study time at home • Marginal Return • 1 st hour – large returns • 2 nd hour – less returns • 3 rd hour – small returns • 4 th hour – negative returns (tired and confused) 2. A farmer has fixed resources of 8 acres of planted corn. If he doesn’t clear weeds he will get 30 bushels. If he clears weeds once he will get 50 bushels. Twice – 57, three times – 60. Additional returns diminish each time.
COSTS OF PRODUCTION
Accountants v. Economists • Accountants look at only EXPLICIT COSTS • Payments paid by firms for using the resources of others • Ex: rent, wages, materials, electricity bills • Accounting Profit = TR – Accounting Costs • Economists examine both the EXPLICIT and IMPLICIT costs • The opportunity costs that firms “pay” for using their own resources • EX: Forgone Wage, Forgone Rent, Time • Economic Profit = Total Revenue – Economic Costs
SHORT-RUN PRODUCTION COSTS
Definition of the “Short-Run” • Short-run is NOT a set specific amount of time • The short-run is a period in which at least one resource is fixed • Plant capacity/size is NOT changeable • In the long-run all resources are variable • No fixed resources • Plant size/capacity is changeable
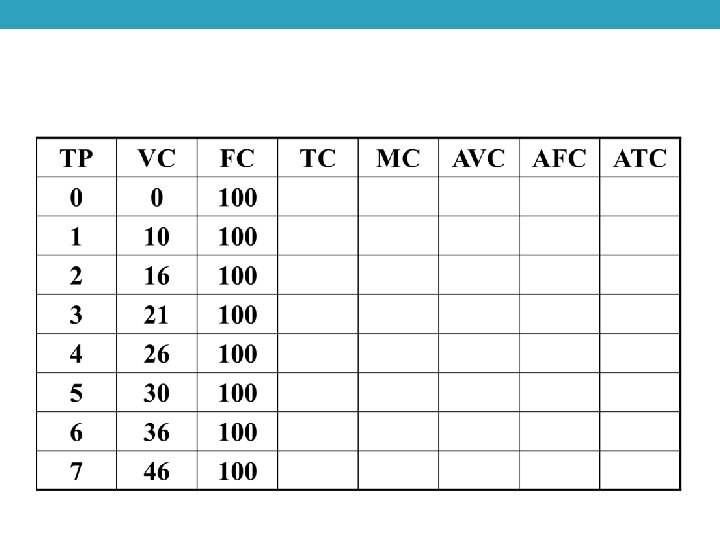
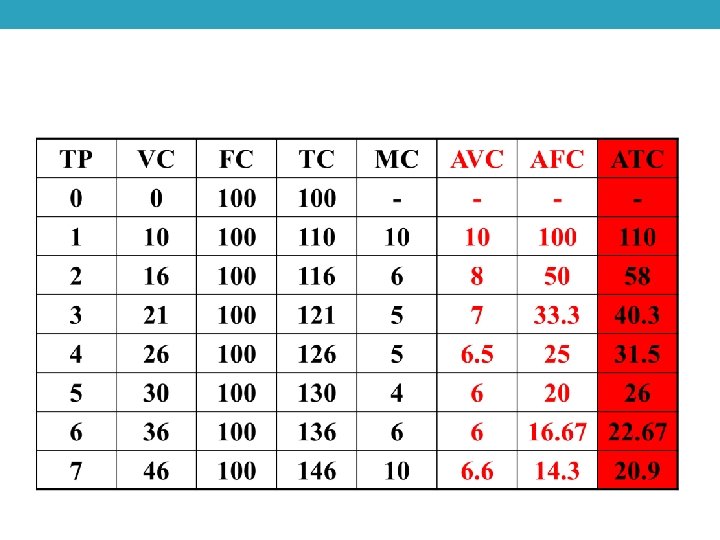
Different Economic Costs Total Costs • FC = Total Fixed Costs • VC = Total Variable Costs • TC = Total Costs Per Unit Costs • AFC = Average Fixed Costs • AVC = Average Variable Costs • ATC = Average Total Costs • MC = Marginal Cost
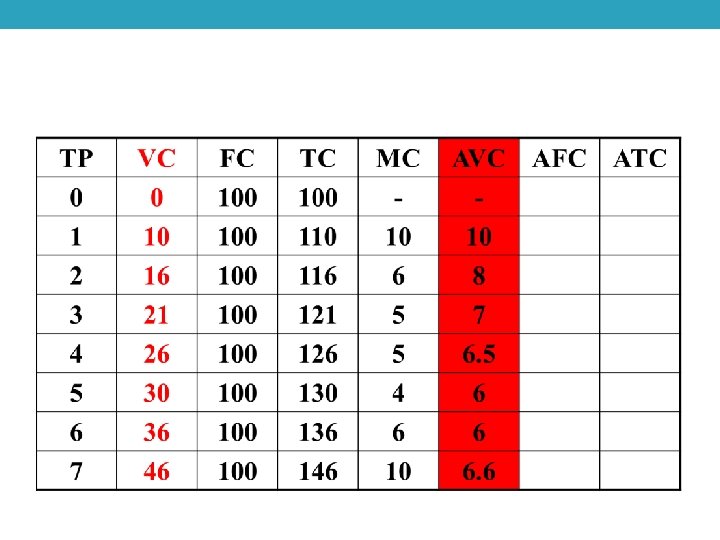
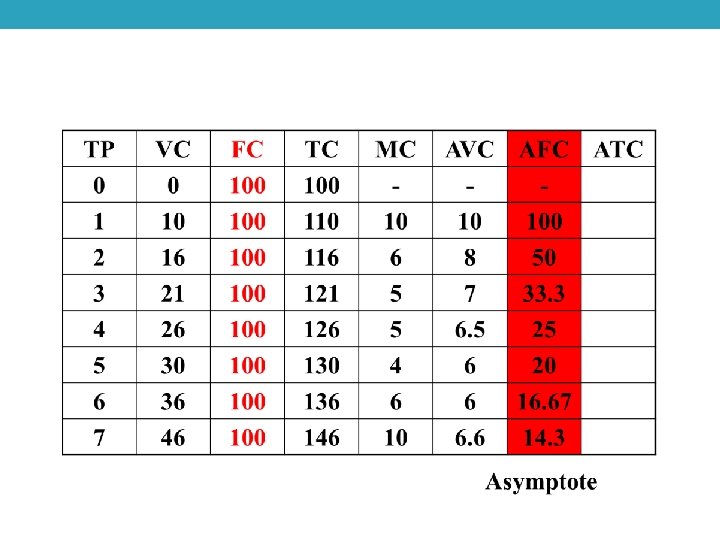
Definitions • Fixed Costs • Costs for the fixed resources that DON’T change with the amount produced • EX: Rent, Insurance, Managers Salaries • AFC = Fixed Costs Quantity • Variable Costs • Costs for variable resources that DO change as more or less is produced • EX: Raw Materials, Labor, Electricity • AVC = Variable Costs Quantity
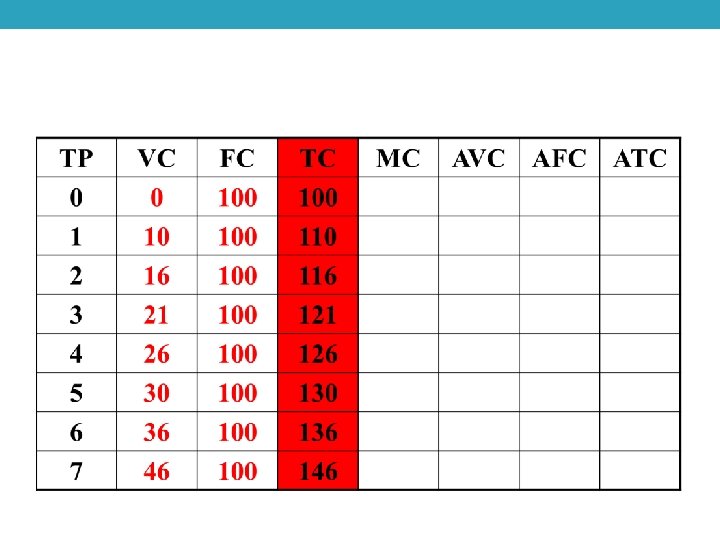
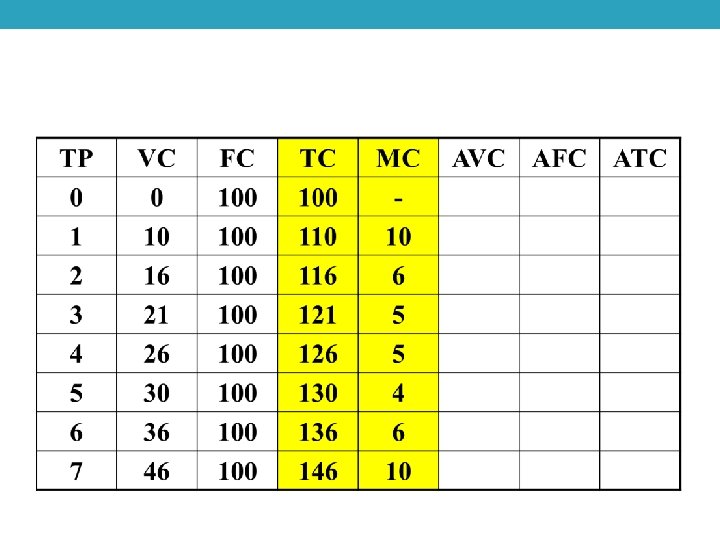
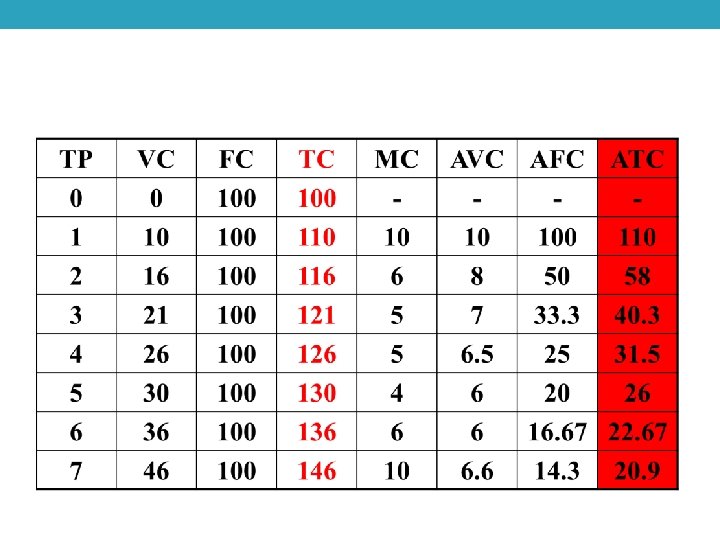
• Total Cost • Sum of fixed and variable costs • ATC = Total Costs Quantity • Marginal Cost • Additional cost of an additional output. • Ex: If the production of two more output increases total cost from $100 to $120, the MC is _______. • Marginal Cost = Change in Total Costs Change in Quantity
Calculating TC, VC, FC, ATC, AFC, and MC
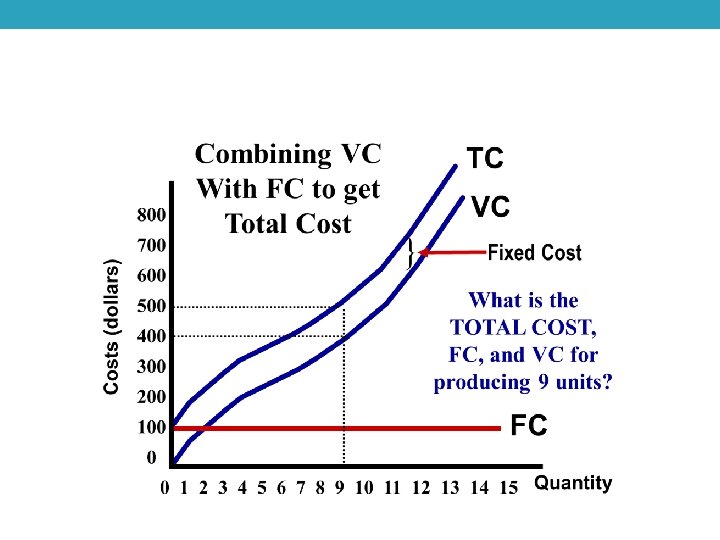
Total Costs Graphically
Per Unit Costs
Per-Unit Costs (Average and Marginal)
35 Per-Unit Costs (Average and Marginal) At output Q, what area represents: TC 0 CDQ VC 0 BEQ FC 0 AFQ or BCDE
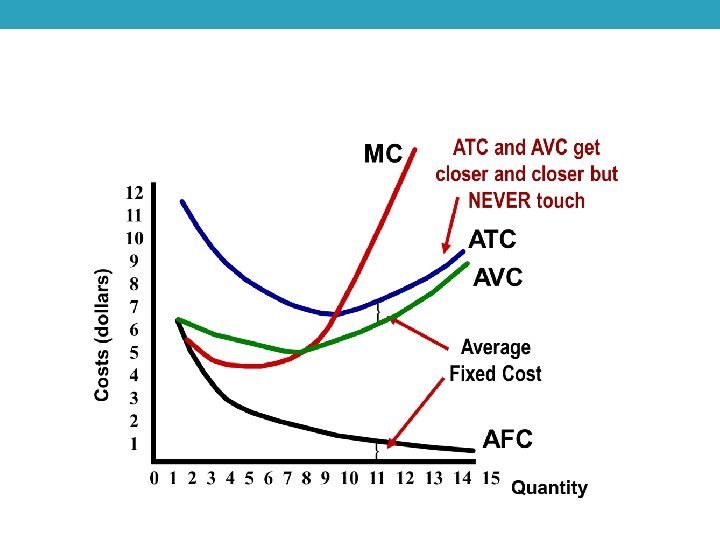
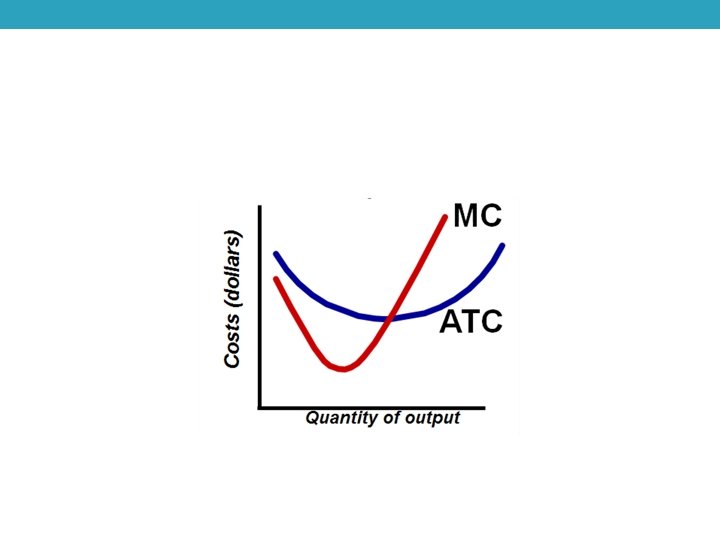
Why is the MC curve U-shaped?
Relationship between Production and Cost
Why is the MC curve U-shaped • The MC curve falls and then rises because of diminishing marginal returns • Example: • Assume the fixed cost is $20 and the ONLY variable cost is the cost for each worker ($10)
Why is the MC curve U-shaped • The MC curve falls and then rises because of diminishing marginal returns • Example: • Assume the fixed cost is $20 and the ONLY variable cost is the cost for each worker ($10)
Why is the MC curve U-shaped • The MC curve falls and then rises because of diminishing marginal returns • Example: • Assume the fixed cost is $20 and the ONLY variable cost is the cost for each worker ($10)
Why is the MC curve U-shaped • The MC curve falls and then rises because of diminishing marginal returns • Example: • Assume the fixed cost is $20 and the ONLY variable cost is the cost for each worker ($10)
Why is the MC curve U-shaped? • The additional cost of the first 13 units produced falls because workers have increasing marginal returns • As production continues, each worker adds less and less to production so the marginal cost for each unit increases.
Relationship Between Production and Cost • Why is the ATC curve U-shaped? • When the marginal cost is below the average down. • When the marginal cost is above the average, it pulls the average up • The MC curve intersects the ATC curve at it’s lowest point • Ex: • The average income in the room is $50, 000 • AN additional (marginal) person enters the room: Bill Gates • If the marginal is greater than the average, it pulls it up. • Notice that MC can increase but still pull down the average.