
COST THEORY Mikro Ekonomi BIAYA DALAM JANGKA PENDEK

COST THEORY Mikro Ekonomi
BIAYA DALAM JANGKA PENDEK • Fixed cost Any cost that does not depend on the firms’ level of output. These costs are incurred even if the firm is producing nothing. There are no fixed costs in the long run. • Variable cost A cost that depends on the level of production chosen. • Total cost (TC) Total fixed costs plus total variable costs. TC = TFC + TVC 2

BIAYA DALAM JANGKA PENDEK Average Fixed Cost (AFC) FIGURE 8. 2 Short-Run Fixed Cost (Total and Average) of a Hypothetical Firm Average fixed cost is simply total fixed cost divided by the quantity of output. As output increases, average fixed cost declines because we are dividing a fixed number ($1, 000) by a larger and larger quantity. 3
BIAYA DALAM JANGKA PENDEK • Average fixed cost (AFC) Total fixed cost divided by the number of units of output; a per-unit measure of fixed costs. • Spreading overhead The process of dividing total fixed costs by more units of output. Average fixed cost declines as quantity rises. 4
BIAYA DALAM JANGKA PENDEK • Total variable cost (TVC) The total of all costs that vary with output in the short run. • Total variable cost curve A graph that shows the relationship between total variable cost and the level of a firm’s output. 5

BIAYA DALAM JANGKA PENDEK Total Variable Cost (TVC) TABLE 8. 2 Derivation of Total Variable Cost Schedule from Technology and Factor Prices Units of Input Required Total Variable Cost Assuming Using (Production Function) PK = $2, PL = $1 Produce Technique K L TVC = (K x PK) + (L x PL) 1 unit of A 4 4 (4 x $2) + (4 x $1) = $12 put B 2 6 (2 x $2) + (6 x $1) = $10 2 units of output A 7 6 (7 x $2) + (6 x $1) = $20 B 4 10 A 9 6 B 6 14 out 3 units of output (4 x $2) + (10 x $1) = $18 (9 x $2) + (6 x $1) = $24 (6 x $2) + (14 x $1) = $26 6

BIAYA DALAM JANGKA PENDEK Total Variable Cost (TVC) FIGURE 8. 3 Total Variable Cost Curve In Table 8. 2, total variable cost is derived from production requirements and input prices. A total variable cost curve expresses the relationship between TVC and total output. 7
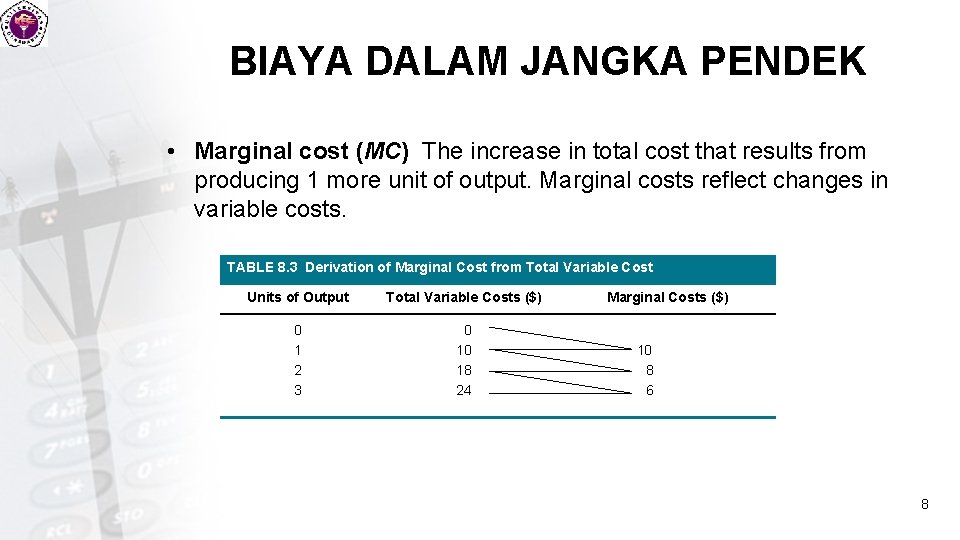
BIAYA DALAM JANGKA PENDEK • Marginal cost (MC) The increase in total cost that results from producing 1 more unit of output. Marginal costs reflect changes in variable costs. TABLE 8. 3 Derivation of Marginal Cost from Total Variable Cost Units of Output Total Variable Costs ($) 0 1 2 3 0 10 18 24 Marginal Costs ($) 10 8 6 8
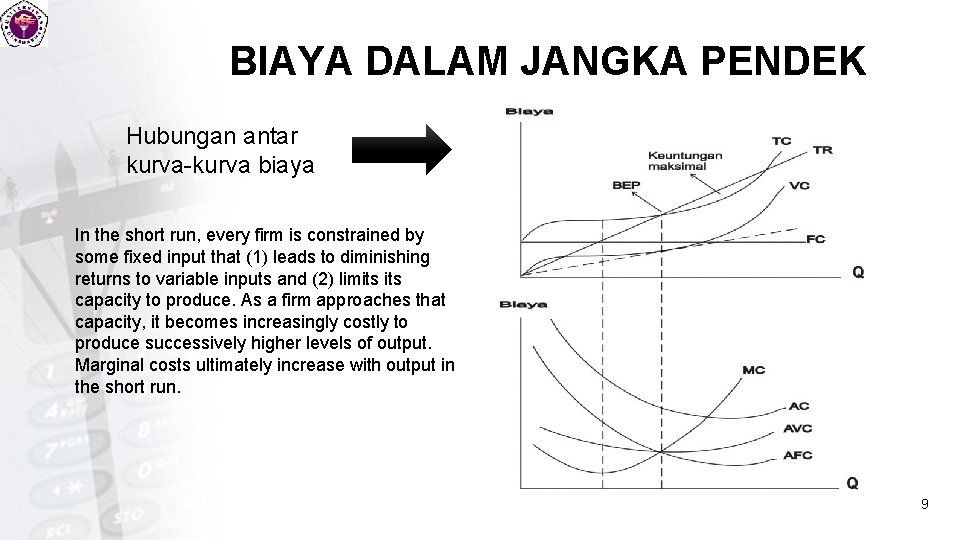
BIAYA DALAM JANGKA PENDEK Hubungan antar kurva-kurva biaya In the short run, every firm is constrained by some fixed input that (1) leads to diminishing returns to variable inputs and (2) limits capacity to produce. As a firm approaches that capacity, it becomes increasingly costly to produce successively higher levels of output. Marginal costs ultimately increase with output in the short run. 9
BIAYA DALAM JANGKA PANJANG • Long-run average cost curve (LRAC) The “envelope” of a series of short-run cost curves. • Minimum efficient scale (MES) The smallest size at which the long -run average cost curve is at its minimum. 10
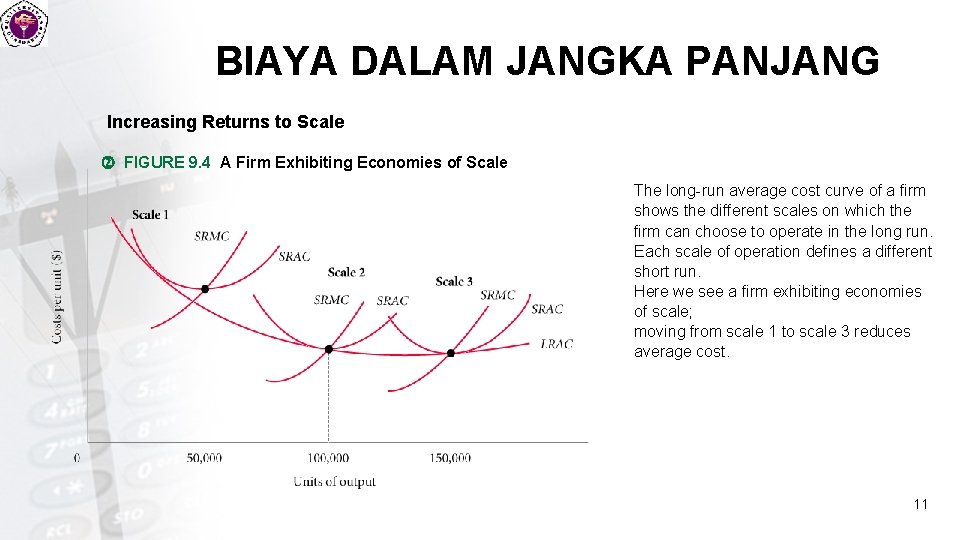
BIAYA DALAM JANGKA PANJANG Increasing Returns to Scale FIGURE 9. 4 A Firm Exhibiting Economies of Scale The long-run average cost curve of a firm shows the different scales on which the firm can choose to operate in the long run. Each scale of operation defines a different short run. Here we see a firm exhibiting economies of scale; moving from scale 1 to scale 3 reduces average cost. 11
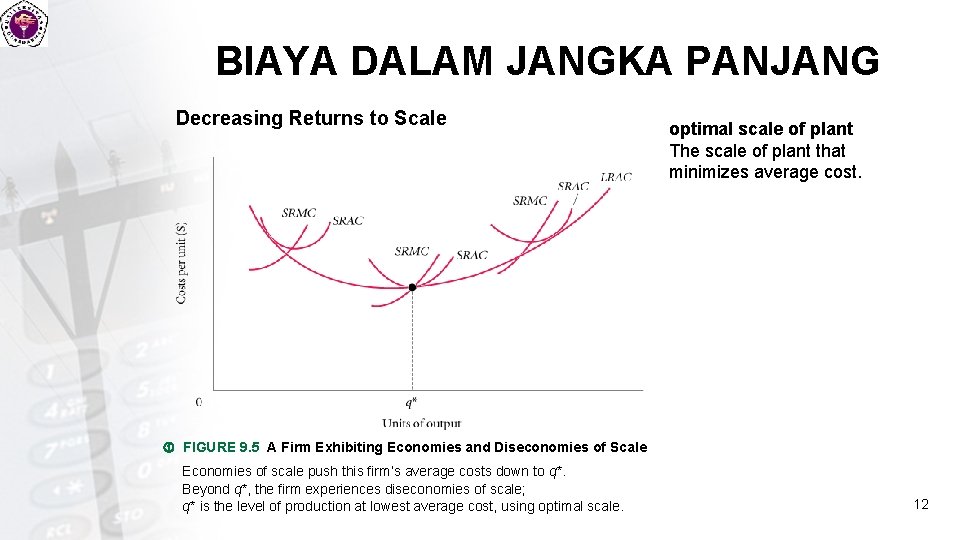
BIAYA DALAM JANGKA PANJANG Decreasing Returns to Scale optimal scale of plant The scale of plant that minimizes average cost. FIGURE 9. 5 A Firm Exhibiting Economies and Diseconomies of Scale Economies of scale push this firm’s average costs down to q*. Beyond q*, the firm experiences diseconomies of scale; q* is the level of production at lowest average cost, using optimal scale. 12
REFERENCES • Case, Karl E. , Ray C. Fair & Sharon M. Oster. 2013. Principles of Economics. Pearson Education Limited. • Rahardja, Pratama dan Mandala Manurung. 2010. Teori Ekonomi Mikro: Suatu Pengantar. Jakarta: LPFE-UI 13
- Slides: 13