Cosmic BackgroundRadiation Franceschini 2000 The Gunn Peterson Effect

Cosmic ‘Background’Radiation Franceschini 2000

The Gunn Peterson Effect z=5. 80 z=5. 82 z=6. 3 z=5. 99 z=6. 28 Fan et al Fan 2000 et al 2003 Cosmic reionization at z=6. 3 => opaque at l_obs<1 mm
 high z galaxies and QSOs Carilli, Bertoldi, Walter, Cox, Yun,")
Radio observations of (obscured) high z galaxies and QSOs Carilli, Bertoldi, Walter, Cox, Yun, Owen, Voss, Beelen, Omont, Fan, Strauss, Menten, Djorgovski, Mahabal, Dannerbauer, Lutz, Genzel, Gnedin, Hasinger 1. MAMBO and VLA observations of ‘submm’ galaxies: contribution of dusty starbursts to the cosmic star formation budget => formation of spheroidal galaxies? 2. Dust and molecular gas in high redshift QSOs: coeval starburst and AGN at high redshift => coeval formation of SMBH and host galaxies? 3. Observations of the highest redshift objects during the Epoch of Reionization. 4. HI 21 cm signal from the neutral IGM during the Eo. R.

MAMBO + IRAM 30 m Wide field imaging and photometry at 250 GHz : rms < 0. 5 m. Jy, res=10. 6”, field sizes >= 30’ Max-Planck Bolometer array: 133 pixel bolometer camera at 300 m. K, single mode horns (Kreysa)

Very Large Array 1. Wide-field imaging at 1. 4 GHz: rms=7 u. Jy, 1” res, Fo. V=30’ Astrometry => avoid confusion Imaging => AGN vs. Starburst, Lensing? cm-to-mm SEDs => redshifts, star formation rates unhindered by dust 2. Low order CO transitions at 20 to 50 GHz: rms < 0. 1 m. Jy, res < 1” Gas excitation and mass estimates Gas distribution and dynamics, Lensing?

Plateau de Bure Interferometer Imaging high order CO lines at 90 to 230 GHz: rms < 0. 5 m. Jy, res < 1” (15% of collecting area of ALMA)

Hughes et al. 1998 Rms=0. 5 m. Jy Peak=7 m. Jy Optical – 1 e 4 Galaxies SCUBA – 1 to 4 ‘Submm Galaxies’

Difficulty – Optically faint and confused Pd. BI/VLA position => K = 23. 5 (Dunlop et al. ) I – K > 5. 2 z = 4 +/- 1 S_250 = 2. 1 +/- 0. 3 m. Jy S_1. 4 = 16 +/- 4 u. Jy L_FIR=7 e 12 L_sun Grav. Mag. = 3 x ?
mm 350 GHz 250 GHz L_FIR = 1 e 12 x S_350(m.")
Magic of (sub)mm 350 GHz 250 GHz L_FIR = 1 e 12 x S_350(m. Jy) L_sun for z=0. 5 to 8

Dust obscured star formation at high z? 1000 x increase in CM density ULIRG to z=2 - 3 § Redshift distribution? Dominate SFRD at high z? (Hughes etal) § AGN contribution? § Relationship to other galaxy populations?

Possible analog – ULIRG MRK 273 30 kpc 100 pc Z=0. 037 L_FIR = 1 e 12 L_sun SFR = 300 M_sun/yr Size = 300 pc M_gas = 3 e 10 M_sun T_depletion =1 e 8 yr => ‘starburst’ P_ISM = 100 x P_disk

UV selected galaxies – large range in bolometric luminosity, but little correlation of L_uv and L_bol Adelberger 2000
 – significant overlap with")
Optically faint radio sources (S_1. 4 > 40 u. Jy) – significant overlap with (sub)mm galaxies Chapman et al. 2003; Richards 1999; Barger 1999 I=19 to 23 z=0. 1 to 1 spirals I>25 40% detection rate at S_350 > 6 m. Jy = (sub)mm galaxies? § Increase sample § Arcsecond positions § Redshifts – cm/mm and optical § Low z bias?

Mambo deep fields: bright faint source survey rms = 0. 5 to 2 m. Jy, Total area = 0. 5 deg^2 NTTDF A 2125 Lockman hole

Mapping procedure Raster scan at 4”/sec in AZ 1 hr/map over 240”x 200”, rms=2 m. Jy 2 Hz, 50” chop Dynamic sched: tau < 0. 2 Shift+Add + sky noise subtraction
 = 1 arcmin^-2")
VLA image: N(>40 u. Jy) = 1 arcmin^-2

‘Typical’ example: A 2125 -IRAM 1 K=21 I>25 § 70% of S_250 > 2 m. Jy have S_1. 4 > 30 u. Jy (SCUBA finds 60 – 70%)
 Dannerbauer et al.")
MAMBO sources in NTTDF with arcsec positions (VLA or Pd. BI) Dannerbauer et al. 2003
 § MAMBO:")
MAMBO/NTTDF SCUBA/8 m. Jy § Large range in K (> 4 mag) § MAMBO: median K (+limits) = 21. 5, I=25. 5 (or 70% have K > 20) vs. § SCUBA: median K (+limits) = 19. 6, 23. 4 (or 36% have K > 20) § 5/18 = EROs

NTTDF sources with Pd. BI positions: High redshift + Highly reddened?
: 1?")
Radio-Xray-MAMBO comparison 8/22 = Radio/Xray = intermediate z AGN? MAMBO/SCUBA (Eales et al): 1? /13 = Xray/MAMBO 6/9 in Lockman hole 8/13 = Radio/MAMBO = high z starbursts? 14/19 in NTTDF, A 2125
mm Galaxies: Xray observations of CDF-N Alexander et al. 2003 § 7/10")
AGN in (sub)mm Galaxies: Xray observations of CDF-N Alexander et al. 2003 § 7/10 = Xray/submm § 5/7 = AGN (flat spectrum) § N(H) = 1 e 23 cm^-2 § L_AGN = 1 e 43 -44 erg/s = 0. 1 x L_FIR
MM surveys Three brightest sources in MAMBO wide area survey are")
AGN in blind (SUB)MM surveys Three brightest sources in MAMBO wide area survey are AGN with variable non-thermal mm emission Z S_250 S_95 S_1. 4 1? 60 89 26 m. Jy 0. 29 19 26 24 1. 38 12 37 53 §Factor 2 more than expected §Good news for ALMA calibration?
 – consistent")
§ 100 src/deg^2 with S_250>3 m. Jy § High luminosity cutoff (nonevolving) – consistent w. ‘Lehnert/Heckman limit’: S_max = 3 m. Jy => L_max = 7. 5 e 11 L_sun L_SB, max = 7 e 11 (M_gas/1 e 10) L_sun

HST imaging – Chapman et al. 2003 § 85% interacting § Bigger than Ly Break galaxies (20 vs 10 kpc) § Lower surface brightness than LBGs
 Confirmation of optical identification 10 §")
Gas reservoirs: CO observations (Neri et al. 2003) Confirmation of optical identification 10 § dynamical mass ~ (2 -5) 10 M_sun § gas mass ~ (1 -7) x 1010 M_sun § 9/11 detected so far §

Clustering around known high z objects: Radio galaxy 1338 -1942 at z=4. 1 4 x overdensity of mm sources (de Breuck et al. 2003; Ivison et al. 2001) Clustering with other types of sources: Radio companions in 40%

Clustering – correlation functions Smail + 2003 § Very broad z distribution => angular correlation is washed-out § Statistics remain poor (10’s of sources) § Physical correlation => most strongly clustered of high z source populations (no evolutionary connection w. LBGs? )

Redshift distribution: Radio photometric redshifts

Radio photometric redshifts: assumptions and pitfalls L_1. 4 z=1 Garrett 2002 L_FIR Radio-FIR holds to high redshift? IC losses off CMB

Radio photometric redshifts: assumptions and pitfalls 55 K => z=4. 1 65 K => z=5. 1 Universal SED – temperature – redshift degeneracy (Blain 1999) Photometric redshifts for NTTDF MAMBO sources: radio vs. optical (ULIRG template SED)

Redshift distribution of MAMBO sources: radio photometric redshifts § 50% of radio detections in z=1. 5 to 3. 5 § radio non-detections: 35% at z>3. 5? Or cold dust (<30 K)? (or spurious sources? )
 z_med = 2. 4 50% in")
Spectroscopic redshifts: radio-selected sample (Chapman et al. 2003) z_med = 2. 4 50% in 1. 9 – 2. 8 Pitfalls: completeness (50 +/- 20%? ) Low redshift bias
mm galaxy population (Voss et al. 2003) § 60 um luminosity function")
Modeling the (sub)mm galaxy population (Voss et al. 2003) § 60 um luminosity function (Sanders) § SED – SLUGS sample (Dunne+Eales) § Luminosity evolution § High Lum. Cut-off, independent of z

Submm BG 60 um counts
mm galaxies to cosmic star formation Comparable SFR at high z in")
Contribution of (sub)mm galaxies to cosmic star formation Comparable SFR at high z in dusty starbursts as LBGs?
mm Galaxy Properties § z_med = 2. 4, 50% in z=1. 5 to 3.")
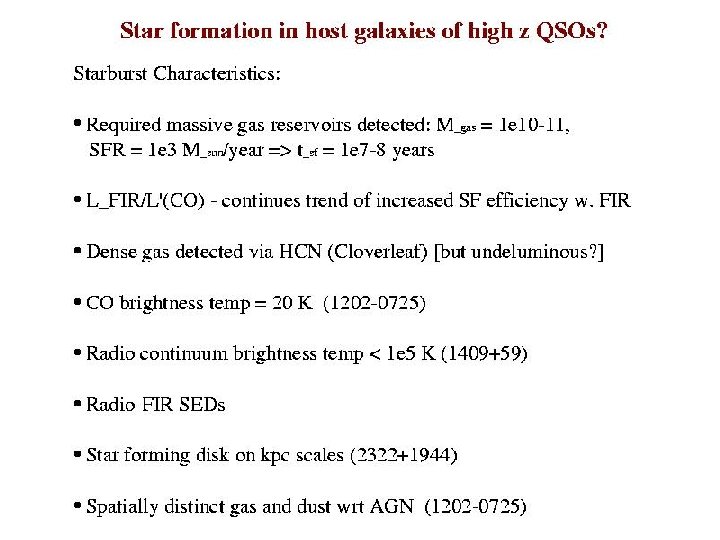
(sub)mm Galaxy Properties § z_med = 2. 4, 50% in z=1. 5 to 3. 5, What fraction lies at z > 4 ? § 70% have S_1. 4 > 30 u. Jy; 50(+/- 20)% have K > 20 § L_FIR = 1 e 13 L_sun, SFR = 1 e 3 M_sun/yr § 1000 x CM density wrt low z ULIRGs; comparable SFRD to LBGs § 30% are EROs (R-K > 6), comprise 10% of ERO population § Only 10% of LBGs are (sub)mm gals; clustering => no evolutionary connection? § 50(+/- 20)% host AGN, but L_AGN = 0. 1 x L_bol § Optically brighter: interacting galaxies, high gas/dyn mass § Highly clustered (but hard to quantify) § S_250>10 m. Jy => pop. dominated by flat spectrum AGN
mm galaxies (corrected for duty cycle) = 1 e -4 Mpc^-3")
§ CM density (sub)mm galaxies (corrected for duty cycle) = 1 e -4 Mpc^-3 = CM density of > L* ellipticals => Elliptical galaxy formation via major mergers at z = 2 to 3 (Smail et al. , Barger et al. , Lilly et al. , Voss…)? § Strong clustering of submm galaxies § High stellar densities in E/S 0 cores = gas densities in ULIRGs (Kormendy and Sanders 1992) § EROs are old, z = 1 ellipticals => z_f > 2 (Daddi 1999) § Stellar ages and uniform properties of low z ellipticals => z_f > 2 (Renzini, Ellis) => (sub)mm galaxies are revealing the formation of large (cluster) elliptical galaxies in massive starbursts at z=2 to 3 (1000 M_sun/yr over 1 e 8 yrs)?

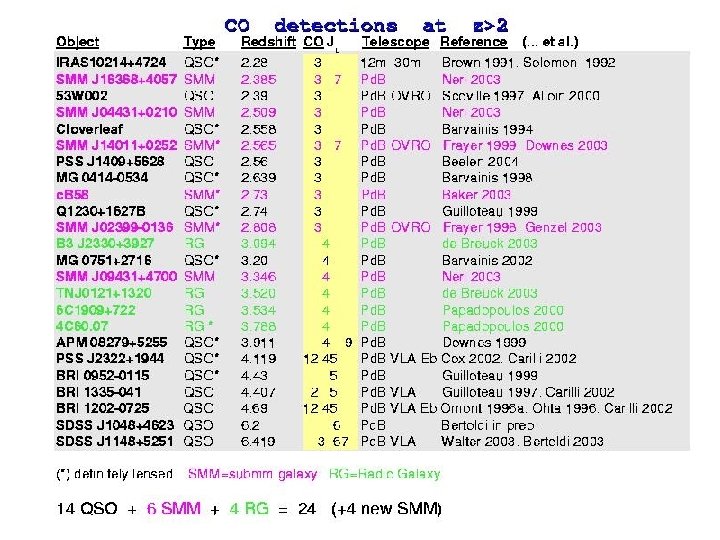
High redshift QSOs SDSS + DPOSS: 700 at z > 4 30 at z > 5 7 at z > 6 M_B < -26 => L_bol > 1 e 14 L_sun M_BH > 1 e 9 M_sun Hunt 2001

QSO host galaxies – M_BH – sigma relation • Most low z spheroidal galaxies have SMBH • M_BH = 0. 002 M_bulge Þ‘Causal connection between SMBH and spheroidal galaxy formation’ (Gebhardt et al. 2002)? § Luminous high z QSOs have massive host galaxies (1 e 12 M_sun)

MAMBO surveys of z>2 DPSS+SDSS QSOs 2322+1944 z=4. 1 1148+56 z=6. 4 • 30% of luminous QSOs have S_250 > 2 m. Jy, independent of redshift from z=1. 5 to 6. 4 • L_FIR = 1 e 13 L_sun = 0. 1 x L_bol : Dust heating by starburst or AGN?
 w. VLA (22 GHz): L_FIR")
0. 8 m. Jy 2322+1944 z=4. 12 CO(1 -0) w. VLA (22 GHz): L_FIR = 3 e 13 L_sun M(H_2) = 1 e 11 M_sun

A Molecular Einstein Ring: VLA 45 GHz observations of CO 2 -1 emission from the gravitationally lensed QSO 2322+1944 at z=4. 12 (Carilli et al. 2003; Djorgovski et al. 2003) Res=0. 5”, s =50 u. Jy Keck Rband VLA CO 2 -1 2”
)^-2")
DV = 250 km/s/kpc M_dyn= 4 e 10 (sin(i))^-2

2322+19: Lens Model CO spatially separated from QSO by 2 kpc => disk?

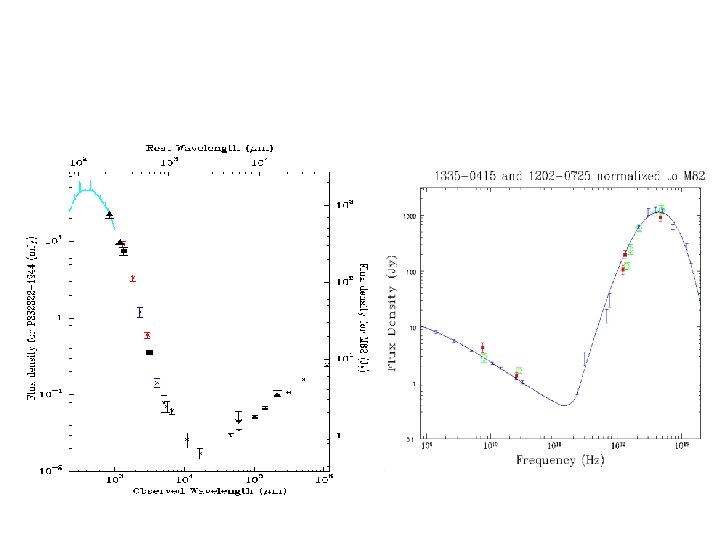
Rad-FIR SED=M 82 => Coeval galaxy and formation SMBH?

CO + HST submm 1. 4 GHz + optical
 • bench-mark in cosmic structure formation")
History of IGM Epoch of Reionization (Eo. R) • bench-mark in cosmic structure formation indicating the first luminous structures

The Gunn Peterson Effect z=5. 80 z=5. 82 z=5. 99 z=6. 28 Fan et al 2003 Fast reionization at z=6. 3 => opaque at l_obs<1 mm f(HI) > 0. 001 at z = 6. 3
: ‘Cosmic Phase transition’ HI fraction Ionizing intensity density")
Evolution of the neutral IGM (Gnedin): ‘Cosmic Phase transition’ HI fraction Ionizing intensity density Gas Temp
 •")
Thompson => polarization WMAP Largescattering scale polarization of CMB (Kogut et al. ) • Large scale structure (10’s deg) = Thompson scattering at Eo. R • t_e = Ln_es_e =0. 12 to 0. 17 => F(HI) < 0. 5 at z=20 GP + WMAP => Reionization Process is complex, extending from z~20 -6? (200 -800 Million years after Big Bang)

Near-edge of reionization: GP Effect White et al. 2003 Fan et al. 2002 Fairly Fast f(HI) > 1 e-3 at z >= 6. 4 (0. 87 Gyr) f(HI) < 1 e-4 at z <= 5. 7 (1. 0 Gyr) Problem: t_Lya >> 1 for f(HI) > 0. 001

Objects within Eo. R: QSO 1148+52 at z=6. 4 • highest redshift quasar known • L_bol = 1 e 14 L_sun • central black hole: 1 -5 x 10⁹ Msun (Willot etal. ) • clear Gunn Peterson trough (Fan etal. )

1148+52 z=6. 42: MAMBO detection S_250 = 5. 5 m. Jy => L_FIR = 1. 3 e 13 L_sun, M_dust =7 e 8 M_sun +

VLA Detection of Molecular Gas at z=6. 419 46. 6149 GHz CO 3 -2 -1 50 MHz ‘channels’ (320 kms , Dz=0. 008) noise: ~57 m. Jy, D array, 1. 5” beam Off channels § M(H_2) = 2 e 10 M_sun § Size < 1. 5” (image), § Size > 0. 2” (T_B/50 K)^-1/2
 (7 -6) (3 -2) •")
IRAM Plateau de Bure confirmation n 2 (6 -5) (7 -6) (3 -2) • FWHM = 305 km/s • z = 6. 419 +/- 0. 001 • Tkin=100 K, n. H 2=105 cm-3

VLA imaging of CO 3 -2 at 0. 17” resolution § Two sources of 0. 2” in size and 0. 20 m. Jy => T_B = 20 K § ULIRGs: T_B (CO 2 -1) = 15 to 50 K (Downes and Solomon 1998), but size is 10 x smaller § Separation = 0. 3”=2 kpc => Mdyn=4 e 10 Msun(sin i)-2 § Merging galaxies? rms=40 u. Jy at 47 GHz

Phase stability: Fast switching at the VLA 10 km baseline rms = 10 deg

1148+52: starburst+AGN? VLA A array: S_1. 4=46+/-26 u. Jy SFR = 3000 M_sun/year => coeval formation of SMBH and host galaxy?
1148+52 = 7 e 8 M _sun • M(H_2)")
1148+52: Masses Mass estimates • M(dust)1148+52 = 7 e 8 M _sun • M(H_2) = 2 e 10 M_sun • M_dyn = 4 e 10 (sin i)-2 M_sun • M_BH = 3 e 9 M_sun M_BH–s => M_bulge = 1 e 12 M_sun ? • Gas/dust = 30, typical of ULIRGs • Dynamical vs. gas mass => baryon dominated, face-on disk – consistent with blue QSO (rest-frame) spectrum • Dynamical vs. ‘bulge’ mass => M – s breaks-down at high z?
 time 1/16 T_univ")
Cosmic (proper) time 1/16 T_univ

Timescales 1148+52: Timescales for 1148+52 • Age of universe: 8. 7 e 8 yr • Time since ‘start of reionization’ (z=20? ): 6. 9 e 8 yr • SMBH formation (n x 1/e): n x 4 e 7 yr (Loeb, Wyithe, …) • Elliptical galaxy (star) formation: 3 e 7 yr • Cosmic Stromgren sphere creation (= QSO activity): 1 e 7 yr • C, O production (3 e 7 M_sun): 1 e 8 yr • Fe production (SNe Ia): few e 8 yr (Maiolino +, Freudling +) ÞSF ‘activity’ started early (z > 10), QSO later (Wyithe +) ? • Dust formation: 1. 4 e 9 yr (AGB winds) => dust formed in high mass stars/SNR (Dunne et al. . 2003)? => silicate grains?

Ionizing sphere around QSO • accurate redshift from CO: z=6. 419 (optical high ionization lines can be off by 1000 s km s-1) • proximity effect: Photons leaking from 6. 32<z<6. 419 White et al. 2003 z=6. 32 • Direct Evidence that we are witnessing Re-Ionization of Universe! • ionized sphere around QSO: R = 4. 7 Mpc ‘time bounded’ Stromgren sphere: t_qso= 1 e 5 R^3 f(HI)= 1 e 7 yrs (Haiman and Cen)

Loeb-Rybicki halos
 § GP =>")
Constraints on neutral fraction at z=6. 4? (Wyithe and Loeb 2003) § GP => f(HI) > 0. 001 § If f(HI) = 0. 001, then t_qso = 1 e 4 yrs – implausibly short (see also J 1030+0524 z=6. 28) § Probability arguments suggest: f(HI) > 0. 1 at z=6. 4 – much better limit than GP => Very Fast Reionization (F(HI) < 1 e-4 at z=5. 7)
: ‘superluminal’ ionization front § Stromgren sphere expands at close to speed")
White etal (2002): ‘superluminal’ ionization front § Stromgren sphere expands at close to speed of light => obs Ly a photons emitted just after ionizing photons § “Delay required to allow light to travel from source to the edge of the sphere is exactly compensated by the ‘speedup’ that results from that edge being closer to the observer” § “Expansion law for the observed radius is exactly the same as the expansion law derived ignoring light-travel effects”
")
Gravitational Lensing? § Keck near IR imaging: source < 0. 5” at K (Djorgovski) § ACS imaging: point source (Fan priv comm) § CO: Extended by 0. 3” § Radio continuum: Foreground cluster, z=0. 3 => magnification by 2 x?
 galaxy: Far")
Gas and dust in the first galaxies • Luminous (star forming? ) galaxy: Far IR Luminosity = 1 e 13 Lsun at z=6. 42 • Massive (merging? ) galaxy: Molecular gas mass = 2 x 10¹⁰ M_sun, M_dyn = 4 e 10 (sin i)-2 M_sun • Very rapid enrichment of heavy elements and dust produced in the first stars => star formation commenced at 0. 5 Gyr after the big bang • Coeval formation of SMBH + stars in earliest galaxies (break-down of M-s at high z? ) • Cosmic Stromgren sphere of 4. 7 Mpc => witnessing process of reionization => t_qso = 1 e 7 * f(HI) yrs => ‘fast’ reionization: f(HI)>0. 1 at z=6. 4?

J 1048+4637: A second CO source at z=6. 2 CO 6 -5

Cloverleaf – z=2. 56, Grav. Lens mag. 11 x VLA detection of HCN emission at 22 GHz => n(H_2) > 1 e 5 cm^-3 (vs. CO n(H_2) > 1 e 4 cm^-3) (Solomon, vd Bout, Carilli)
, Pd. BI CO")
ALMA/EVLA/GBT redshift coverage for CO Epoch of Reionization VLA CO(3 -2), Pd. BI CO 6 -5, 7 -6 in J 1148+5251 @ z=6. 42 +other lines: HCN, HCO+, CII, H 2 O, O 2
: Probing the Eo. R! • Study physics of the first")
The Future (is now): Probing the Eo. R! • Study physics of the first luminous sources • This can only be done at near-IR to radio wavelengths • Currently limited to pathological systems (‘HLIRGs’) • SKA and ALMA 10100 x sensitivity is critical for study of ‘normal’ galaxies z=6. 4

SKA Design Goals • Max. Baselines CO/molecules: at least 50% at < 30 km Synchrotron: baselines out to > 1000 km • Frequency range - at least to 22 GHz - major gains if extended to 40 GHz

2322+1944 1. 4 GHz VLA Radio continuum is cospatial w. molecular gas+dust, not AGN ÞStar forming disk of radius 2 kpc surrounding QSO w. SFR (>5 M_sun) = 2000 M_sun/yr
 = 1 e")
1409+56 z=2. 58: CO emission M_dust =1 e 8 M_sun, M(H_2) = 1 e 10 M_sun
")
Objects within the Eo. R: Star forming galaxy at z=6. 56 (Hu et al)
 § SKA/ALMA – comparable speed")
SKA and ALMA: Optimal CO searches (Carilli & Blain) § SKA/ALMA – comparable speed at 22 GHz, SKA clearly faster at 43 GHz (Fo. V, fractional bandwidth, sensitivity) § SKA/ALMA – complementary: high vs. low order transitions

SKA and CO M 82

Radio studies of the first luminous objects Radio Continuum studies of star forming galaxies 1 e 13 L_sun 1 e 12 L_sun 1 e 11 L_sun CO (+other molecules) at z>4 VLA: 3 s in 3 hrs for L_FIR = 1 e 13 M_sun (‘HLIRG’) SKA (20 – 40 GHz): 3 s in 3 hrs for L_FIR =1 e 11 M_sun (‘LIRG’)

CO results • Molecular Gas mass: MH 2 = 2 x 10¹⁰ Msun • Size limits: 0. 2”<D<1. 5” (1”=5. 6 kpc) • FWHM = 305 km/s • Dynamical Mass: Mdyn=(3 -14)x 109 Msun (sin i)-2 • precise redshift z=6. 419 • Star formation rate = 3000 M_sun/yr • mass in C and O: ~3 x 10⁷ Msun; -> ISM enrichment must have started at z>8
 CO, dust emission at z>2: L_FIR = 2")
Cloverleaf: z=2. 56 • Largest (apparent) CO, dust emission at z>2: L_FIR = 2 e 14 L_sun • Optical spectrum => QSO, M_v = -29 • Imaging => gravitationally magnified by factor 11 CO 7 -6 contours HST greyscale (Alloin et al. )

Weak correlation of L_FIR – M_B? • M_B > -26: 10% detected at 250 GHz m. Jy sensitivity • M_B < -26: 30% detected Dust heating: AGN vs. Star Formation (1 e 3 M_sun/yr)?
 => gas 300 Index=1 40 Index=1. 7 §Inceased")
CO vs. FIR luminosity: dust (always) => gas 300 Index=1 40 Index=1. 7 §Inceased star formation efficiency with FIR luminosity? §AGN contribution to dust heating? § M(H_2) = X * L’(CO) where X = 4 (galaxy), = 0. 8 (ULIRGs) => M(H_2) = 1 e 10 to 1 e 11 M_sun for FIR-luminous z>2 QSOs

z = 2 sample 1409+56
 = 1 e")
1409+56 z=2. 58: CO emission M_dust =1 e 8 M_sun, M(H_2) = 1 e 10 M_sun

Z=2 sample: radio observations • 8/8 of FIR-luminous QSOs detected at 1. 4 GHz at = 0. 14 to 1. 0 m. Jy • 3/8 non-FIR-luminous QSOs detected, and all 3 are < 0. 17 m. Jy FIR luminous z=2 QSOs follow Radio-FIR correlation for star forming galaxies

B 1202 -0725 at z=4. 7 0. 6” VLA CO 2 -1: Size/component = 0. 3” = 2 kpc 0. 3” Ly a (Hu) + radio cont. § Single optical QSO § Double radio/CO/dust source: starburst companion at 30 kpc? M(H_2) = 1 e 11 M_sun §T_B (CO 2 -1) = 25 K § ULIRGs: T_B (CO 2 -1) = 15 to 50 K (Downes and Solomon 1998), but size is 10 x smaller

1409+56 VLA + VLBA images at 1. 4 GHz 1410 T_B < 1. 2 e 5 K = ‘Condon starburst/AGN limit’ S_1. 4=1 m. Jy 2” 0. 1” F_1. 4<0. 2 m. Jy/beam • Mixed thermal +non-thermal: free-free absorption limits T_B < 1 e 5 K • Empirically followed by low z star forming galaxies
 • CO measures")
HCN in starbursts: star forming gas tracer (Solomon & Gao 2000) • CO measures total molecular gas: non-linear with L_FIR • HCN measures dense gas directly associated with star formation: linear w. L_FIR => SF efficiency (SFR/total gas mass) rises w. L_FIR, % of dense gas rises with L_FIR • Cloverleaf: under-luminous in HCN => some dust heating by AGN? Cloverleaf

z = 4 sample 2322+19
 > 1 e 5 cm^-3, T > 70 K")
CO excitation: LVG models n(H_2) > 1 e 5 cm^-3, T > 70 K => typical of active star forming regions

z > 6 sample – probing the Eo. R
- Slides: 95