Correlations MODULE 6 Correlational Study Correlationships Collects a

 Collects a set of facts organized into two or more categories")


 so does the")


 The false belief that")

- Slides: 23
Correlations MODULE 6
Correlational Study Cor(relationships) Collects a set of facts organized into two or more categories measure parents’ disciplinary style measure children’s behavior Examine the relationship between categories Correlation reveals relationships among facts e. g. , more democratic parents have children who behave better Correlational study does not determine why the two variables are related--just that they are related. Correlational studies are helpful in making predictions.
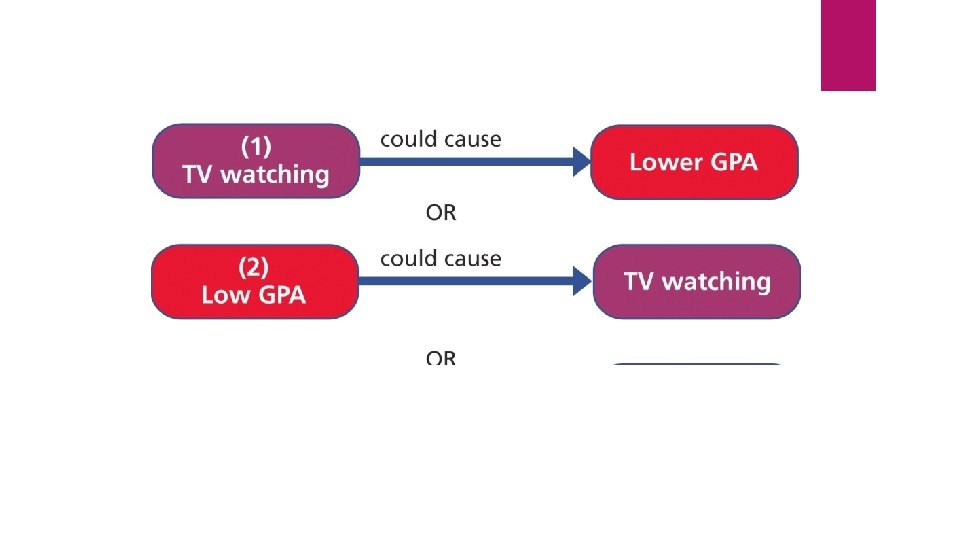
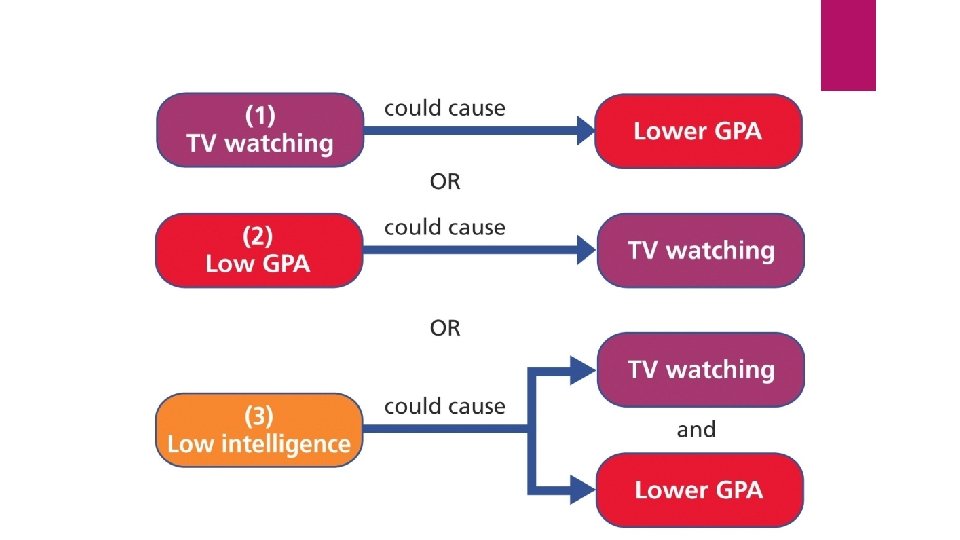
Correlational Study Correlation CANNOT prove causation Do democratic parents produce better behaved children? Do better behaved children encourage parents to be democratic? May be an unmeasured common factor e. g. , good neighborhoods produce democratic adults and well-behaved children Doesn’t mean they are not useful – Correlation in smoking (3 min). They can tell us what we need do an experiment on.
Correlations only show strength of relationships. • Helpful for making predictions • They do not show the direction the relationship works. • They do not reveal if there is another variable that could be causing the relationship.
Correlation Does NOT Mean Causation There is a strong +. 90 correlation in shoe size and IQ. Does this mean that a large shoe size is the cause for higher intelligence? What else could explain this? YOUR FEET GROW AS YOU GET OLDER & WISER
Correlation – shows the relationship between two variables. • The closer to + or – 1. 0 the stronger the relationship between the two variables. • This enables us to predict. However, correlation does not mean causation.
Correlations Are Shown in 2 Ways: Coeffecient Scatterplots
How to Read a Correlation
Coefficient of Correlation Numerical indication of magnitude and direction of the relationship between two variables Positive correlation—two variables vary systematically in the SAME direction When you’re in a positive relationship, you want to do everything together. Negative correlation—two variables vary systematically in OPPOSITE directions When you’re in a negative relationship, you want to be away from each other.
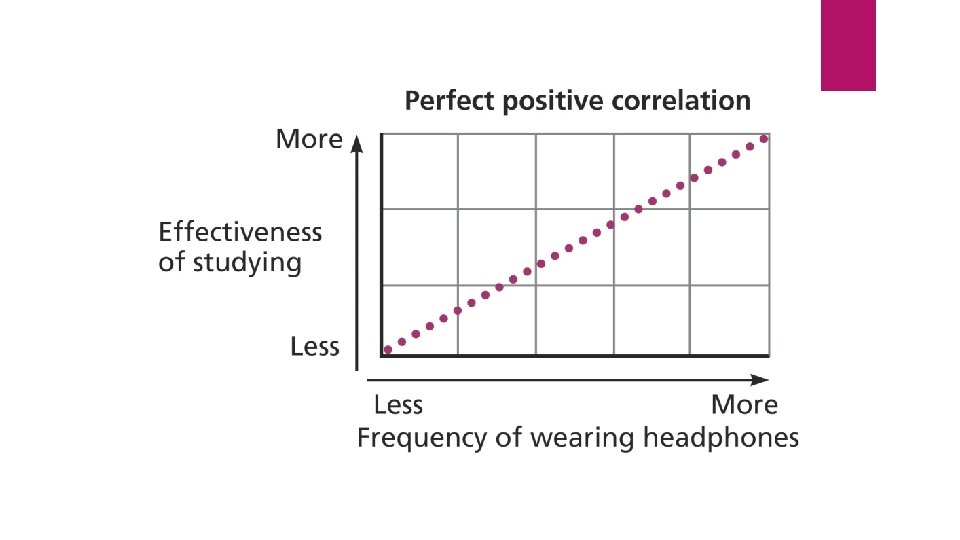
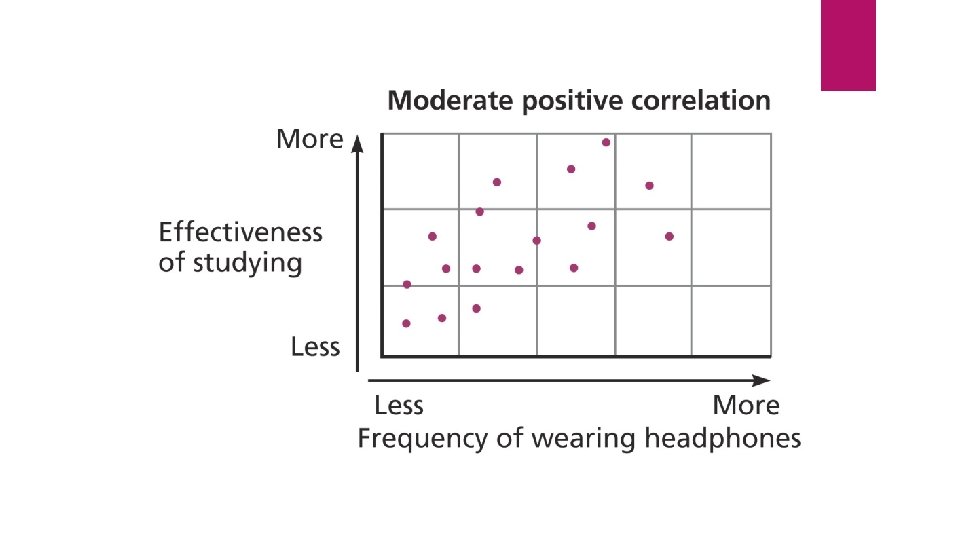
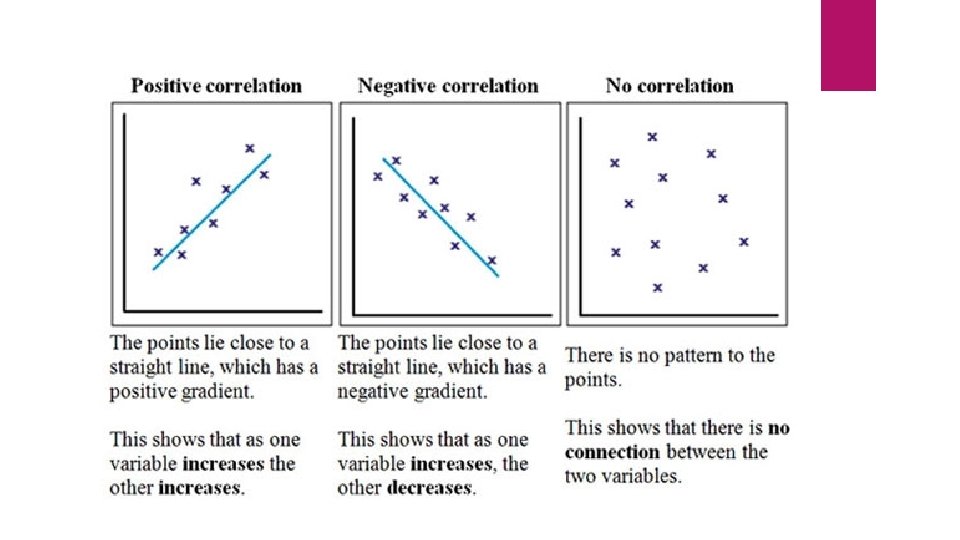
Positive/Direct Correlation As the value of one variable increases (or decreases) so does the value of the other variable. A perfect positive correlation is +1. 0. The closer the correlation is to +1. 0, the stronger the relationship.
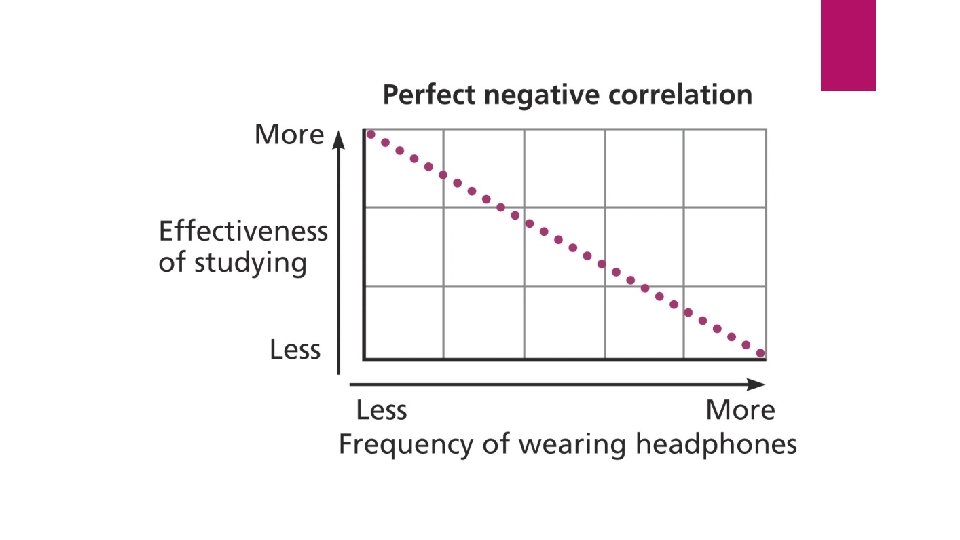
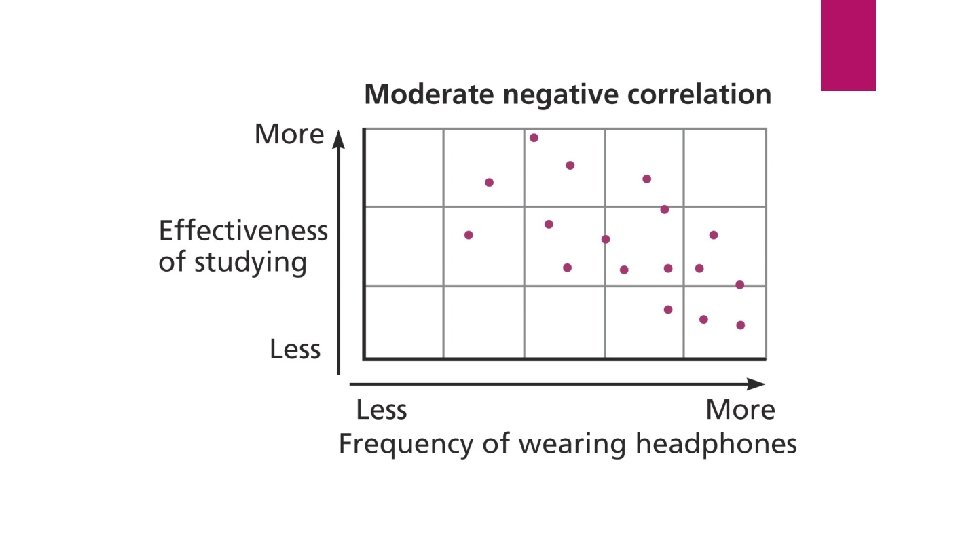
Negative/Inverse Correlation As the value of one variable increases, the value of the other variable decreases. A perfect negative correlation is -1. 0. The closer the correlation is to -1. 0, the stronger the relationship.
Zero Correlation There is no relationship whatsoever between the two variables.
Let’s Review
Which correlational coefficient below indicates the strongest possible relationship? A. -. 89 B. +. 68 C. +2. 00 D. -. 45 E. +. 25 A. is the answer! Why? • The + and – only indicate the direction of the relationship, NOT how big the number is. • When doing these, cover up the + & - and go with the answer closest to 1. 0 • +2. 00 does not work because you cannot have a correlation greater than 1. 00 = 100%).
Illusory Correlation – Believing in relationships that don’t exist. (Superstitions) The false belief that there is a relationship between random events, actions and behaviors when, in fact, no relationship exists (it’s simply coincidence). Influenced by Confirmation Bias – look for info to confirm our belief in the relationship and ignore evidence to the contrary. Example: A football fan believes that every time he wears a specific jersey his team wins, so each time they play, he will only wear that jersey. Example: Arthritis hurts more in cold weather. Example: Wet hair in cold weather & catching a cold virus. Example: Pregnant cravings & the sex of the child. Example: Stereotypes for groups. Need More Examples?
Remembering the Difference