Correlations are relationships between two variables n If

Correlations are relationships between two variables. n If there is a correlation, it is either positive or negative. n ¨ Ex. Number of hours worked & paycheck positive ¨ Ex. Days present from school & days absent from school negative n If there is no relationship between variables, then there is no correlation. ¨ Ex. age and length of hair

Positive Correlations Trend Line Because the data follow a trend line that has a positive slope, this is a positive correlation. Because the data are spread out, it is a weak, positive correlation.

Negative Correlations Trend Line Because the data are close to a trend line that has a negative slope, it is a strong, negative correlation.

No Correlation You can not draw a trend line because there is no trend in the data. Therefore, there is no correlation.

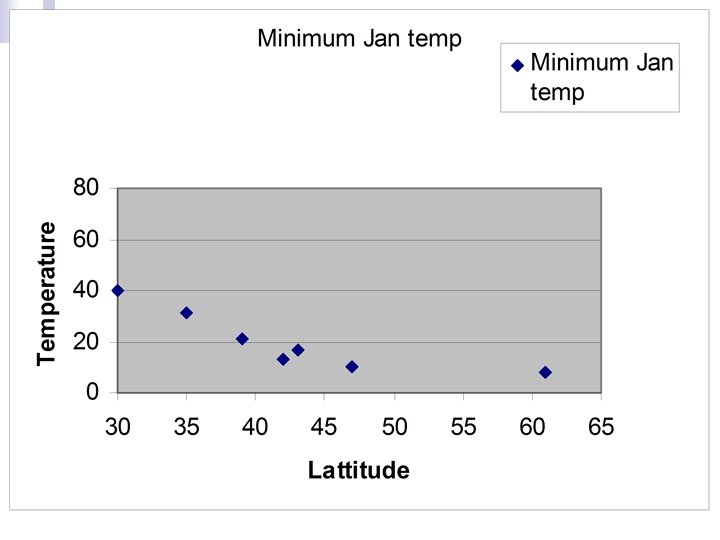
What Kind of Correlation Is It? Negative Correlation

What Kind of Correlation Is It? Positive Correlation V 1: number of teenagers in the house V 2: amount of time the phone is used

What Kind of Correlation Is It? Positive Correlation

What Kind of Correlation Is It? No Correlation V 1: number of cars you own V 2: how much salt you eat

What Kind of Correlation Is It? No Correlation

What Kind of Correlation Is It? Negative Correlation V 1: The number of rainy days per year V 2: The number of dry days per year


n n n What is the trend of the data? What type of correlation does this scatterplot represent? If a student studied for 1/4 of an hour, interpolate the grade he/she should receive.
 6.")
You Try! n n Make a scatterplot of the following data. Foot (in) 6. 5 12 10 7 9 11 7 7 9 Height (in) 60 72 66 63 66 69 62 64 63 Draw a trend line (line of best fit) on your scatterplot. If a person is 68 inches tall, how big do you expect his foot to be according to your trend line? If a person has an 8 inch foot, how tall would you expect her to be?

You Try Scatterplot

You Try Scatterplot


Correlation ______ are relationships between two variables. n If there is a correlation, it is either ____ or ______. n ¨ Ex. Number of hours worked & paycheck (___) ¨ Ex. Days present from school & days absent from school (_______) n If there is no relationship between variables, then there is __________. ¨ Ex. age and length of hair ¨ Why? ________________

Positive Correlations Because the data follow a trend line that has a ______, this is a positive correlation. Because the data are spread out, it is a _______, positive correlation.

Negative Correlations Because the data are close to a trend line that has a ______, it is a strong, negative correlation.

No Correlation You can not draw a trend line because there is no trend in the data. Therefore, there is __________.
- Slides: 21