Correlation Prof Andy Field Aims Measuring Relationships Scatterplots


 1. 2. 3. Cause and")


biserial correlation • Point-biserial correlation, rpb: relationship between – a continuous variable and –")


- Slides: 37
Correlation Prof. Andy Field
Aims • Measuring Relationships – Scatterplots – Covariance – Pearson’s Correlation Coefficient • Nonparametric measures – Spearman’s Rho – Kendall’s Tau • Interpreting Correlations – Causality • Partial Correlations
What is a Correlation? • It is a way of measuring the extent to which two variables are related. • It measures the pattern of responses across variables.
Slide
Slide
Slide
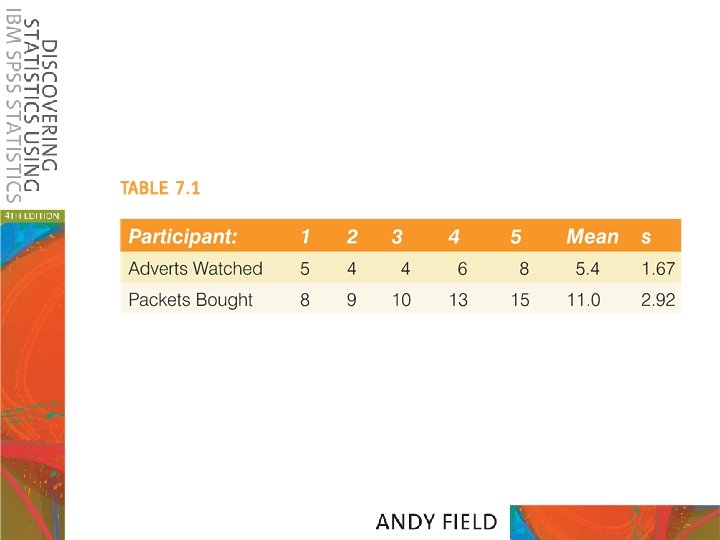
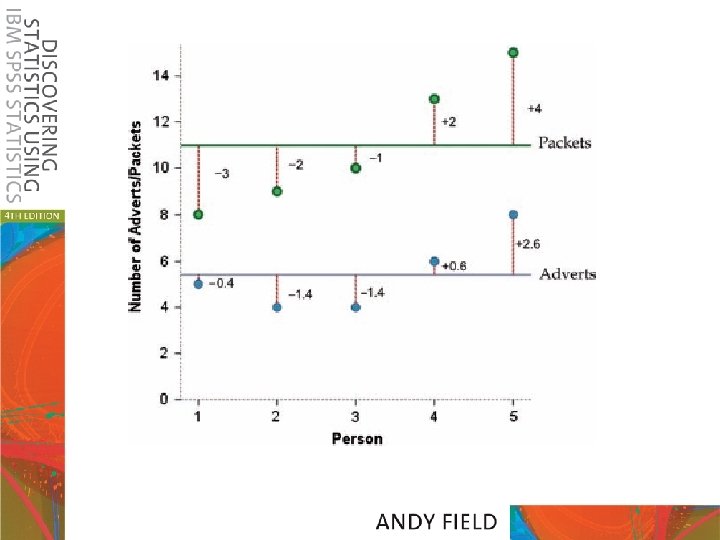
Measuring Relationships • We need to see whether as one variable increases, the other increases, decreases or stays the same. • This can be done by calculating the Covariance. – We look at how much each score deviates from the mean. – If both variables deviate from the mean by the same amount, they are likely to be related.
Modeling Relationships • First, look at some scatterplots of the variables that have been measured. • Outcomei = (model ) + errori • Outcomei = (b. Xi ) + errori
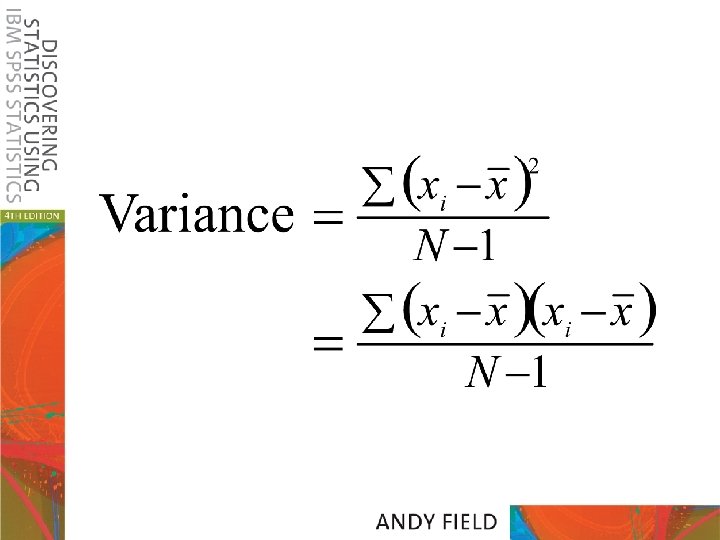
Revision of Variance • The variance tells us by how much scores deviate from the mean for a single variable. • It is closely linked to the sum of squares. • Covariance is similar – it tells is by how much scores on two variables differ from their respective means.
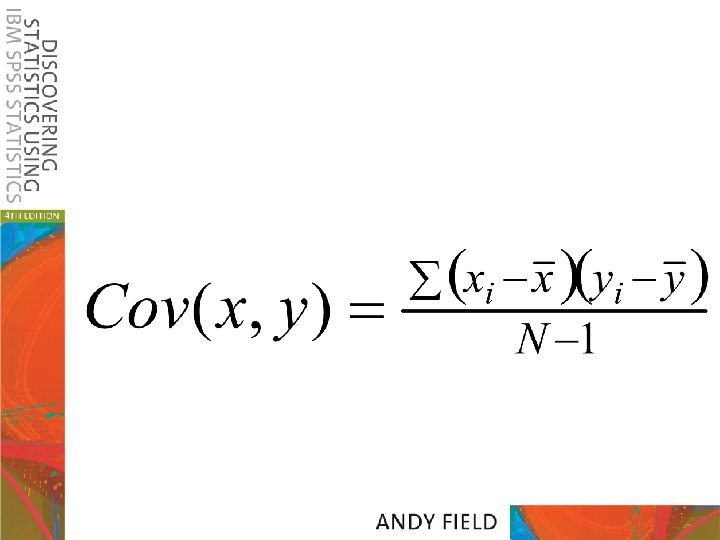
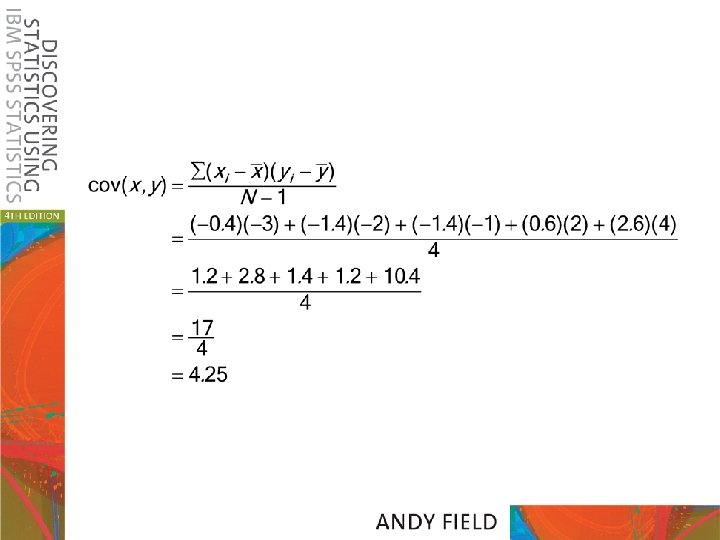
Covariance • Calculate the error between the mean and each subject’s score for the first variable (x). • Calculate the error between the mean and their score for the second variable (y). • Multiply these error values. • Add these values and you get the cross product deviations. • The covariance is the average crossproduct deviations:
Problems with Covariance • It depends upon the units of measurement. – E. g. The Covariance of two variables measured in Miles might be 4. 25, but if the same scores are converted to Km, the Covariance is 11. • One solution: standardise it! – Divide by the standard deviations of both variables. • The standardised version of Covariance is known as the Correlation coefficient. – It is relatively unaffected by units of measurement.
The Correlation Coefficient
The Correlation Coefficient
Correlation: Example • Anxiety and Exam Performance • Participants: – 103 students • Measures – Time spent revising (hours) – Exam performance (%) – Exam Anxiety (the EAQ, score out of 100)
Conducting Correlation Analysis
Doing a Correlation
Bootstrap-sample correlation Bootstrap Sample 1 -0. 50 Sample Bootstrap Sample 2 Bootstrap Sample N -0. 72 … … -0. 81 95% of bootstrap samples
Correlation Output
Reporting the Results
Things to know about the Correlation • It varies between -1 and +1 – 0 = no relationship • It is an effect size – ±. 1 = small effect – ±. 3 = medium effect – ±. 5 = large effect • Coefficient of determination, r 2 – By squaring the value of r you get the proportion of variance in one variable shared by the other.
Experimental Research Methods • Cause and Effect (Hume, 1748) 1. 2. 3. Cause and effect must occur close together in time (contiguity); The cause must occur before an effect does; The effect should never occur without the presence of the cause. • Confounding variables: the ‘Tertium Quid’ – A variable (that we may or may not have measured) other than the predictor variables that potentially affects an outcome variable. – E. g. The relationship between breast implants and suicide is confounded by self-esteem. • Ruling out confounds (Mill, 1865) – An effect should be present when the cause is present and when the cause is absent the effect should be absent also. – Control conditions: the cause is absent.
Correlation and Causality • The third-variable problem: – in any correlation, causality between two variables cannot be assumed because there may be other measured or unmeasured variables affecting the results. • Direction of causality: – Correlation coefficients say nothing about which variable causes the other to change
Nonparametric Correlation • Spearman’s Rho – Pearson’s correlation on the ranked data • Kendall’s Tau – Better than Spearman’s for small samples • World’s best Liar Competition – 68 contestants – Measures • Where they were placed in the competition (first, second, third, etc. ) • Creativity questionnaire (maximum score 60)
Correlation Output Spearman’s rho
Correlation Output Kendall’s tau
(Point-)biserial correlation • Point-biserial correlation, rpb: relationship between – a continuous variable and – a variable that is a discrete dichotomy (no underlying continuum) • Biserial correlation, rb: relationship between – a continuous variable and – a variable that is a continuous dichotomy (continuum underlying the two categories)
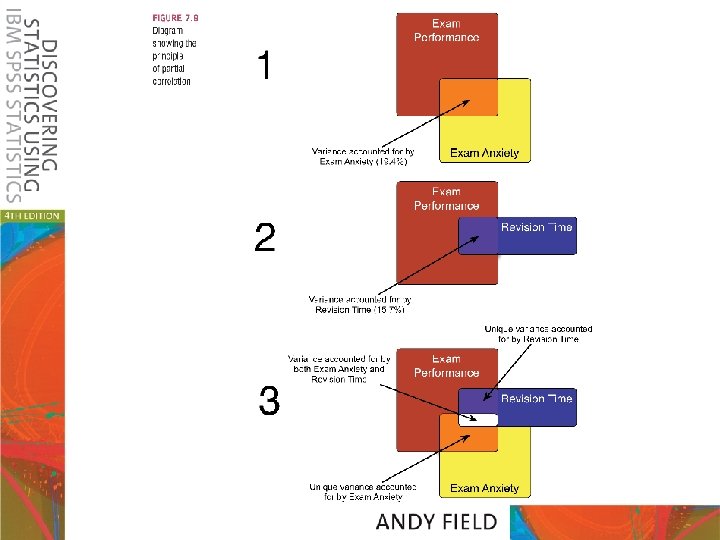
Partial and Semi-Partial Correlations • Partial correlation: – Measures the relationship between two variables, controlling for the effect that a third variable has on them both. • Semi-partial correlation: – Measures the relationship between two variables controlling for the effect that a third variable has on only one of the others. Slide
Andy Field
Doing Partial Correlation
Partial Correlation Output
Conclusion • • Scattergram Covariance Pearson’s correlation Bootstrapping for significance testing and confidence intervals • Correlation and causation • Non-parametric correlation • Partial correlation Slide