Correlation Definition Shows the direction and the strength


- Slides: 31
Correlation
Definition Shows the direction and the strength of the relationship between two variables.
Scatter plot for correlational data
Examples of positive and negative relationships Beer Coffee
Positive correlation: when a small amount of one variable is associated with a small amount of another variable, and a large amount of one variable is associated with a large amount of the other.
Negative correlation: when a small amount of one variable is associated with a large amount of another variable, and a large amount of one variable is associated with a small amount of the other. 120 110 PULLUPS 100 90 80 70 140 150 WEIGHT 160 170 180 190 200 210 220
Perfect Correlation As X changes a unit, Y changes a specific increment.
example 100 A perfect correlation David Peter 90 Mark Jim STRENGTH 80 Ken 70 140 150 WEIGHT 160 170 180 190 200
Not always the correlation is perfect. Guess?
120 110 100 STRENGTH 90 80 70 140 150 WEIGHT 160 170 180 190 200 210 220
Zero correlation: when there is no association between two variables.
Example A zero correlation
4 120 7 110 15 8 13 10 17 9 5 100 20 IQ 19 2 90 12 1 80 14 6 11 3 18 16 70 140 150 WEIGHT 160 170 180 190 200 210 220
Three degrees of relationship Zero weak Perfect
Examples of different values for relationships
practice For each pair, tell whether r is high, moderate, low or zero. ± 1 - Correlation between math ability and shoe size in K-12 2 - Height and intelligence in adult population 3 - Crime rate and the number of churches 4 - The academic degree and income 5. The number of cars and the number of accidents. 6. The height and age of k-12 students. 7. k-12 students’ scores on a math test and a science test 8. k-12 students’ scores on a math test and a PE test 9. The birthrate and social economic level 10. The length of the base of a square and the length of its diagonal.
Conclusion If A correlates with B, three possible causal relationship exist A causes B, B causes A, or C causes both A and B/
Interpreting correlations • Correlation does not demonstrate causation 1. Number of books at home and students’ academic achievement 2. The faster windmills are observed to rotate, the more wind is observed to be 3. The number of storks and birth rate in Denmark 4. Earlier wake- up times are consistently related to higher GPA.
Real examples Correlation Confusion • • Eating chocolate, number of acnes. Drug use and income Crime rate and the number of death penalties Number of youth Joining terrorists and unemployment
Changing Together
Changing Together
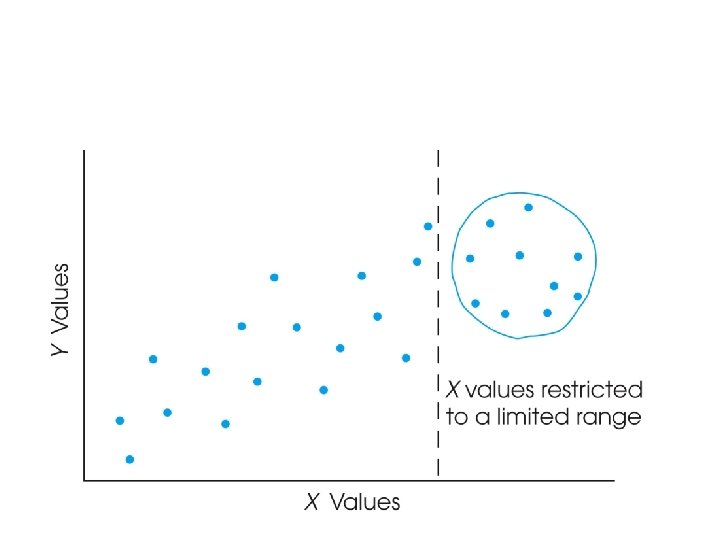
Restricted range
r =. 52 Fear of Death r = -. 40 r =. 10 Sixth Graders First graders Cognitive Development
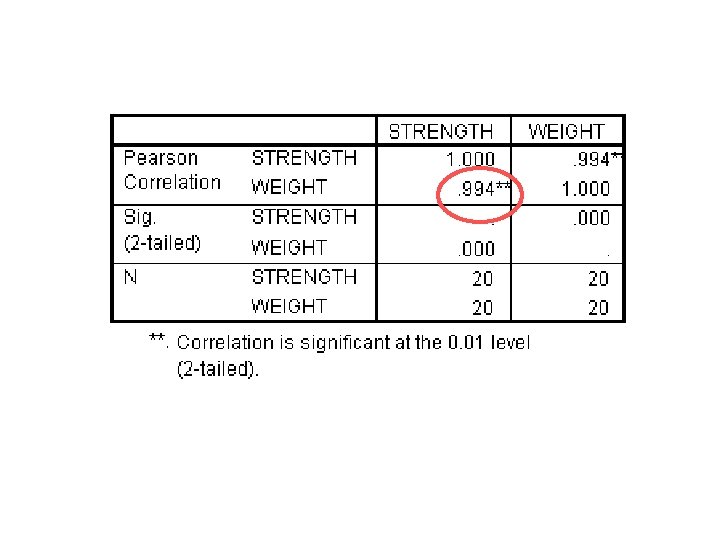
Correlation of sample and population
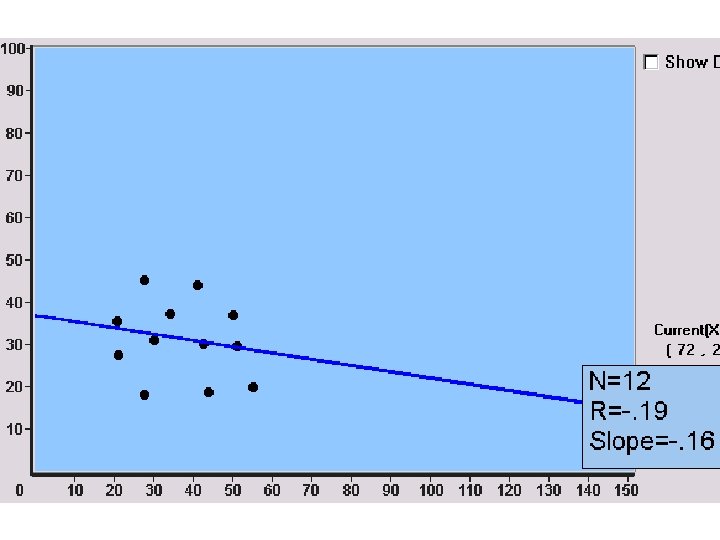
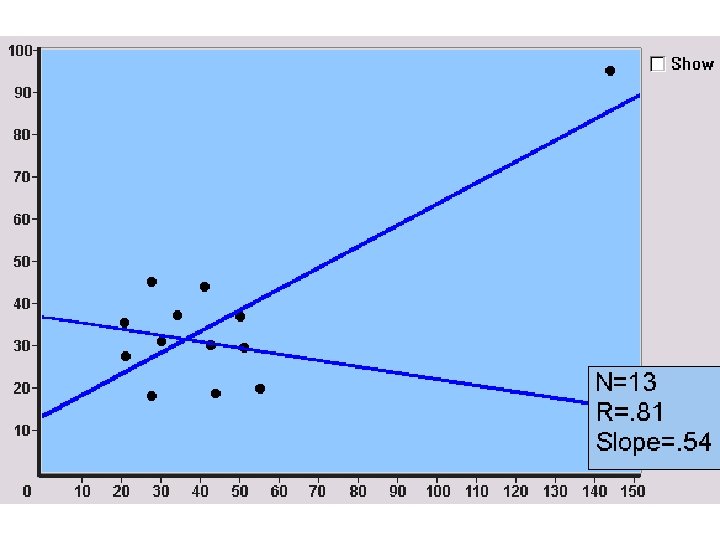
Influence of outlier on correlation
Spearman correlation • Spearman correlation formula is used with data from an ordinal scale (ranks) – Used when both variables are measured on an ordinal scale Students Jim Jennifer Abdul Ross Kate Tara Mike Rank in Math 1 2 4 3 5 7 6 Rank in science 3 2 1 4 5 6 7
Other types of correlation